
|
|
|
Fourier-transform spectroscopy (FTS) is a versatile measurement method and has found wide-spread application in research and development, monitoring of industrial processes, forensics, etc.1 Despite decades of development and improvement of Fourier-transform (FT) spectrometers, many of their attributes still show the potential for significant improvement. Two attributes that are of major significance for the performance of FT spectrometers are the increase of the spectral radiance of the light sources employed in conventional spectrometers and the increase of the measurement speed. Modern superluminescent light sources offer superior levels of spectral radiance when compared to the traditionally employed incandescent light sources. Due to this higher brightness measurements with a higher signal-to-noise ratio can be made. Also, the higher light throughput enables measurements at a higher repetition rate, which ultimately is limited to scanning speed of the interferometers employed in FT spectrometers. Repetition rates of up to can be achieved with rotating interferometers,2 and interferometers exhibiting even higher repetition rates are under development.3 An entirely different approach to high-throughput high-speed FTS was pursued by van der Weide 4, 5, 6 It is based on heterodyne frequency-comb spectroscopy and employs two frequency combs with slightly different mode spacing. This approach, which we refer to as frequency-comb Fourier-transform spectroscopy (C-FTS), relies on expensive mode-locked lasers but enables high-throughput FTS with demonstrated repetition rates of . However, even in this case one has to rely on moving cavity mirrors. In this work we pursue a variant of the van der Weide ’s approach. We demonstrate that their heterodyne frequency-comb spectroscopy can be conducted with inexpensive and technically simple continuous-wave (CW) frequency-comb generators. We refer to our approach as CW C-FTS. A major advantage of our approach is that it relies on an all-fiber laser design and does not involve the active control of moving parts such as cavity mirrors. A simplistic explanation of C-FTS is provided in the following (for more details see Ref. 4 and references therein). The method relies on two light sources whose spectra are characterized as frequency combs with slightly different mode spacing. The spacing of the first comb is [Hz], while that of the second comb is , where and is the highest mode number in either of the combs. When overlapping the combs, the time trace of the optical power exhibits variations at various beat frequencies. The low-frequency portion of the beating can be expressed as , where and are the mode numbers in the first and second comb, respectively. The low-frequency part of this spectrum consists of harmonic beating frequencies , and the beating amplitude at the harmonics is the geometrical mean of the amplitudes at the frequencies and . Both of these frequencies lie very close to each other, and the amplitude of the ’th beating frequency is hence a measure for the amplitude at the frequency . In this way one can monitor the amplitude of high-frequency optical waves (THz to PHz) by monitoring the above optical beating in the low-frequency range (typically kHz to GHz). In an experiment, the time trace of the overlapped frequency combs is detected and the beating spectrum is then inferred from the Fourier transformation of the time trace. Our experimental apparatus for the generation and analysis of tunable CW frequency is depicted in Fig. 1. In Fig. 1a the details of a frequency comb generator are displayed. The layout is based on the work reported by Qureshi 7 It consists of three salient components: a fiber ring cavity, a semiconductor-based linear optical amplifier [Finisar∕Genoa G111 (Ref. 8)] emitting in the telecommunication range, and an etalon (Micron Optics FFP-I, finesse: 40, mode spacing: ). The etalon selects harmonic frequencies from the amplified spontaneous emission of the linear amplifier and the ring cavity sustains CW lasing at these frequencies. The cavity also contains a variable optical attenuator (JDS Uniphase MV47W) that is used to control the gain in the cavity and thus the output power of the comb generator. Other elements are a polarization controller (Fiber Control FPC) for maintaining a linear polarization in the mode cavity, and an optical isolator (AOC Tap-WDM-Isolator Hybrid) that guarantees unidirectional lasing operation. The frequency of the modes transmitted by the etalon is temperature-tunable by . The length of the ring cavity is chosen so that several cavity modes reside within a mode submitted by the etalon. Optical power is subtracted from the cavity by a 2% output coupler (integrated into the isolator). As shown in Fig. 1b, the output from two comb generators is combined and the optical power of this combination is then monitored with a data acquisition system consisting of a photoreceiver (New Focus 1592; 3.5 GHz bandwidth) and a real-time sampling oscilloscope (Tektronix TDS7404; bandwidth, ). The time trace recorded with this device is then Fourier transformed. The output can also be recorded with an optical spectrum analyzer (OSA; Agilent 86142B, resolution). Fig. 1Experimental setup. (a) Layout of the frequency-comb generator; LOA: linear optical amplifier; PMC: polarization maintaining control; VOA: variable optical attenuator; arrow: optical isolator. (b) Overall setup. The output from two frequency generators (FCG A and B) is combined and the time trace of the optical power is recorded with a photoreceiver and an oscilloscope (OSC). The output can be spectrally analyzed with an optical spectrum analyzer (OSA). 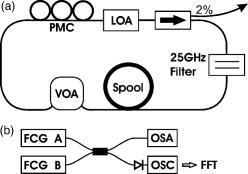 The results from our experiments are shown in Fig. 2. Figure 2a displays the spectra of both combs. An insert in this figure zooms in on the top of the spectrum. The individual cavity modes can be discerned. Each spectrum consists of modes with a spacing. Figure 2c shows the Fourier transformation of the time trace recorded, both for a single comb and for combined combs. One clearly sees a strong contribution below for both cases. The strong peak at is an artifact caused by the data-acquisition system. The contribution below 300 MHz is caused by optical beating of the cavity modes (spacing ) within all modes transmitted by the etalon (width ). The low-frequency component is also prevalent in the combined output, and there is also a second component around . This contribution stems from the mutual optical beating of the closely spaced comb modes in comb A and B. This was confirmed by temperature-tuning the mode frequency of the etalon in one comb generator and by observing a shift of the center frequency of the mutual beating spectrum over the whole frequency range in Fig. 2c. Since the etalon modes in both lasers are rather broad, the mutual beating spectrum appears to be smeared out rather than exhibiting a fence of beating frequencies, as expected from the above theory. For a setup with a larger detection bandwidth it would be possible to increase and to discern individual cavity modes in the mutual beating spectrum. Fig. 2Spectra and Fourier transformation of the output of the frequency-comb generators. (a) Spectra from both cavities recorded with the OSA. An inset zooms in on the spectrum and reveals the etalon modes, spaced by . The detuning of the cavities by at is too small to be resolved by the OSA. (b) Same as in (a), however, the frequency combs are shifted to the red by . (c) Fourier transformation of time traces generated by the frequency combs in (a), both for an individual comb and for the combination of both. (d) Fourier transformation of the time traces generated by the combination of the frequency combs in (b). 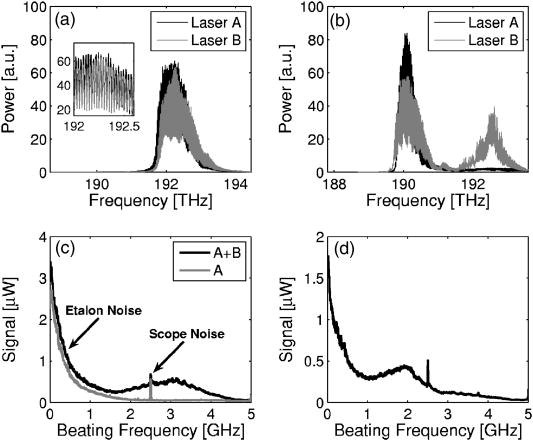 That this experimental apparatus indeed constitutes a spectrometer is demonstrated in Figs. 2b and 2d. By adjusting the polarization control and the gain in the cavity, the output of both comb generators was red shifted over 100 etalon modes and the detuning of both cavities was . From the above theory of C-FTS one would expect the mutual beating spectrum to shift toward lower frequency, which agrees very well with the result in Fig. 2d. Also, the spectra in Fig. 2b are about two times smaller than those in Fig. 2a, and the beating spectra in Figs. 2d and 2c accurately reflect this fact. In conclusion, we demonstrated the feasibility of CW C-FTS, for which we assembled two frequency comb generators, whose mode spacing and center frequency can be adjusted individually. We plan to improve the performance of the frequency comb generators (and hence of CW C-FTS) in several aspects: (1) We will decrease the etalon mode width by the use of high-finesse etalons. By so doing the frequency resolution of the CW C-FTS signal will be enhanced. (2) We will decrease the noise in the FTS and thus reduce the measurement time. The measurements here correspond to a measurement repetition frequency of , and our long-term goal is to improve this figure by at least an order of magnitude, which in turn will require a decrease in noise by two orders of magnitude. AcknowledgmentsThis material is based upon work supported by the Draper Technology Innovation Fund of the University of Wisconsin-Madison and the National Science Foundation under Grant No. CTS-0238633. ReferencesA. A. Christy,
Y. Ozaki, and
V. G. Gregoriou, Modern Fourier Transform Infrared Spectroscopy, 376 Elsevier Science, New York
(2001). Google Scholar
P. R. Griffiths,
B. L. Hirsche, and
C. J. Manning,
“Ultra-rapid-scanning Fourier transform infrared,”
Vib. Spectrosc., 19
(1), 165
–176
(1999). 0924-2031 Google Scholar
T. N. Buican and
H. C. Carrieri,
“Ultra-high speed solid-state FTIR spectroscopy and applications for chemical defense,”
9
(2004) Google Scholar
A. Schliesser,
M. Brehm, and
F. Keilmann,
“Frequency-comb infrared spectrometer for rapid, remote chemical sensing,”
Opt. Express, 13
(22), 9029
–9038
(2005). 1094-4087 Google Scholar
D. W. van der Weide,
J. Murakowski, and
F. Keilmann,
“Gas-absorption spectroscopy with electronic terahertz techniques,”
IEEE Trans. Microwave Theory Tech., 48
(4), 740
–743
(2000). https://doi.org/10.1109/22.841967 0018-9480 Google Scholar
D. W. van der Weide and
F. Keilmann,
“Coherent periodically pulsed radiation spectrometer,”
(1998). Google Scholar
K. K. Qureshi,
H. Y. Tam, and
W. H. Chung,
“Multiwavelength laser source using linear optical amplifier,”
IEEE Photon. Technol. Lett., 17
(8), 1611
–1613
(2005). 1041-1135 Google Scholar
A. K. Verma,
R. P. Ratowsky, and
D. A. Francis,
“Developments in linear optical amplifier technology,”
Proc. SPIE, 5248 203
–217
(2003). 0277-786X Google Scholar
|


