|
|
|
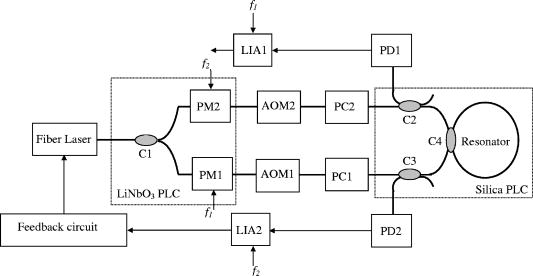
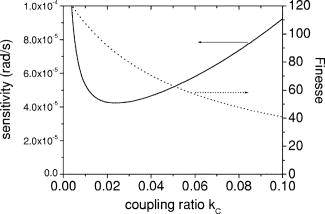
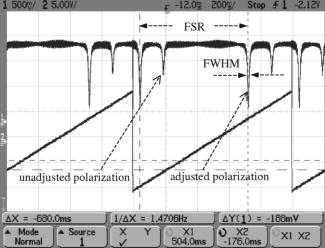
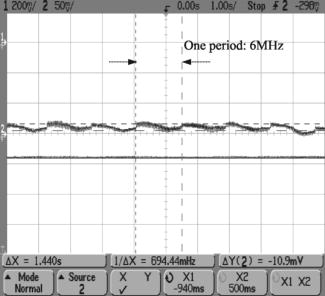
A small, robust, tactical-grade performance gyro is vital for the successful implementation of the smart weapons and surveillance apparatus. A waveguide-type optical passive ring resonator gyro (OPRG) is a promising candidate.1, 2 The OPRG is a frequency-sensitive device. The gyro rotation is determined by the resonance frequency difference in the clockwise (CW) and counterclockwise (CCW) lightwaves due to the Sagnac effect.1 Light circulating many turns in the ring resonator can build up the Sagnac effect. Thus, a short-length sensing loop is required. In this letter, the phase modulation (PM) spectroscopy technique is chosen to detect the gyro signal using phase modulators.3 In the PM spectroscopy technique, the modulating signal and feedback signal do not interact, moreover the phase modulators are easy to be integrated with other optical devices. They will make the OPRG compact. Figure 1 shows a schematic diagram of the experimental setup of the OPRG system. The resonator is composed of a -long silica waveguide ring and a directional coupler (C4). The wavelength of the laser is and the diameter of the resonator is , so the scale-factor of the OPRG is1 . The silica planar lightwave circuit (PLC) is the key rotating sensing element in the OPRG. It consists of two input/output directional couplers (C2 and C3) and one resonator coupler (C4). The coupling ratio of couplers C2 and C3 is designed as 50%. The coupling ratio of coupler C4 is optimized by the total loss in the ring resonator, including propagation loss of silica waveguide ring, excess loss due to the curvature, and excess loss through coupler C4. Considering the temporal coherence of the laser, the resonance curve of a ring resonator is given by4, 5 where is the resonance depth; is the phase shift around one trip of the ring; ; is the total propagation loss in the ring; and are the coupling ratio and coupling loss of resonator coupler C4, respectively; is the spectral linewidth of the laser; and is the optical transmission time in the ring as . Here is the refractive index of the silica waveguide, is the ring length, and is the velocity of the light in the vacuum. Gyro sensitivity is maximized when the slope of resonance dip is the largest; namely, when the total loss in the ring resonator and the linewidth of the laser are determined, there is an optimum for gyro. Figure 2 shows the shot-noise-limited sensitivity and the finesse of the ring resonator versus the coupling ratio . Here we use typical parameters of silica PLC and other devices. The losses of the waveguide and the coupler are assumed to be and . The wavelength, spectral linewidth, and output power of the fiber laser are , , and , respectively. The quantum efficiency of the photodiode (PD) is 0.8. The bandwidth of the measuring system is . The coupling ratio of coupler C4 is variable.In the experiments, the resonance curve of the silica waveguide ring resonator was tested first. A low-frequency sawtooth waveform at was applied to the fiber laser, and then the frequency of the fiber laser changed linearly with time. The output of the ring resonator was monitored by a PD. The oscilloscope trace of Fig. 3 shows the applied voltage and the resonance curve observed in the PD. In Fig. 3, the applied voltage is a sawtooth wave with a voltage of about and a period of . For a deeper resonance curve, the times corresponding to the free spectral range (FSR) and the full width at half maximum (FWHM) are and , respectively. Because the frequency of the laser changes linearly with the input voltage at , the frequency of the fiber laser changes linearly with time at . Thus, the FSR, FWHM, finesse , and the resonance depth of this ring resonator are , , 54.8, and 70%, respectively. The shallower resonance dips caused by the unadjusted eigenstate of polarization in the resonator can also be seen in the upper curve in Fig. 3. This may be overcome by using two polarization controllers (PCs) to adjust the polarization state of the input light before the silica PLC, as shown in Fig. 1. The oscilloscope trace of Fig. 4 shows the demodulation curves at the high frequency lock-in amplifiers (LIAs) for both CW and CCW lightwaves. The separation between each discriminant is the FSR. From Fig. 4, we notice that the demodulation curve has good linearity near the resonance point. The times corresponding to the linear part of the main resonance demodulation curve and one FSR are and , respectively. This means that the frequency deviation of the linear part is . The demodulation amplitude is . Thus, the slope of the demodulation curve for linear part is , since the scale factor of this OPRG is . Considering the present level of the low noise detection circuit, a signal larger than can be measured.6 Thus, the detection sensitivity of this OPRG will be . The discriminant corresponding to the shallower dips, as shown in Fig. 4, is also demodulated clearly. This verifies that the designed high-frequency LIA has high demodulation accuracy. After having obtained the parameters of the resonator, the open-loop system was set up. The acousto-optical modulator AOM1 (AOM2) between the PM1 (PM2) and C1 (C2) is used to give additional frequency shift for the CW (CCW) lightwave. When the fiber laser frequency is locked to the resonance frequency in the CCW lightwave by the feedback circuit, the PD output in the CCW lightwave is stable, as shown in the lower curve in Fig. 5. The difference between the driving frequencies of the two AOMs is equivalent to the Sagnac frequency difference due to gyro rotation. The driving frequency of AOM2 is , while the driving frequency of AOM1 changes linearly with time from . Thus, the equivalent Sagnac frequency difference between CCW and CW lightwaves will also change from linearly with time. The equivalent gyro output is shown in the upper curve in Fig. 5. As seen from Fig. 5, the gyro output corresponding to a frequency difference is . It is close to the calculated results from Fig. 4. In this letter, an open-loop-operation OPRG based on the phase modulation spectroscopy technique was setup. The resonator parameters were measured and the detection sensitivity of this OPRG will be . Additionally, the gyro output was observed with equivalent rotation input. AcknowledgmentsThe authors would like to acknowledge the Excellent Young Teachers Program of MOE, China, for their support (2003 No. 355). ReferencesS. Ezekiel and
R. Balsamo,
“Passive ring resonator gyroscope,”
Appl. Phys. Lett., 30
(9), 478
–480
(1977). https://doi.org/10.1063/1.89455 0003-6951 Google Scholar
K. Suzuki,
K. Takiguchi, and
K. Hotate,
“Monolithically integrated resonator microoptic gyro on silica planar lightwave circuit,”
J. Lightwave Technol., 18
(1), 66
–72
(2000). 0733-8724 Google Scholar
X. Zhang,
H. Ma,
C. Ding, and
Z. Jin,
“Analysis on phase modulation spectroscopy of resonator fiber optic gyro,”
Chin. J. Lasers, 32
(11), 1529
–1533
(2005). 0258-7025 Google Scholar
H. Ma,
Z. Jin,
C. Ding, and
Y. Wang,
“Influence of spectral linewidth of laser on resonance characteristics in fiber ring resonator,”
Chin. J. Lasers, 30
(8), 731
–734
(2003). 0258-7025 Google Scholar
H. Ma,
Z. Jin,
C. Ding, and
Y. Wang,
“Research on signal detection method of resonator fiber optical gyro,”
Chin. J. Lasers, 31
(8), 1001
–1005
(2004). 0258-7025 Google Scholar
G. Yang,
H. Ma,
X. Zhang,
K. Zhou, and
Z. Jin,
“Design of high frequency lock-in amplifier applied in R-MOG,”
Chin. J. Sens. Actuat., 18
(4), 863
–866
(2005). Google Scholar
|