
|
|
|
Three-dimensional shape measurement of microscopic objects is an important task in many fields such as biology, microelectronics, and microelectromechanical systems engineering. Scanning confocal microscopy has been used for this purpose, but the process of the three-dimensional scanning is rather time-consuming.1 Microscopic electronic speckle pattern interferometry can provide the three-dimensional information with a whole-field measurement, but it requires a focusing mechanism to record speckle patterns at various field depths.2 In digital holography, many holograms can be recorded with a charge-coupled device (CCD) in subseconds, and the images of the object are reconstructed numerically afterward. Because the focusing can be adjusted in the reconstruction process, digital holography is free from the process of mechanical focusing and can be used to monitor the dynamic change of objects. A digital holographic system can be configured in off-axis or in-line setups. In case of a typical in-line setup, the reconstructed object image is overlapped with the zero-order and the twin images. Although this problem can be solved with an off-axis setup, there is a drawback: about a half of the CCD pixels are filled with the carrier fringes and the distance between the object and the CCD must be long enough to separate the object image from the zero-order image. As a result, the numerical aperture of the imaging optics is reduced, and the obtained image is of low resolution. The best phase resolution achieved so far is 2 to on the blank image without any sample3, 4 and about in the flat area of the sample.5 The complex object field on the CCD plane can be measured in an in-line digital holographic system using the phase-shifting method.6, 7, 8 The object image reconstructed from this complex field is free from zero-order and the twin images and can have better phase resolution than can be obtained with an off-axis system. Therefore, an in-line phase-shifting digital holography system can be more useful in the precision shape measurement of transparent objects whose thickness or height profiles are proportional to the phase profiles of their complex images.4, 5, 9, 10 In this letter, very precise phase-contrast imaging using in-line phase-shifting digital holographic microscopy is reported. The three-dimensional shape of a titanium phase test pattern was measured with the phase fluctuation of without a sample and with a sample, corresponding to about 5.51-nm resolution. Both phase resolutions are better than those obtained with off-axis systems so far.3, 4, 5 The schematic of our in-line phase-shifting digital holographic microscopy system is shown in Fig. 1a. A linearly polarized laser ( , ) beam is collimated and divided into the object and the reference beams. An optical microscope (Zeiss Axiostar) is inserted in the object arm of the Mach-Zehnder interferometer. The collimated object beam enters through the microscope illumination port. The reference beam is reflected from a mirror attached to a piezoelectric transducer (PZT) controlled with a computer for phase shifting. Samples are observed through a , 0.25–numerical aperture microscope objective. The object and the reference beams are combined by a beamsplitter placed in front of a CCD camera (Kodak MEGAPLUS 1.0/MV, pixels, pixel size, 8 bits). The full field of view of the system with the objective lens is . Fig. 1(a) In-line phase-shifting digital holographic microscopy setup: SF, spatial filter; BS, beamsplitter; M, mirror; PZT-M, PZT-attached mirror; MO, microscope objective. Inset, prepared sample: S, sapphire substrate; T, titanium pattern. (b, c) Phase-shifted holograms on the CCD plane without and with the test pattern. (d, e) Amplitude and phase images of the test pattern.  A phase test pattern similar to the USAF1951 resolution-test pattern, as shown in Fig. 1d, was made to test the phase resolution of our system. The size of bars in the largest group is , and the gap between them is of the same size. The second largest group is as large as 90% of the largest, and the group sizes are reduced similarly until the smallest bar becomes . About of titanium was deposited on a sapphire substrate with 0.2-mm thickness by electron-beam evaporation method. The sapphire substrate had antireflection coatings on both surfaces to reduce the multiple reflections. Negative electron beam resistor (ER) was coated on the Ti layer, and ten groups of test patterns were written with a scanning electron microscope. After developing the negative ER, Ti was milled with an argon ion milling machine for a few minutes. Remaining negative ER was burned by oxygen plasma. The three-dimensional shape of the Ti phase test pattern was measured by comparing the complex object fields on the sample plane reconstructed numerically from the complex object fields on the CCD plane with and without the test pattern in the object path. Four phase-shifted holograms of the flat area near the pattern were acquired. One of them is shown in Fig. 1b. Their intensity distributions are given by In Eq. 1, is the object beam intensity; is the reference beam intensity; and is the initial phase difference between the object and the reference beams. is the step size of the phase shift controlled with the PZT mirror and equals about /2. It does not need to be exactly , because the error can be corrected with a self-calibration algorithm.11 and the complex object field on the CCD plane, , is obtained by using the same algorithm. Four more holograms were captured after moving the Ti test pattern into the measurement area. One of them is in Fig. 1c. The complex amplitude on the CCD plane, with the test pattern inserted was obtained similarly to how was obtained. is the object beam intensity, and the additional phase is due to the test pattern.The object field on the plane corresponding to the top of the test pattern, , was reconstructed from using the plane wave expansion method devised in Ref. 12. We chose the plane wave expansion method, also known as angular spectrum method,13 because there is no restriction on the reconstruction distance. The object field on any reconstruction plane parallel to the hologram plane can be obtained from the following transformation of the object field on the hologram plane: The value of that made the reconstructed amplitude image of the test pattern, , sharpest was used as the proper distance from the CCD plane to the object plane. The object field on the same plane without the pattern, , was reconstructed from by the same method. The reconstructed amplitude image is shown in Fig. 1d. The Ti pattern looks dark due to the attenuation of light by titanium. Figure 1e is the phase image of the test pattern obtained by unwrapping the phase difference of and .The phase fluctuation of the blank phase image obtained without any sample inserted in the object beam path was measured to check the lower bound of the phase measurement precision. The phase variation along a 1000-pixel-long line is shown in degrees in Fig. 2a, whose standard deviation is . The phase noise increases if a test object is inserted in the object beam path for many reasons such as the multiple reflections between the optical surfaces and the scattering by the dust particles on the sample surface. The phase variation along the -long horizontal dotted line marked in Fig. 1e, which is in the plateau of the phase image of the test pattern, is shown in Fig. 2b. Its standard deviation is . Fig. 2(a) Phase variation of the blank image obtained without the test pattern. Standard deviation is . (b) Phase variation along the horizontal line in Fig. 1e. Standard deviation is . (c, d) Height profiles of the test pattern along the horizontal and vertical dotted line in the square marked in Fig. 1e. (e) Three-dimensional shape of the test pattern in the square area marked in Fig. 1e. (f) Three-dimensional shape of the smallest pattern in Fig. 1e. 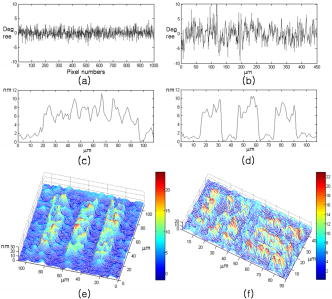 The interference fringes due to the multiple reflections are not noticeable in the area where titanium is not deposited, but they can be seen on the titanium pattern. It is because the surfaces of the substrate are antireflection coated whereas the titanium surfaces are not. As a result of these multiple reflections, the phase fluctuation on the titanium pattern is increased to instead of . The profile of the Ti test pattern height, , can be obtained from the relation where is the unwrapped phase difference between and plotted in Fig. 1e. and are the refractive indices of titanium and air.The height profile of a titanium bar pattern, along the horizontal dotted line in the square marked in Fig. 1e, is shown in Fig. 2c. As mentioned above, the multiple reflections increased the height fluctuation to corresponding to of phase variation. The height profile of the three-titanium-bar pattern, along the vertical dotted line in the square marked in Fig. 1e, is shown in Fig. 2d. The decreased height fluctuation on the substrate compared to the Ti pattern is due to the reduced multiple reflections on the substrate by antireflection coatings. The three-dimensional shapes of the titanium test patterns in the square and in the rectangle marked in Fig. 1e are shown in Figs. 2e and 2f. The average height of the titanium area is . It can be seen that even the smallest bar group of the test pattern has been made close to the design value of (width) (length) (height) bar size. In summary, we have developed a precision in-line phase-shifting digital holographic microscopic system. The use of an in-line configuration made it possible to estimate the complex object fields on the CCD plane by the phase-shifting method. A self-calibration algorithm was used to enhance the phase accuracy by eliminating the phase-shift error. The complex object fields on the sample plane reconstructed numerically from the complex object fields on the CCD plane has a higher phase resolution than could be obtained with off-axis digital holographic systems so far. The three-dimensional shape of a titanium phase test pattern was measured. The phase fluctuation level was increased to in the flat area of the test pattern and to in the titanium deposited area (corresponding to of titanium thickness) due to the multiple reflections of the laser light. This system can be applied to the precision three-dimensional shape measurement of transparent microscopic objects with nanometer thicknesses. AcknowledgmentsWe thank S. Jo and H. Lee for the preparation of the titanium phase test pattern. This study was supported by a grant No. 105025001 from Korea Science & Engineering Foundation. ReferencesConfocal Microscopy, Academic Press, London (1990). Google Scholar
Digital Speckle Pattern Interferometry and Related Techniques, John Wiley & Sons, Chichester, England (2001). Google Scholar
E. Cuche,
P. Marquet, and
C. Depeursinge,
“Simultaneous amplitude-contrast and quantitative phase-contrast microscopy by numerical reconstruction of Fresnel off-axis holograms,”
Appl. Opt., 38
(34), 6994
–7001
(1999). 0003-6935 Google Scholar
P. Marquet,
B. Rappaz,
P. J. Magistretti,
E. Cuche,
Y. Emery,
T. Colomb, and
C. Depeursinge,
“Digital holographic microscopy: A noninvasive contrast imaging technique allowing quantitative visualization of living cells with subwavelength axial accuracy,”
Opt. Lett., 30
(5), 468
–470
(2005). https://doi.org/10.1364/OL.30.000468 0146-9592 Google Scholar
C. Mann,
L. Yu,
C. Lo, and
M. K. Kim,
“High-resolution quantitative phase-contrast microscopy by digital holography,”
Opt. Express, 13
(22), 8693
–8698
(2005). https://doi.org/10.1364/OPEX.13.008693 1094-4087 Google Scholar
I. Yamaguchi and
T. Zhang,
“Phase-shifting digital holography,”
Opt. Lett., 22
(16), 1268
–1270
(1997). 0146-9592 Google Scholar
T. Zhang and
I. Yamaguchi,
“Three-dimensional microscopy with phase-shifting digital holography,”
Opt. Lett., 23
(15), 1221
–1223
(1998). 0146-9592 Google Scholar
I. Yamaguchi,
J. Kato,
S. Ohta, and
J. Mizuno,
“Image formation in phase-shifting digital holography and applications to microscopy,”
Appl. Opt., 40
(34), 6177
–6186
(2001). 0003-6935 Google Scholar
G. Popescu,
T. Ikeda,
R. R. Dasari, and
M. S. Feld,
“Diffraction phase microscopy for quantifying cell structure and dynamics,”
Opt. Lett., 31
(6), 775
–777
(2006). https://doi.org/10.1364/OL.31.000775 0146-9592 Google Scholar
F. Charrière,
J. Kühn,
T. Colomb,
F. Montfort,
E. Cuche,
Y. Emery,
K. Weible,
P. Marquet, and
C. Depeursinge,
“Characterization of microlenses by digital holographic microscopy,”
Appl. Opt., 45
(5), 829
–835
(2006). https://doi.org/10.1364/AO.45.000829 0003-6935 Google Scholar
H. Y. Yun and
C. K. Hong,
“Interframe intensity correlation matrix for self-calibration in phase-shifting interferometry,”
Appl. Opt., 44
(23), 4860
–4869
(2005). https://doi.org/10.1364/AO.44.004860 0003-6935 Google Scholar
H. Y. Yun,
S. J. Jeong,
J. W. Kang, and
C. K. Hong,
“3-dimensional micro-structure inspection by phase-shifting digital holography,”
Key Eng. Mater., 270–273 756
–761
(2004). 1013-9826 Google Scholar
L. Yu and
M. K. Kim,
“Wavelength-scanning digital interference holography for tomographic three-dimensional imaging by use of the angular spectrum method,”
Opt. Lett., 30
(16), 2092
–2094
(2005). https://doi.org/10.1364/OL.30.002092 0146-9592 Google Scholar
|


