|
|
1.Introduction1.1.BackgroundCoupling of laser energy into a material is associated with complex laser–matter interactions and subsequent modifications to its local structure. Such conditions are found during the ablation of materials in various applications, such as laser micromachining, laser drilling and cutting, laser surgery, and pulsed laser deposition for the growth of thin films.1 With ever-increasing precision processing requirements, a better understanding of how energy is deposited and the transient electronic and physical properties of the material would help advance our ability to more accurately estimate the volume of material removed, the collateral mechanical damage, and hence, better meet the specific application requirements. In addition, such knowledge can be utilized to devise methods to help prevent, repair, or contain undesirable effects due to laser energy deposition that ultimately lead to material failure. An example of the latter application is laser damage occurring in optical components employed in high-energy laser systems. Postmortem examination of laser-modified material using scanning and transmission electron microscopies have revealed the structural characteristics of laser-induced craters in various materials.2, 3, 4 However, reconstructing the sequence of events leading to these permanent modifications requires information on the transient material response. Previous studies have employed various pump-and-probe techniques, in which the material was modified by an ablating laser pulse (pump), and the response was measured using a probe pulse that was time delayed with respect to the pump. For example, shadowgraphy imaging has provided information regarding the generation and propagation of shock waves and ejection of material.5, 6, 7, 8 Transient changes in material phase state and structure have been studied with the aid of reflectance microscopy,9 electron diffraction,10 and x-ray diffraction,11, 12 with temporal resolution ranging from several nanoseconds (ns) down to ∼100 femtoseconds (fs). However, these studies have attempted to capture the dynamic processes involved using a single-probe arrangement. For such a case, the interpretation of the experimental results relies on the exact reproducibility of the events, which is often dependent on the shot-to-shot pump laser stability. More importantly, for the estimation of kinetic parameters, an implicit and possibly erroneous assumption is made, namely, that all dynamic events (such as propagation of stress fields and ejection of material clusters) begin at t = 0, the arrival time of the ablating pulse. There have been a limited number of studies probing the same event at multiple time points in order to more accurately capture the kinetics of the dynamic material response.12, 13 Similarly, only a limited number of studies have imaged the same event employing multiple modalities (such as shadowgraphy and photothermal deflection7 or x-ray diffraction and optical absorption11) in order to take advantage of the enhanced sensitivity of each modality to a particular aspect of the ablation event. These more complex approaches enable a more complete description of the event and allow one to better correlate distinct physical processes (such as changes in material reflectance and shock-wave generation) occurring simultaneously. All these experimental studies have shown the feasibility of dynamic imaging and provided the groundwork for the design of a more advanced, versatile dynamic imaging system that, in principle, could provide more comprehensive information on the various aspects of an ablation event. However, to date there is no single system to address all the various aspects of laser ablation under the same conditions (laser parameters, amount of energy deposition, target material, etc.). There has been extensive theoretical work on predicting material response of through molecular dynamic simulations, with conflicting conclusions about the mechanisms driving ablation,14, 15, 16 but no single apparatus exists to help resolve these controversies based on experimental data. In this work, we describe a time-resolved microscope system designed to enable imaging of the sequence of events and the individual processes involved during the entire timeline, from the initial energy deposition to the final state of the material with adequate sensitivity and spatial and temporal resolution. This system is configurable into multiple imaging arrangements, such as multiview image acquisition at a single time point, multi-image acquisition at different time points of the same event, and tailored sensitivity to various aspects of the process. Using these configurations, we have obtained detailed information on the processes involved and material response, including (i) kinetics of shock wave propagation, (ii) the time of particle (material-cluster) ejection and their instantaneous speed and three-dimensional motion, and (iii) transient material phases and behaviors. Furthermore, we recognized that it is equally important to extend the investigation of the material response to much longer delays (≥100 ns) after the pump pulse as the cooling phase can proceed for hundreds of microseconds (μs) or longer times.17 We chose to demonstrate the capabilities of our time-resolved imaging system using a case example, namely the material response following laser energy deposition on the exit surface of fused silica samples (commonly referred to as exit surface laser–induced damage). This process is typically associated with material ejection and the formation of a crater on the surface. We chose this example for three main reasons, as follows:
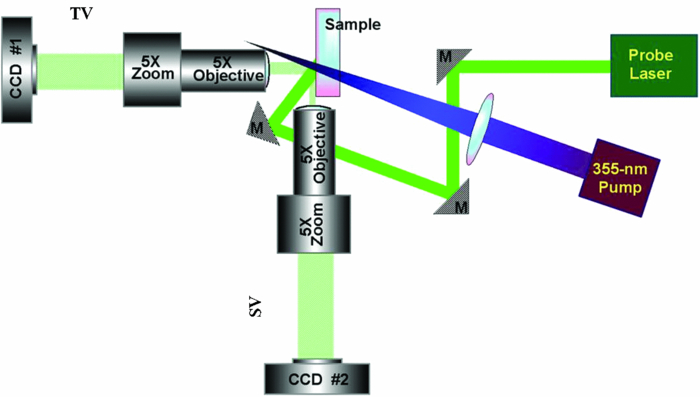
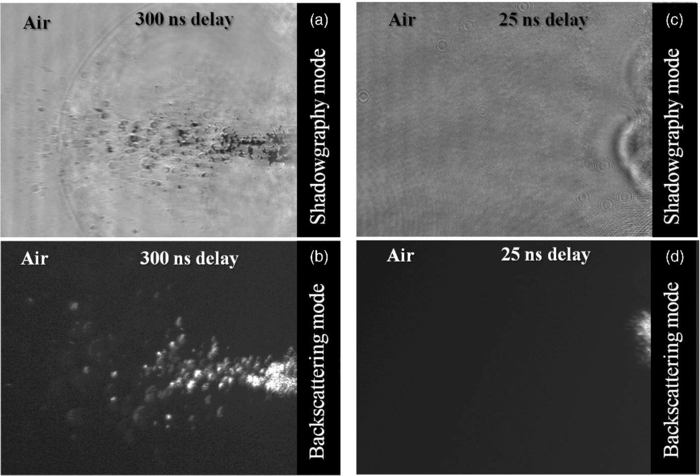
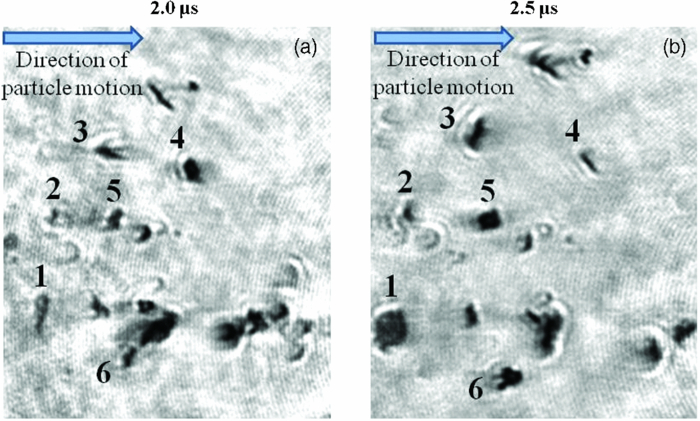
The objective of this paper is to provide general guidelines on the design and capabilities of a versatile time-resolved imaging apparatus that can be employed for a wide range of applications and materials. The paper is organized as follows. A summary of design requirements for a new apparatus is given in Sec. 1.2. Section 2.1 describes the sample preparation and laser parameters used to deposit energy in a localized fashion on the exit surface of fused silica samples. Section 2.2 presents the design of the basic time-resolved microscope system with nanosecond temporal resolution. This system has been used to visualize key processes and estimate preliminary kinetic parameters and the timeline of material response to localized energy deposition for this particular material. In Secs. 2.3–2.6, we discuss additional system configurations (i.e., backscattering, dual probe, high temporal resolution, and polarization sensitive) tailored to capture specific aspects along the timeline. We also provide example images at each step to illustrate the advantages of each approach, particularly in meeting the challenging requirements outlined in Sec. 1.2. At the end, Sec. 3 summarizes the preliminary findings regarding the timeline of events following laser energy deposition in fused silica without being exhaustive. A comprehensive study of the processes outlined here and an in-depth understanding of laser damage on the exit surface of fused silica are underway, and the results will be presented later. 1.2.Summary of Design Requirements for Novel Time-Resolved Imaging SystemThe system must provide adequate sensitivity to detect the various dynamic components of material response involved during the entire timeline (up to ∼100 μs) of a laser ablation or damage event. In addition, the acquired images must have sufficient spatial and temporal resolution to allow (i) the characterization of the onset and propagation of shock fronts, (ii) the nucleation of material transformations and transport, (iii) the early material response including initiation and propagation of cracks, melting, and swelling, as well as, (iv) estimation of the material kinetics (ejected material speed, size, trajectory, and ejection time following the arrival of the damage pulse) leading to crater formation. It should be noted that imaging of high-velocity phenomena requires particular attention be paid to the dynamic image spatial resolution, as discussed in Sec. 2.5. 2.Experimental System and Preliminary Results2.1.Laser Energy Deposition Protocol on Fused Silica SamplesAll experiments were conducted on 5-cm-diam and 1-cm-thick fused silica (Corning 7980, Corning, Inc., Corning, NY) windows prepared with high-quality, laser damage-resistant surfaces.18 A 15-cm focal length lens was used to focus 355 nm, 7.5-ns full-width-at-half-maximum (FWHM) laser pulses (Spectra-Physics, Santa Clara, CA), at ∼2 cm behind the exit surface of the sample. In this arrangement, we estimate the pump beam at the exit surface to have a diameter of ∼1 mm and a local average fluence of ∼50 J/cm2 over a 300×300 μm patch (with ∼20% contrast). Pristine surface locations were exposed to a single laser pulse leading to damage initiation with 80% probability. This procedure led to the formation of single or multiple damage pit craters on the order of 10–50 μm in diameter. Exposure of these locations to subsequent laser pulses at lower laser fluences (∼15–20 J/cm2) commonly led to an increase in the size of the damage site, a phenomenon that is commonly referred to as damage growth. All experiments were conducted in air at room temperature and pressure. 2.2.Basic Time-Resolved Microscope System Design for Imaging Crater Formation and Material EjectionShadowgraphy has proven to be a useful tool for imaging the material motion following laser ablation in various material systems.5, 6, 7, 8, 13 Because laser-induced surface damage is also associated with material ejection and the formation of craters during a laser damage event, the basic system was designed to be able to capture these main processes. In particular, the simultaneous recording of images that capture both the material ejection process and the formation of the damage site (namely, the evolution of its lateral dimensions) was needed. To achieve this capability, two identical orthogonally positioned microscope modules were employed with the focal plane of the first microscope positioned parallel to, while that of the second microscope was positioned perpendicular to, the surface of the sample on the air side. The focal planes of the two microscopes intersected at the sample's surface at the pump beam location (where it emerges from the bulk). We note that a variation of the system where the focal plane of the latter microscope is located within the bulk of the material will be discussed in Sec. 2.6. Both microscope modules utilized a long working distance 5 × objective (Mitutoyo America Corp., Aurora, IL) followed by a 5 × zoom lens. The images were focused onto separate charge-coupled devices (CCD) [Spiricon (Ophir, Logan, UT) 1616 × 1216 pixels] with an individual pixel size of 4.4 μm. The corresponding images are referred to as the transmission-view (TV) and side-view (SV) images, respectively. The system setup is illustrated in Fig. 1(a). The static spatial resolution is on the order of 1 μm, as measured by imaging a standard resolution target [see Fig. 1(b)]. The spatial calibration constant was measured to be ∼2.15 pixels/μm for both microscopes. A resolution of better than ∼2 μm is maintained for an image plane depth of ∼40 μm. Fig. 1(a) Basic time-resolved microscope system for simultaneous acquisition of .TV and .SV images of surface damage sites at various points during the timeline. (b) Image of resolution target slide with positive test pattern in the TV mode. M = mirror, BS = beamsplitter. 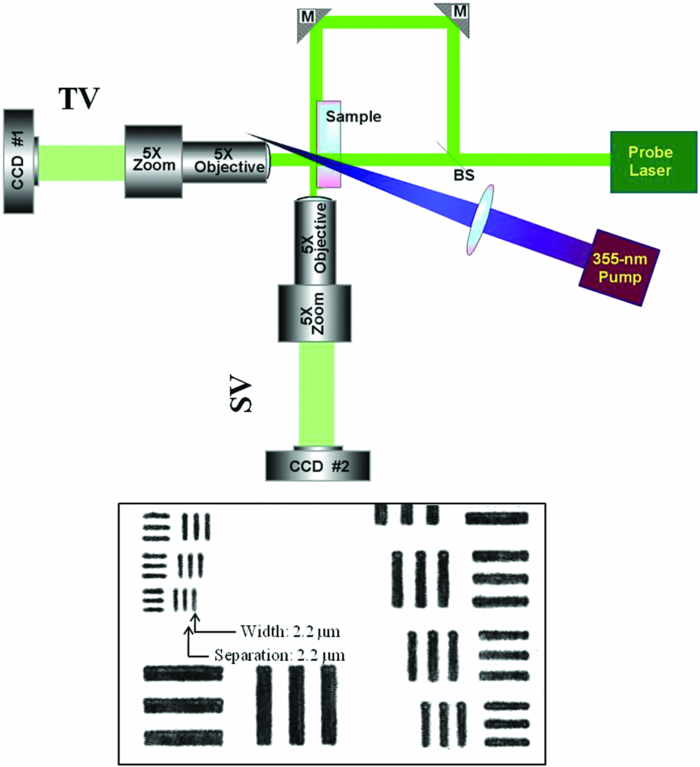 The images were captured using strobe-light illumination provided by a 532-nm, 4.5-ns duration (FWHM) probe pulse (Litron, Inc., Agawam, MA). The timing of the probe pulse was controlled by an adjustable externally triggered delay in reference to the pump pulse, thus allowing for imaging of various time points during the entire timeline of damage initiation and growth events. Although the pump-probe pulse jitter was ∼2 ns, for each event we recorded, the relative time delay between pump and probe with ∼0.5-ns resolution. To remove static features in the raw images arising from nonuniformities in the probe beam spatial profile, all images were divided pixel by pixel by a reference image acquired prior to damage at a pristine surface location. Figure 2 shows examples of removal of such artifacts via image processing. In particular, Fig. 2(a) illustrates a raw image and Fig. 2(b) illustrates the same image after normalization in SV mode. As a result, the interference fringes caused by partial reflection of the probe beam at the sample surface are largely removed. Similarly, background nonuniformities observed in a raw TV image in Fig. 2(c) are likewise removed after normalization, as shown in Fig. 2(d). Fig. 2Image normalization using pixel-by-pixel division by the reference image acquired at the pristine location prior to damage. SV image (a) before and (b) after normalization (images are 755×569 μm). TV image (c) before and (d) after normalization (images are 115×82 μm).  Representative images obtained with the basic system are shown in Fig. 3. Specifically, Figs. 3(a) and 3(b) display transient SV images from damage sites at two different locations at 25- and 400-ns delay after arrival of the pump pulse, respectively. In Fig. 3(a), several shock fronts are visible, which appear to originate from different points on the surface and travel through the air. However, no material motion is seen in this early delay time image. In contrast, a jet of particles is visible originating from the surface and traveling through the air at longer delays, as seen in Fig. 3(b). We note that particles near the surface are close together and in focus, whereas those further downstream are more spread out and, therefore, some are outside the in-focus imaging zone of the microscope system. The diameters of the observed particles are on the order of 1–10 μm. Also visible in Fig. 3(b) is the shock front traveling through the air with several particles ahead (downstream) of this front. Fig. 3Typical images using basic system configuration in Fig. 1: SV images at (a) 25-ns delay, (b) 400-ns delay, and (c) final (postdamage) taken from three different locations (images are 755×569 μm); TV images of (d) transient at 7-ns delay, and (e) final states of the same damage site (images are 67×50 μm). 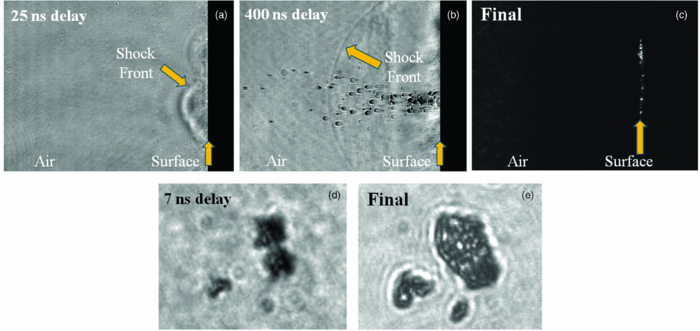 To precisely locate the surface of the sample, SV images of the damaged surface were acquired in a scattering mode (i.e., after blocking the SV beam path), thus forming an image using the photons from the TV beam path undergoing scattering at the damage site. An example of such an image taken after several damage sites had been formed along the surface is shown in Fig. 3(c). These sites are visible as a series of vertically displaced bright spots on the right-hand side and precisely determine the location of the sample exit surface in all SV images. Figures 3(d) and 3(e) present TV images of the same damage site captured at two different points in time. Specifically, Fig. 3(d) displays a transient image of a damage initiation site at 7-ns delay, whereas Fig. 3(e) displays the final crater several seconds later. These images clearly show a difference in the lateral dimensions of the crater, revealing that the crater is evolving over this time scale. Separate initiation sites appear to form but grow to the point where some of them coalesce. 2.3.Backscattering Illumination Configuration for Increased Sensitivity to Early Material MotionThe results shown in Fig. 3(a) indicate that material changes occurring at earlier times are only partially visualized due to obscuration of the SV beam caused by shock front propagation in the air. Thus, for detecting early material motion near the surface, a different imaging configuration is required. In general, dark-field microscopy is better able to detect small isolated particles than bright-field microscopy. For this reason, we modified the previous configuration by removing the beamsplitter and rearranging the mirrors so as to illuminate the sample from the same direction as the image formation. In particular, the probe beam was incident on the exit surface from behind the sample at ∼60 deg with respect to the surface normal, as shown in Fig. 4. In this arrangement, material motion or ejection becomes visible due to light directly backscattered from the material (dark field) rather than as a result of material obscuration (bright field). All other laser damage and imaging parameters remained the same as in the basic system shown in Fig. 1. Figure 5 compares transient images at the same delay times acquired using both SV shadowgraphy (bright-field) (Fig. 1) and backscattering (dark-field) modes (Fig. 4). These images are all from different but similar damage events. As shown in Figs. 5(a) and 5(b), images acquired at 300-ns delay in either SV configuration successfully capture the particle ejection process. However, the additional benefit offered by backscattering is apparent when viewing images at early delay times. As an example, at 25-ns delay time only the shock front is visible in the shadowgraphy mode [Fig. 5(c)], whereas material motion located behind the shock front is discernible in the backscattering configuration [Fig. 5(d)]. The latter image suggests that a swelling of the surface precedes the ejection of individual particles, thus revealing a critical aspect of the early material response to localized energy deposition that would otherwise not be apparent in the shadowgraphy mode. It should be noted, however, that artifacts like laser speckle (i.e., due to scattering and interference of coherent light by the expanding modified material and/or the ejected material clusters) can influence the quality of backscattering images as seen in Fig. 5, and therefore, these images are not ideal for measuring particle size or other fine features. 2.4.Dual-Probe Configuration for Measuring the Kinetic Properties of Ejected ParticlesMore accurate information regarding shock fronts and particle trajectory and motion can be obtained by visualizing the same event at multiple time points. This practical consideration prompted the need for an additional experimental configuration that could more accurately estimate the kinetic properties of material clusters and the propagation characteristics of shock fronts from individual events. Our approach is to employ dual image acquisition per event in order to quantify the relative motion of various objects and disturbances in the image. To capture images at two different delay times within the same damage event, a second 532-nm probe laser was added to the basic system (Fig. 1) whose pulse was delayed with respect to that of the first probe. This dual-probe configuration is schematically illustrated in Fig. 6. In order to differentiate the images from each probe, we utilized a polarization filtering method in which the output polarizations of the two probe lasers were set orthogonal to each other. The two beams were then combined using a polarizing beamsplitter into a single beam path. A standard (nonpolarizing) beamsplitter was used to establish both a TV path (not used at this time) and a SV path, similar to the geometry of the basic system (Fig. 1). The two illumination pulses from the SV path (delayed with respect to each other) were then imaged using the same microscope modules previously described. A final polarizing beamsplitter positioned after the microscope optics separated the two orthogonal polarization image components and directed them to separate CCDs. The time delays between the two probe pulses ranged from 100 to 500 ns. It should be noted that for the case of imaging ejected particles traveling through the air, as discussed here, the probe polarization state at each detector plane is preserved. In contrast, stress-induced anisotropy in the bulk of the material (arising from the shockwave propagation and material modifications such as cracks) can affect the probe polarization state upon traveling through the material. For this latter case, a single-probe configuration can be employed to provide useful information on the transient stress fields either in TV mode (images shown in Sec. 2.5) or in SV mode (not shown here, but it is a trivial extension of the configuration discussed in Sec. 2.6 for imaging bulk material modifications). Fig. 6Pump dual probe imaging configuration for SV multi-image acquisition of the same damage event at different delay times. PBS = polarizing beamsplitter, P = polarizer. 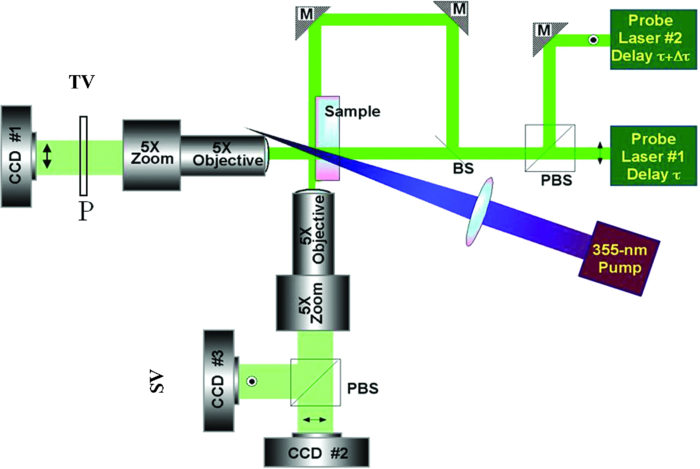 Prior to dual-image acquisition in this configuration, we also had to match the magnification and coregister the images captured by the two SV cameras. For this purpose, probe 2 was turned off and a quarter-waveplate was inserted into the path of probe 1 in order to illuminate the sample with circular polarization. This polarization state permitted simultaneous imaging of the same event in both SV CCD cameras. Subsequently, the location of the sample's surface was determined on each camera as well as the shift in pixel coordinates between the two cameras when imaging the same object. Following this image coregistration process, we were able to quantify the difference in the distance traveled by individual particles ejected from the surface as well as shock fronts during the time-delay interval between the two probes. This information allows us to more accurately estimate the instantaneous speed of a particle or shock front. For example, Fig. 7(a) shows a close-up image of particle ejecta at 2-μs delay, while Fig. 7(b) shows an image of the same event 0.5 μs later when the particles have traveled further from the surface. Relative positions of the particles do not change significantly, allowing for coregistration of most particles. In addition to translational motion, many particles can be seen to exhibit rotational motion. For instance, the particles denoted as 1–6 in Fig. 7 exhibit different projected dimensions at these two time points, providing information on their three-dimensional shape. We note that ejected particles can have different instantaneous speeds during the timeline; therefore, the relative probe delay in this dual-imaging configuration (Fig. 6) needs to be adjusted accordingly [i.e., shorter relative probe delay (∼100 ns) to better capture the trajectory of fast moving particles]. Another important aspect of laser ablation or damage that remains unexplored is the time duration of the material ejection process. More specifics pertaining to imaging of high-velocity phenomena are discussed in Sec. 2.5. 2.5.Configuration for Imaging High-Velocity Phenomena with Optimal Spatial ResolutionThe spatial resolution with which this microscope system can image dynamic events (such as shock front propagation and ejection of particles) is determined by the product of the speed of the transient events and the pulse duration of the imaging probe pulse. For example, the speed of the pressure front generated following laser energy deposition in fused silica is on the order of the speed of sound in the material (i.e., ∼6 μm/ns), as indicated by preliminary results illustrated in Figs. 3(a) and 3(b) and other studies.8, 17 In this case, the ∼4.5-ns probe pulse could only provide spatial resolution on the order of 30 μm when capturing these events. To resolve the dynamics of these key processes evolving at high speed and match the ∼1-μm static spatial resolution of the imaging system, the pulse duration of the laser should be sufficiently short. Specifically, in order to capture the moving pressure front with 1-μm spatial resolution, the probe pulse duration should be at least ∼170 ps. Furthermore, the imaging system must also be able to capture two images per each event more closely separated in time (subnanosecond) in order to better estimate instantaneous speeds because these may be changing during the timeline. To meet these requirements, the two probe lasers with 4.5-ns pulse duration described in Secs. 2.2–2.4 were replaced with a 532 nm, ∼150 ps in duration (FWHM) probe laser (EKSPLA, Vilnius, Lithuania). The short-duration probe pulses were also synchronized to the pump pulse using a variable, external delay signal. In addition, to allow for imaging of two time points, two probe pulses (probes 1 and 2) were generated by splitting the output of the picosecond laser into two paths using a 50%, nonpolarizing beamsplitter, as shown in Fig. 8. The reflected beam (probe 2) was directed toward an adjustable optical delay line with maximum ∼60-cm roundtrip, thus providing a relative delay of up to ∼4.15 ns with respect to the transmitted beam (probe 1). A half-wave plate was inserted within the delay line in order to rotate the polarization of probe 2 to a state orthogonal to that of probe 1 to enable implementation of the polarization filtering as described in Sec. 2.4. These two picosecond probe pulses were then recombined using a polarizing beamsplitter and followed a common path up to a second nonpolarizing beamsplitter. The latter element provided the SV and TV paths as described in Sec. 2.4 to illuminate the sample. Finally, an additional polarizing beamsplitter was placed after the TV microscope to separate the two orthogonal polarization image components (delayed with respect to each other), which were subsequently recorded on separate cameras (see Fig. 8, CCDs 1 and 2). The temporal profiles of the pump and probe pulses were monitored using high-speed, GaAs photodetectors (with rise time of ∼35 ps) and monitored by digital oscilloscope with sampling rate capability of 25 GSamples/s. Fig. 8(a) High temporal resolution (150 ps), dual probe imaging configuration for both TV and SV modes. λ/2 = half-wave plate. 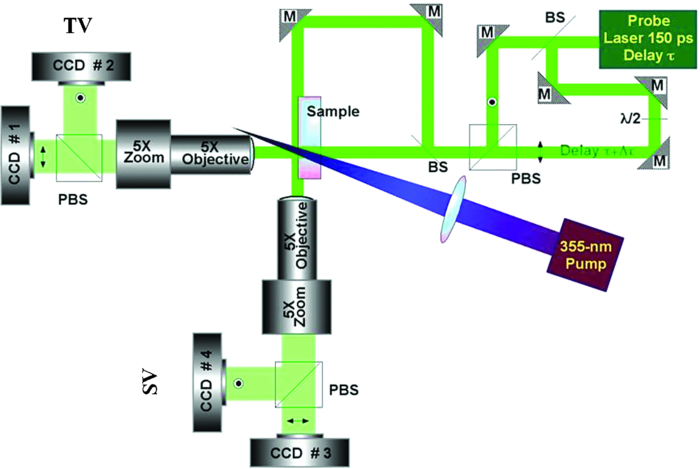 Examples of high temporal resolution images acquired in the TV mode are shown in Fig. 9. The transient dual images in Figs. 9(a) and 9(b) reveal the material response during energy deposition by the pump pulse (∼7.5 ns FWHM). The timing of the probe pulses with respect to the peak of the pump pulse (at t = 0) was inferred from the scope trace illustrated in Fig. 9(d). For this particular instance, the two probe pulses were separated by ∼1.16 ns. These transient images reveal that the material begins to optically absorb early on during the damage initiation process, and these absorbing regions grow in size during exposure to the laser pulse. The final dimensions of the damage craters are much larger, as indicated by the final image shown in Fig. 9(c). Fig. 9Typical high temporal resolution TV images of the same damage initiation event using the configuration depicted in Fig. 8. Images captured shortly (a) before and (b) after arrival of the peak of the pump pulse; (c) final state of the damage site. Images are 163×181 μm. (d) Plot of temporal profiles and relative arrival times of the pump, probe 1, and probe 2 pulses for the event illustrated in images (a–c). Probe delay is measured with respect to the peak of the pump pulse.  This high temporal resolution system can also be used to monitor the transient stress fields generated by the propagating pressure wave in the TV mode. This is achieved by blocking the path of probe 2 in Fig. 8 and utilizing only probe 1 (i.e., single-probe, polarization-sensitive TV acquisition mode). Figure 10 shows examples of the two polarization image components at 13.4-ns delay. The parallel polarization image in Fig. 10(a) represents the conventional shadowgraphy image illustrating the region of transient modified material and the shock front propagating at the interface on the air side. In contrast, the orthogonal polarization image maps the stress fields associated with shock front propagation in the material, as shown in Fig. 10(b). In the final images (not shown), residual stress was only observed near where cracks had been formed. This configuration is particularly useful for estimating the kinetics of the shock waves propagating at both the surface and in the bulk of the material just beneath the surface. Fig. 10Example of high temporal resolution, polarization-sensitive images acquired simultaneously in the TV mode (single probe) at 13.4-ns delay: (a) Parallel polarization image component, PP, and (b) orthogonal polarization image component, OP, relative to that of the incident probe pulse, respectively. Images are 290×305 μm. 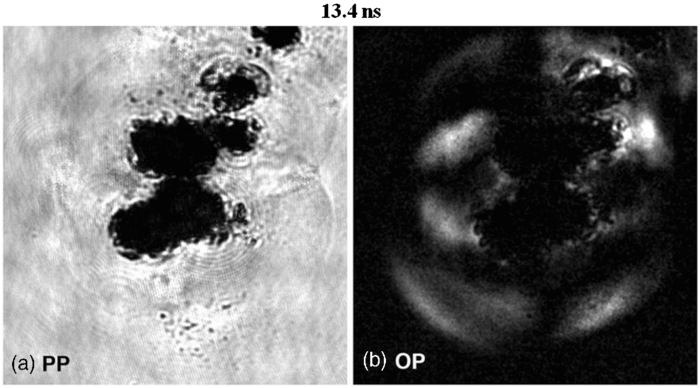 2.6.Configuration for Imaging Crater Formation in the Bulk of the MaterialThe SV mode of the system shown in Fig. 8 can also be used to image the material transformation occurring within the bulk material underneath the surface with high temporal resolution. For this purpose, it was necessary that the sample be cut and polished on both sides with optical quality finish to transmit the probe beam for SV shadowgraphic image acquisition. The focal plane of the imaging optics was adjusted to coincide with the crater location within the bulk of the material. We note that material ejection in the air is no longer visible in this configuration due to the optical path difference when imaging through the bulk compared to that when imaging through the air side (to capture images of the ejecta). Figure 11 shows examples of raw transient and final images of bulk modifications at two different damage sites (damage growth events, not initiation). The observed vertical, fine fringe pattern is a result of interference caused by partial reflection of the probe beam on the sample surface. Care must be exercised in properly positioning the sample and the SV microscope with respect to the probe beam path. Figures 11(a) and 11(b) illustrate the dynamics of the modified region beneath the surface at 5.6- and 8.1-ns probe delay, respectively. Transient features, such as shock front propagation, crater expansion in both lateral and depth dimensions, and crack growth into the bulk, are captured and reveal that the crater is evolving over this time scale. For comparison, the final images of the damage craters formed at these locations are presented in Figs. 11(c) and 11(d). Similar to the dual-probe TV imaging of two time points per event in Fig. 9, dual-probe SV imaging of crater formation can be employed to infer the kinetics of the bulk material modifications at early times with high temporal resolution. In addition, single-probe, polarization-sensitive SV mode can provide information on transient stress fields in the bulk of the material, similar to those presented in Fig. 10. 3.DiscussionThe material response during and following laser energy deposition is multifaceted, consisting of the generation of extreme temperatures and pressures over a microscopic volume involving transient material phase transformations, the generation and propagation of stress fields (shock fronts), material motion, and ejection, leading to crater formation. Thus, it seems reasonable that the task of describing this entire timeline is not suited for a single measurement modality. In this work, we presented a time-resolved microscope system with adaptable configurations where each one is optimized for a particular aspect of the material response to laser energy deposition. We demonstrated the capabilities of this system by examining the specific case of laser-induced damage on the exit surface of fused silica flats, which represents one of the most challenging phenomena to model. Specifically, we have presented several time-resolved imaging results highlighting the key processes involved along the damage timeline and the suitability of various system configurations in addressing the challenging requirements outlined above. The basic system configuration of Fig. 1 provides simultaneous SV and TV shadowgraphic imaging of the same event and has been demonstrated before as separate systems (not as a combined system).5, 6, 7, 8 SV illumination permits the probing of a number of features, namely, the kinetics of material cluster ejection and shock front propagation. Material clusters appear as dark features because they are obscuring the probe beam illumination via absorption and/or scattering. The shock front on the air side is visible because of the modulation it creates in the refractive index in air. With this system, average speeds of the ejected particles and propagating shock fronts can be estimated from the delay time of the probe pulse and distance traveled, assuming that the process started on the arrival of the damage pulse (t = 0). TV images provide views of the lateral expansion of the modified material on the surface and subsequently the formation of the crater. As the absorption and scattering properties of the host material change in response to laser energy deposition, the modified material volume becomes less transmissive. Interestingly, it was found that most of this material will be ejected later in the process. Transmission loss dynamics can be measured when comparing an image in the transient state (during which the material is still undergoing modifications due to changing local temperatures and pressures) to that in the initial and/or final state (the latter represents the classical damage pit observed following a damage event). For example, the absorbing regions in Figs. 9(a) and 9(b) are observed to continue to grow laterally for ∼25 ns. Information obtained via simultaneous TV and SV imaging makes possible the correlation between changes in lateral dimensions with shock wave generation, material swelling, and particle ejection. For accurately capturing the dynamics involved at early delay times, it is critical to determine the location of the surface and employ the highest possible spatial resolution. Although shadowgraphic imaging can provide a wealth of information, the backscattering imaging configuration depicted in Fig. 4 provides better sensitivity in detecting early material motion near the surface. This configuration is inherently sensitive to detecting small isolated particles and permits usage of the detector's full dynamic range. Similar to the SV configuration, the backscattering configuration shows a jet of ejected material clusters. Although not able to detect the shock front in the backscattering mode, this mode has the advantage that it is sensitive to early material response behind the expanding shock front. Backscattering should also be able to detect concentrations of particles smaller than the resolution limit of the system (nanoparticles), which will appear as light scattering “clouds.” Although only the average dynamic properties of ejected particles are inferable based on single-probe shadowgraphic imaging, the dual-probe configuration directly measures the average speed of the ejected particles during the time interval between the arrival of probes 1 and 2. This method also provides evidence that particles may have accelerated (for example, when crossing the shock front) or decelerated along their trajectory from the surface. Because the projection of certain particles in the image plane (Fig. 7) changes when viewed on the probe 1 image versus the delayed probe 2 image, these ejecta must be nonspherical (flakelike, in some instances) in shape. In addition, comparison of the two images from this dual-probe setup yields information on rotational motion of the ejected particles. A very important and novel feature of this system is that it allowed us to estimate the ejection time of the particles observed in the images captured at different delay times. Preliminary results indicate that the particle ejection time can be as late as 20 μs after the arrival of the pump pulse. With the incorporation of a probe laser source producing shorter pulses ∼150 ps FWHM, the dynamics of material motion and disturbances can be better resolved. For example, events occurring early on during energy deposition (such as modification of the absorption properties of the exposed site) were probed at multiple time points in the TV mode. In addition, transient stress fields were recorded using the polarization-sensitive imaging configuration. In particular, the generation and propagation of shock fronts both in air (observed in the parallel polarization image component) and within the material (observed in the orthogonal polarization image component) were observable in the transient images. Furthermore, the SV mode allowed the visualization of bulk transient material modifications leading to crater formation. In the case example of laser-induced damage on the exit surface of fused silica, the preliminary findings regarding the timeline of events following laser energy deposition (7.5-ns FWHM, 355-nm laser pulses) can be summarized as follows. During the early part of the laser pulse, the host material locally becomes more optically absorptive. Then, these absorbing regions grow in size during laser energy deposition. Next, cracks are formed and continue to grow in size. The material reaches a critical energy density and the explosive process begins; during the later part of the pulse, the surface of the material begins to swell. After the end of the pulse, the absorbing region continues to expand as swelling continues, and a bulge can be observed forming on the surface. After this bulge reaches its maximum size, small material clusters separate from the bulge; initially small particles at speeds up to ∼3 km/s are ejected and form a jet, joined later by larger, slower particles. Irregularly shaped particles (resembling flakes and chips) traveling at speeds on the order of ∼10 m/s are ejected at delays on the order of several microseconds, indicating that the ejection process is long lived. AcknowledgmentsThis work was performed under the auspices of the U.S. Department of Energy by Lawrence Livermore National Laboratory under Contract No. DE-AC52-07NA27344. ReferencesLaser Ablation and Its Applications, Springer, Boston
(2007). Google Scholar
R. F. Haglund and D. R. Ermer,
“Explosive vaporization in fused silica initiated by a tunable infrared laser,”
Appl. Surf. Sci., 168 258
–262
(2000). Google Scholar
V. Craciun, N. Bassim, R. K. Singh, D. Craciun, J. Hermann, and C. Boulmer-Leborgne,
“Laser-induced explosive boiling during nanosecond laser ablation of silicon,”
Appl. Surf. Sci., 186 288
–292
(2002). Google Scholar
J. Wong, J. L. Ferriera, E. F. Lindsey, D. L. Haupt, I. D. Hutcheon, and J. H. Kinney,
“Morphology and microstructure in fused silica induced by high fluence ultraviolet 3ω (355 nm) laser pulses,”
J. Non-Cryst. Solids, 352 255
–272
(2006). Google Scholar
A. Gupta, B. Braren, K. G. Casey, B. W. Hussey, and R. Kelly,
“Direct imaging of the fragments produced during excimer laser ablation of YBa2Cu3O7-δ,”
Appl. Phys. Lett., 59 1302
–1304
(1991). Google Scholar
J. H. Yoo, S. H. Jeong, X. L. Mao, R. Greif, and R. E. Russo,
“Evidence for phase-explosion and generation of large particles during high power nanosecond laser ablation of silicon,”
Appl. Phys. Lett., 76 783
–785
(2000). Google Scholar
F. Y. Salleo Genin, M. D. Feit, A. M. Rubenchik, T. Sands, S. S. Mao, and R. E. Russo,
“Energy deposition at front and rear surfaces during picosecond laser interaction with fused silica,”
Appl. Phys. Lett., 78 2840
–2842
(2001). Google Scholar
X. Zeng, X. Mao, S. Wen, R. Greif, and R. E. Russo,
“Energy deposition and shock wave propagation during pulsed laser ablation in fused silica cavities,”
J. Phys. D, 37 1132
–1136
(2004). Google Scholar
K. Sokolowski-Tinten, J. Bialkowski, A. Cavalleri, D. von der Linde, A. Oparin, J. Meyer-ter-Vehn, S. I. Anisimov,
“Transient states of matter during short pulse laser ablation,”
Phys. Rev. Lett., 81 224
–227
(1998). Google Scholar
H. Ihee, V. A. Lobastov, U. M. Gomez, B. M. Goodson, R. Srinivasan, C. Ruan, and A. H. Zewail,
“Direct imaging of transient molecular structures with ultrafast diffraction,”
Science, 291 458
–462
(2001). Google Scholar
A. Rousse, C. Rischel, S. Fourmaux, I. Uschmann, S. Sebban, G. Grillon, Ph. Balcou, E. Forster, J. P. Geindre, P. Audebert, J. C. Gauthier, and D. Hulin,
“Non-thermal melting in semiconductors measured at femtosecond resolution,”
Nature, 410 65
–68
(2001). Google Scholar
A. M. Lindenberg
J. Larsson, K. Sokolowski-Tinten, K. J. Gaffney, C. Blome, O. Synnergren, J. Sheppard, C. Caleman, A. G. MacPhee, D. Weinstein, D. P. Lowney, T. K. Allison, T. Matthews, R. W. Falcone, A. L. Cavalieri, D. M. Fritz, S. H. Lee, P. H. Bucksbaum, D. A. Reis, J. Rudati, P. H. Fuoss, C. C. Kao, D. P. Siddons, R. Pahl, J. Als-Nielsen, S. Duesterer, R. Ischebeck, H. Schlarb, H. Schulte-Schrepping, Th. Tschentscher, J. Schneider, D. von der Linde, O. Hignette, F. Sette, H. N. Chapman, R. W. Lee, T. N. Hansen, S. Techert, J. S. Wark, M. Bergh, G. Huldt, D. van der Spoel, N. Timneanu, J. Hajdu, R. A. Akre, E. Bong, P. Krejcik, J. Arthur, S. Brennan, K. Luening, J. B. Hastings,
“Atomic-scale visualization of inertial dynamics,”
Science, 308 392
–395
(2005). Google Scholar
H. Jiang, J. McNary, H. W. K. Tom, M. Yan, H. B. Radousky, and S. G. Demos,
“Nanosecond time-resolved multiprobe imaging of laser damage in transparent solids,”
Appl. Phys. Lett., 81 3149
–3151
(2002). Google Scholar
M. M. Martynyuk,
“Vaporization and boiling of liquid metal in an exploding wire,”
Sov. Phys.-Tech. Phys., 19 793
–797
(1974). Google Scholar
A. Miotello and R. Kelly,
“Laser-induced phase explosion: new physical problems when a condensed phase approaches the thermodynamic critical temperature,”
Appl. Phys. A., 69 S67
–S73
(1999). Google Scholar
D. Perez, L. J. Lewis, P. Lorazo, and M. Meunier,
“Ablation of molecular solids under nanosecond laser pulses: the role of inertial confinement,”
Appl. Phys. Lett., 89 141907
(2006). Google Scholar
R. A. Negres, M. D. Feit, and S. G. Demos,
“Dynamics of material modifications following laser-breakdown in bulk fused silica,”
Opt. Express, 18 10642
–10649
(2010). Google Scholar
T. I. Suratwala, P. E. Miller, J. D. Bude, W. A. Steele, N. Shen, M. V. Monticelli, M. D. Feit, T. A. Laurence, M. A. Norton, C. W. Carr, and L. L. Wong,
“HF-based etching processes for improving laser damage resistance of fused silica optical surfaces,”
Google Scholar
|