|
|
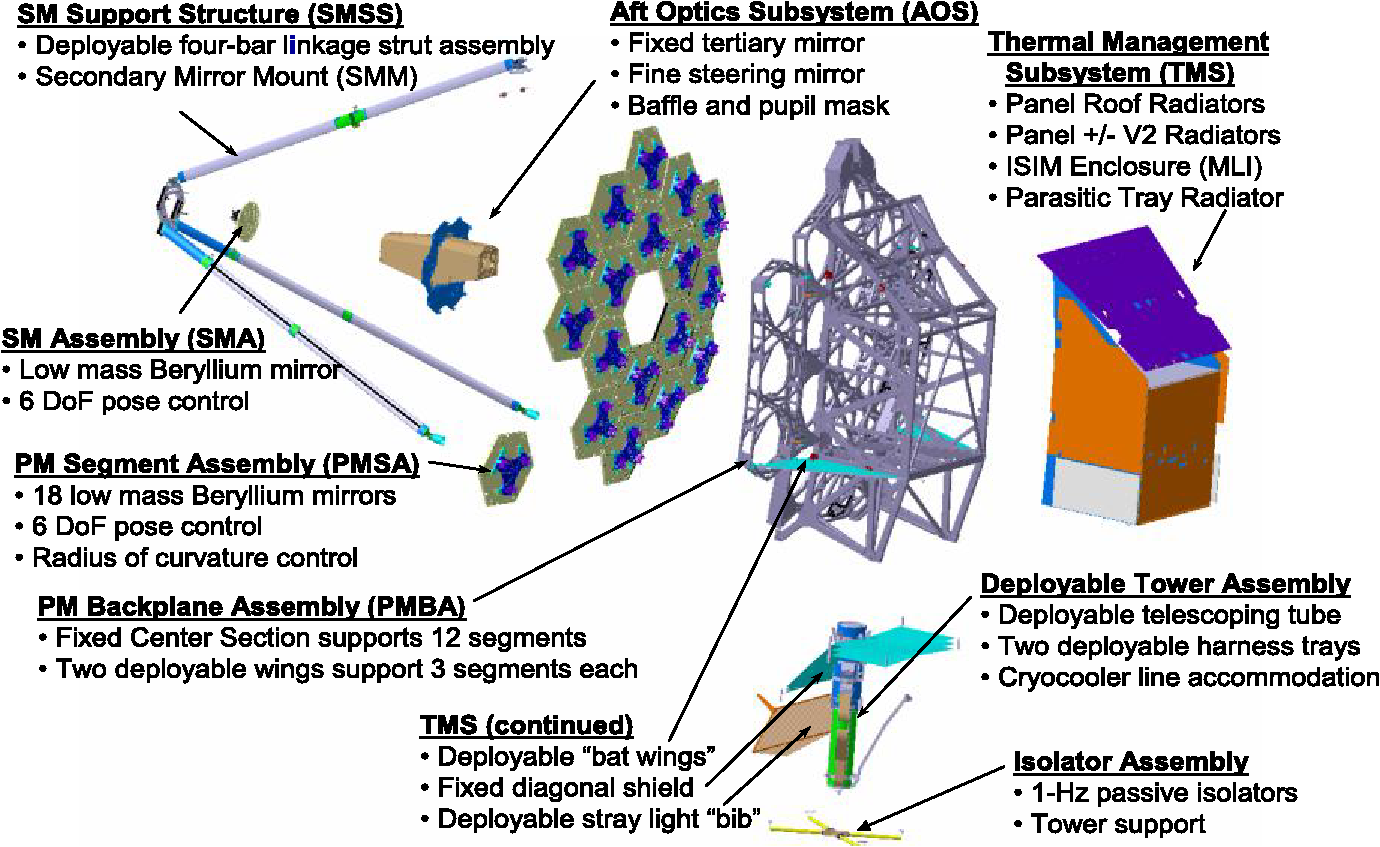
1.IntroductionThe James Webb Space Telescope (JWST) is a large, space-based astronomical observatory that will study the epoch when the first stars and galaxies formed and reionized the universe. JWST brings a large collecting area combined with infrared (IR) optimization to address this observational challenge. JWST will also address a broad range of astronomical science centered on four major themes: first light and reionization, assembly of galaxies, birth of stars and protoplanetary systems, and planetary systems and origins of life. 1.1.First Light and Reionization (The End of the Dark Ages)One of the primary motivations for JWST is to identify the first luminous sources to form, and determine the ionization history of the universe (see Fig. 1). The emergence of the first sources of light in the universe marks the end of the “Dark Ages” in cosmic history, a period characterized by the absence of discrete sources of light. Understanding these first sources is critical, since they significantly influenced subsequent structures. The current leading models for structure formation predict a hierarchical assembly of galaxies and clusters. The first sources of light acted as seeds for the successive formation of larger objects, and by studying these objects we will learn the processes that formed the nuclei of present day giant galaxies. The first galaxies formed with about a million solar masses of stars radiating strongly in the rest-frame ultraviolet (UV) and visible, which is red shifted into the near IR (NIR). In order to detect these faint sources, JWST requires a large collecting area, excellent image quality at 2 μm, the low backgrounds that come from observing above the atmosphere, and the cryogenic operating temperature of the observatory. By taking very long exposures in the NIR, JWST will be able to see the first stars exploding as supernovae, and the first galaxies as they form. This will require exposures each, in several broadband filters using the near IR camera (NIRCam) instrument. This approach has been especially successful in deep-field observations such as the Hubble deep field,1 the Hubble ultra-deep field,2 and, most recently, the Wide Field Camera 3 (WFC3) deep field,3 as shown in Fig. 2. The tunable filter imager will employ narrow-band imaging surveys to search for emission from these galaxies. Follow-up spectroscopy and images in the mid-IR (MIR) will also teach us more about the objects that are seen in the NIRCam images. Fig. 1The history of the evolution of the expanding universe since the Big Bang is shown. The James Webb Space Telescope will explore back into the first light regions at the edge of the cosmic dark ages. 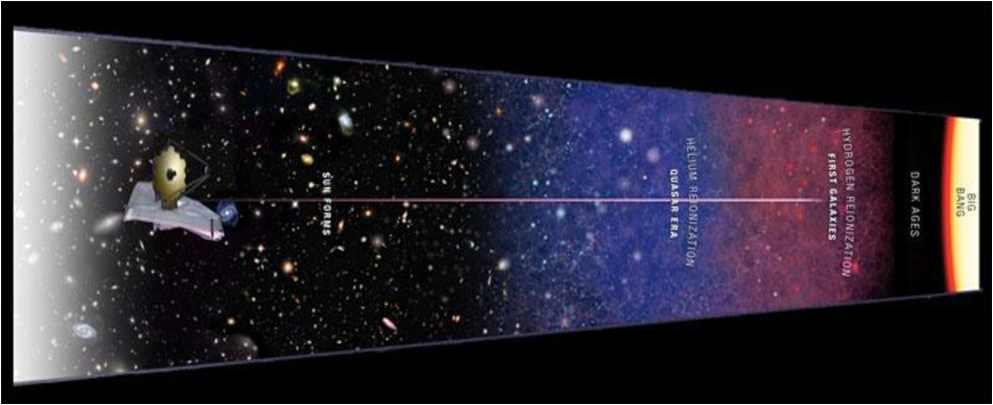 Fig. 2The WFC3 deep field obtained with the recently installed WFC3/IR camera on the Hubble Space Telescope. Credit: NASA, ESA, G. Illingworth (UCO/Lick Observatory and the University of California, Santa Cruz), R. Bouwens (UCO/Lick Observatory and Leiden University), and the HUDF09 Team. 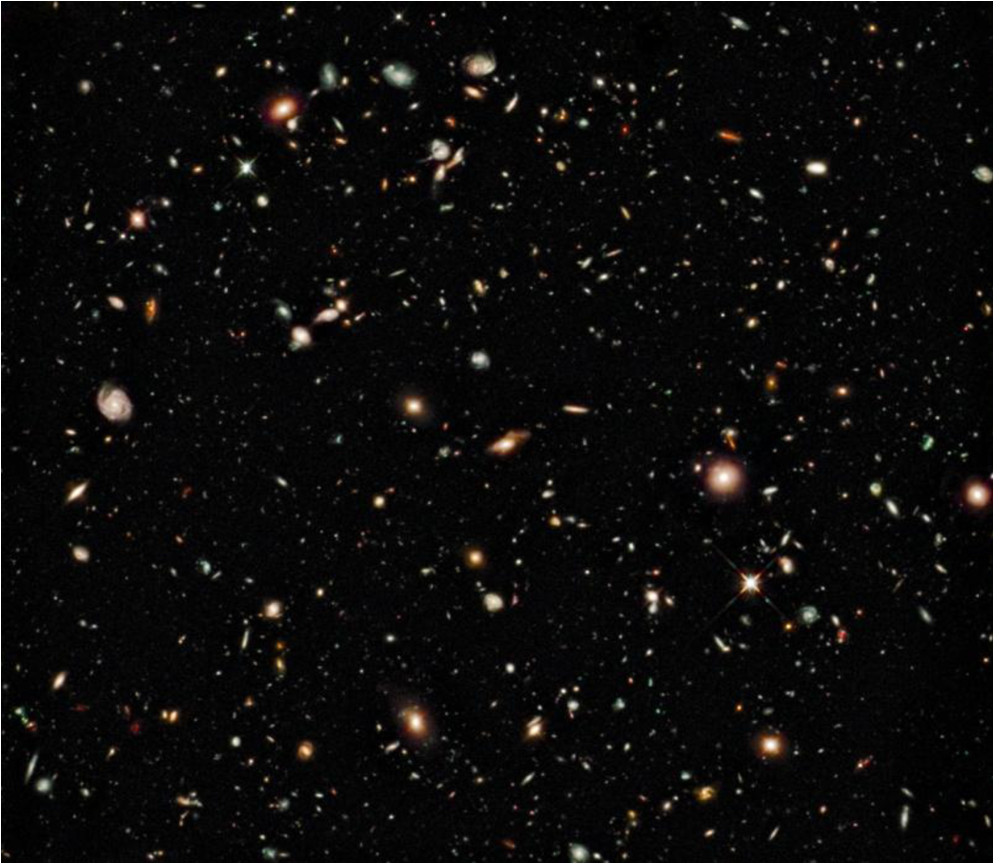 Following their formation, the first galaxies began to grow by accreting gas and through mergers. These galaxies were bright in UV light, and began to dissociate the protons and electrons of the hydrogen atoms in a process called reionization. Reionization represents the last global phase transition the universe underwent after the Big Bang. Each galaxy began by creating a bubble of ionized gas around it. As reionization progressed, the bubbles got bigger and began to join together, finally filling all of the space between the galaxies. The time lag between first light and reionization is uncertain. JWST will take spectra of still more distant quasars to establish whether reionization is brought about by the first-light objects, or subsequent generations, and follow the process of reionization through its conclusion. Recent observations of the most distant quasars, combined with cosmic microwave background observations made by the Wilkinson Microwave Anisotropy Probe (WMAP) satellite tell us that reionization ended about 1 billion years after the Big Bang. JWST will also discern the role of active galactic nuclei such as quasars or other supermassive black holes on the process of reionization. 1.2.The Assembly of GalaxiesJWST will address key questions in determining how galaxies and the dark matter, gas, stars, metals, morphological structures, and active nuclei within them evolved from the epoch of reionization to the present. Galaxies are the basic building blocks of the universe. Theory and observation show that galaxies assemble through a process of the hierarchical merging of dark matter concentrations. Small objects formed first, and were drawn together to form larger ones. This dynamic buildup of massive systems is accompanied by chemical evolution, as the gas and dust within the galaxies are processed through successive generations of stars. The interaction of these luminous components with the invisible dark matter produces the beautiful appearance and diverse properties of present-day galaxies. This process is still occurring today, as the Magellanic Clouds fall into the Milky Way, and as the Andromeda Nebula heads toward the Milky Way for a future collision. JWST will survey a large sample of galaxies to determine their morphologies, the stellar populations within them, and the rate of star formation. All of these will be measured statistically as a function of the galaxy’s mass, environment, and cosmic epoch. JWST will also determine when the long-lived older stars in a typical galaxy were formed, whether in situ or in smaller galaxies that subsequently merged together to form a large galaxy. JWST will investigate the processes that determine galaxy properties using a combination of imaging and spectroscopy. JWST’s MIR capability will be especially important for diagnosing the energy sources in the interiors of bright galaxies, both those which are rapidly forming stars and in quasars or other active galaxies where the central black hole is accreting material and shining brightly. 1.3.The Birth of Stars and Protoplanetary SystemsThe key objective of the birth of stars and protoplanetary systems theme is to unravel the birth and early evolution of stars, from in-fall onto dust-enshrouded protostars, to the genesis of planetary systems. While stars have been the main topic of astronomy for hundreds of years, only in recent times have we begun to understand them with detailed observations and computer simulations. We still do not know the details of how they are formed from clouds of gas and dust, why most stars form in groups, or how planetary systems form. Young stars within a star-forming region interact with each other chemically, dynamically, and radiatively in complex ways. The details of how they evolve and liberate the “metals” back into space for recycling into new generations of stars and planets remains to be determined through a combination of observation and theory. Observation shows that most stars are formed in multiple star systems and that many stars have planets. However, there is little agreement about how this occurs, and the discovery of large numbers of massive planets in very close orbits around their stars was very surprising. JWST will study the specific problems of how protostellar clouds collapse, how environment affects star formation, the initial mass function at substellar masses, how protoplanetary systems form, and the life cycles of gas and dust. 1.4.Formation of Planetary Systems and the Origin of LifeThe key objective of the planetary systems and the origins of life theme is to determine the physical and chemical properties of planetary systems including our own, and investigate the potential for the origins of life in those systems. Understanding the origin of the Earth and its ability to support life is an important objective for astronomy, and links the first light theme to our own origins. In our own solar system, JWST will study the chemical and physical history of the objects that formed the Earth, and delivered the necessary chemical precursors for life. In other exoplanetary systems, JWST will study how these systems form and evolve by conducting imaging surveys of exoplanets, and the environments in which they reside (see Fig. 3). JWST is particularly suited to imaging studies of young, self-luminous planets, and planets around late-type stars.5 In the field of transiting exoplanets, JWST will be especially capable,6 and will permit high-precision studies of exoplanetary atmospheres from gas giants to superearths. Fig. 3JWST simulated image of the dusty debris disk around Fomalhaut (right; courtesy G. Rieke), compared to the 24-μm image as seen by the Spitzer Space Telescope4 and in visible scattered light by HST.7 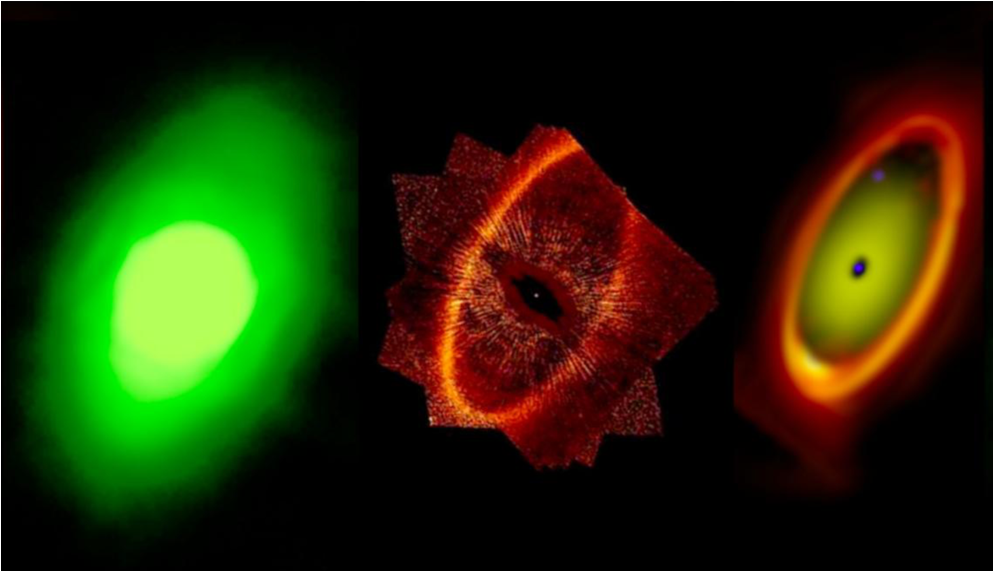 The JWST will be a general observer facility, like Hubble before it, and will address an enormous variety of astronomical community interests. Observing proposals, submitted yearly, will be peer reviewed and those deemed scientifically interesting and of high importance will receive observing time. The broad topics discussed above have been used to help refine science and engineering parameters necessary to define the observatory’s capabilities. 2.The ArchitectureThe basic architecture has been described previously.8,9 In order to meet the science goals, JWST is designed to operate in the IR from 0.6- to 27-μm wavelengths with a goal of extending the long-wave range to 29 μm. To achieve the radiometric sensitivity to observe the faint sources in the science objectives, the telescope will have a collecting area and telescope transmission for wavelengths . Besides having efficient collection, the observatory is designed to have low backgrounds to enable observations of the desired faint sources. The goal is to have NIR background limited by the natural background from the zodiacal dust. In the MIR, the background is limited by the technology limits for the detectors and self-emission stray light from the observatory. To achieve these low backgrounds, the telescope and instruments are kept at cryogenic temperatures. This is accomplished by placing JWST in a Lissajous orbit about the Earth–Sun L2 Lagrange libration point (see Fig. 4). This orbit allows the observatory to be designed with a large sunshield that protects the telescope and instruments from ever being exposed to direct sunlight. The cryogenic temperatures for the telescope and instruments suite are achieved by passively radiating to space. The MIR instrument is cooled further with an active cryogenic cooler to achieve performance at the longer wavelengths. Fig. 4The launch trajectory and time line for The James Webb Space Telescope reaching the Earth-Sun L2 Lagrange libration point. The L2 point is a saddle point in the three body system (potential energy contour plot shown in inset). The size of the L2 orbit and location relative to the Earth and Moon is shown schematically on the right. 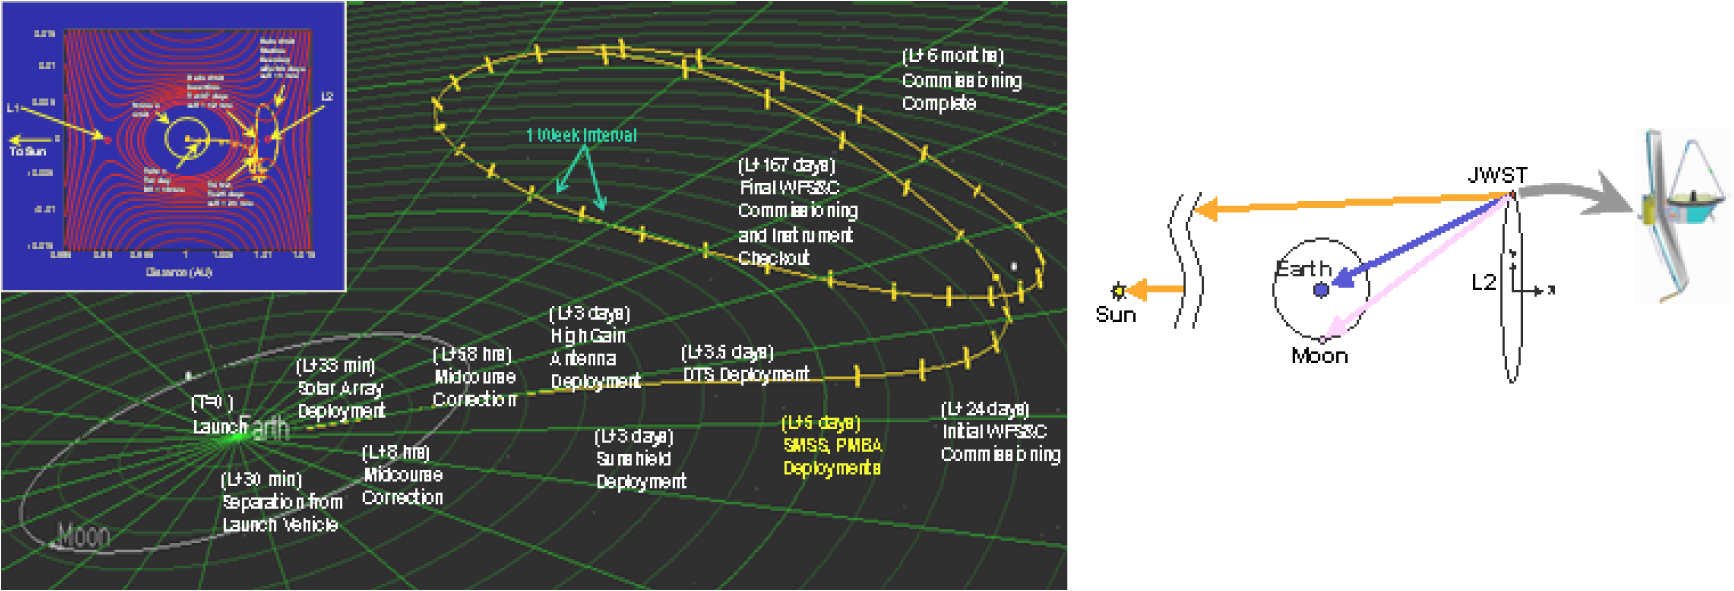 The JWST Observatory is shown in Fig. 5. The primary mirror (PM) and secondary mirror (SM) are exposed to the celestial sky, but protected from sun illumination by the large sunshield. The telescope aft optics consisting of the tertiary mirror (TM) and fine steering mirror (FSM) are enclosed, limiting direct exposure to the celestial sky. The suite of science instruments consisting of the near-IR camera (NIRCam), near-IR spectrometer (NIRSpec), mid-IR instrument (MIRI), tunable filter instrument (TFI), and the fine guidance sensor (FGS) are mounted within the integrated science instrument module (ISIM) structure, which is attached to the backside of the telescope and is also enclosed. The attitude control of the complete JWST Observatory is used to point the telescope at the desired target. The size and orientation of the sunshield allows a field of regard represented by the two light shades of gray (blue) shown on the left in Fig. 6. The dark gray area (green) is an exclusion zone around the anti-Sun direction. The field of regard moves around the celestial sphere as the Earth-L2 anti-Sun direction moves during the year, allowing observational access to the full celestial sphere over the year. Regions near the ecliptic poles are available for observation at all times of the year, with the number of available days decreasing as the ecliptic latitude of targets decreases. Figure 6 also shows a representative plot of number of days of availability. These will vary slightly, depending on final design and orbit parameters. Fig. 5The James Webb Space Telescope architecture has the primary mirror and secondary mirror of the telescope exposed to the celestial sky with a sunshield that shadows and thermally isolates the telescope from the sun. 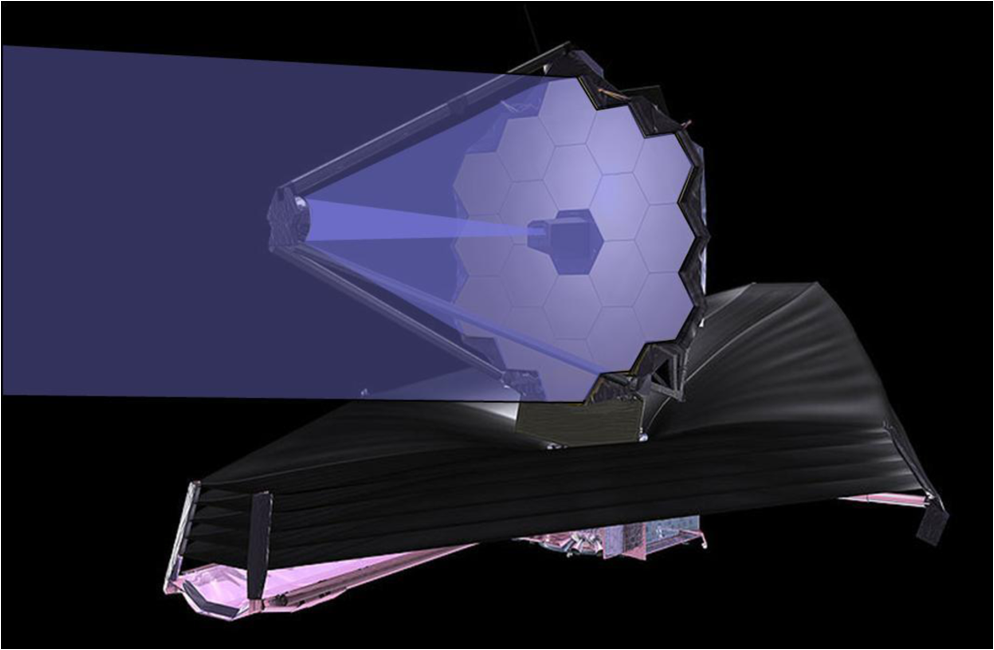 Fig. 6The field of regard for The James Webb Space Telescope nominally contained within the hemisphere centered on the anti-Sun direction is shown on the left. It slightly exceeds the hemisphere by pointing angles 95 deg from the anti-Sun line, and has an exclusion zone for angles within 45 deg of the anti-Sun line. This field of regard rotates with the Earth–Sun direction during the year such that the full celestial sky is available. The plot on the right is a representative contour plot of the number of days of availability for targets in ecliptic coordinates. 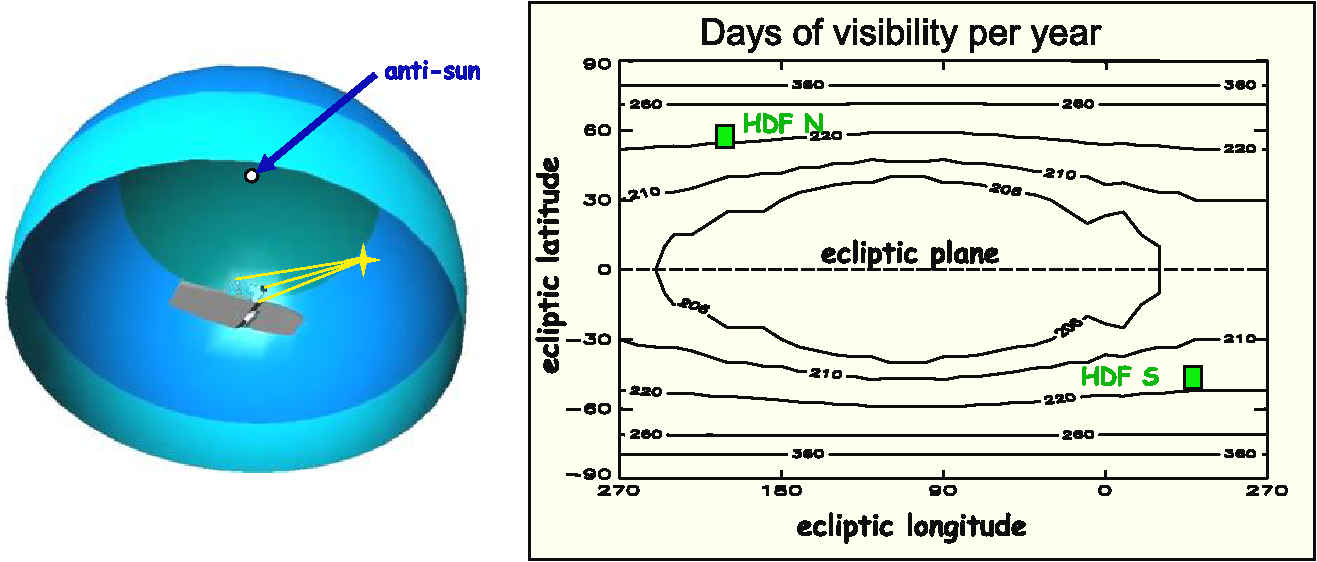 To get into an L2 orbit with a aperture telescope that is protected by a tennis court-sized sunshield, the observatory must be folded up into the launch fairing like a cocoon, and deployed after launch. In particular, the size of the PM and the placement of the SM are too large to launch in a fixed configuration; hence the SM on its support structure and the PM are deployed from their launch-restrained positions. Figure 7 shows the observatory in the deployed configuration, and in the stowed configuration in the launch fairing on the launch vehicle. Several other subsystems deploy during transit to the L2 orbit, including the solar arrays, the high-gain antenna, the sunshield, and the tower that extends the telescope and instruments away from the spacecraft and sunshield. Fig. 7The deployed The James Webb Space Telescope is on the left, the stowed configuration within the fairing is in the middle, and the fairing on the launch vehicle is on the right. 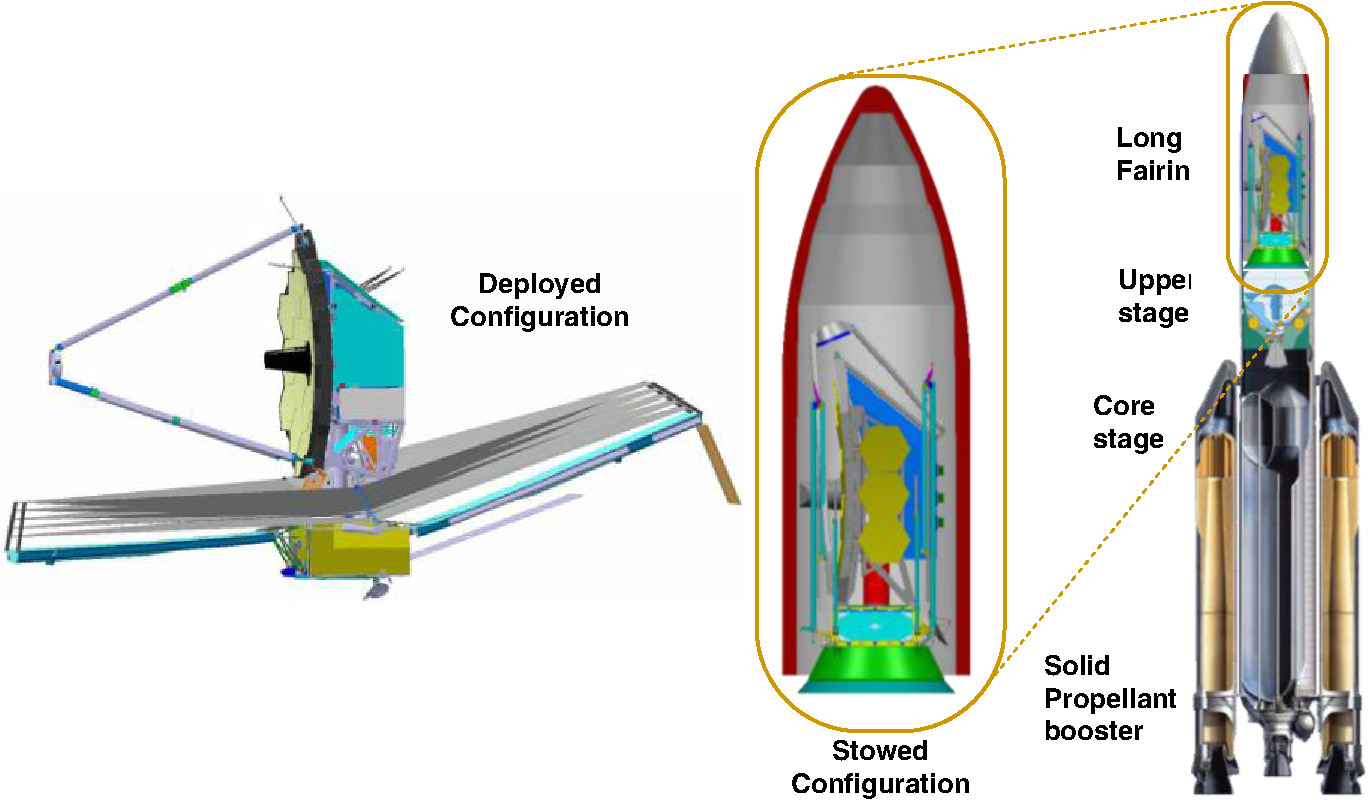 The telescope is a three-mirror design utilized to achieve a sufficiently large and well-corrected field of view for the large PM. There is a fourth actively controlled FSM to fold the optical path and stabilize the image. The optical schematic and mirror parameters are shown in Fig. 8. Fig. 8The optical schematic of the telescope showing the physical boundary between the optical telescope element optics (OTE) and the science instrument optics located in the integrated science instrument module. The optical parameters for the OTE mirrors are shown in the table. 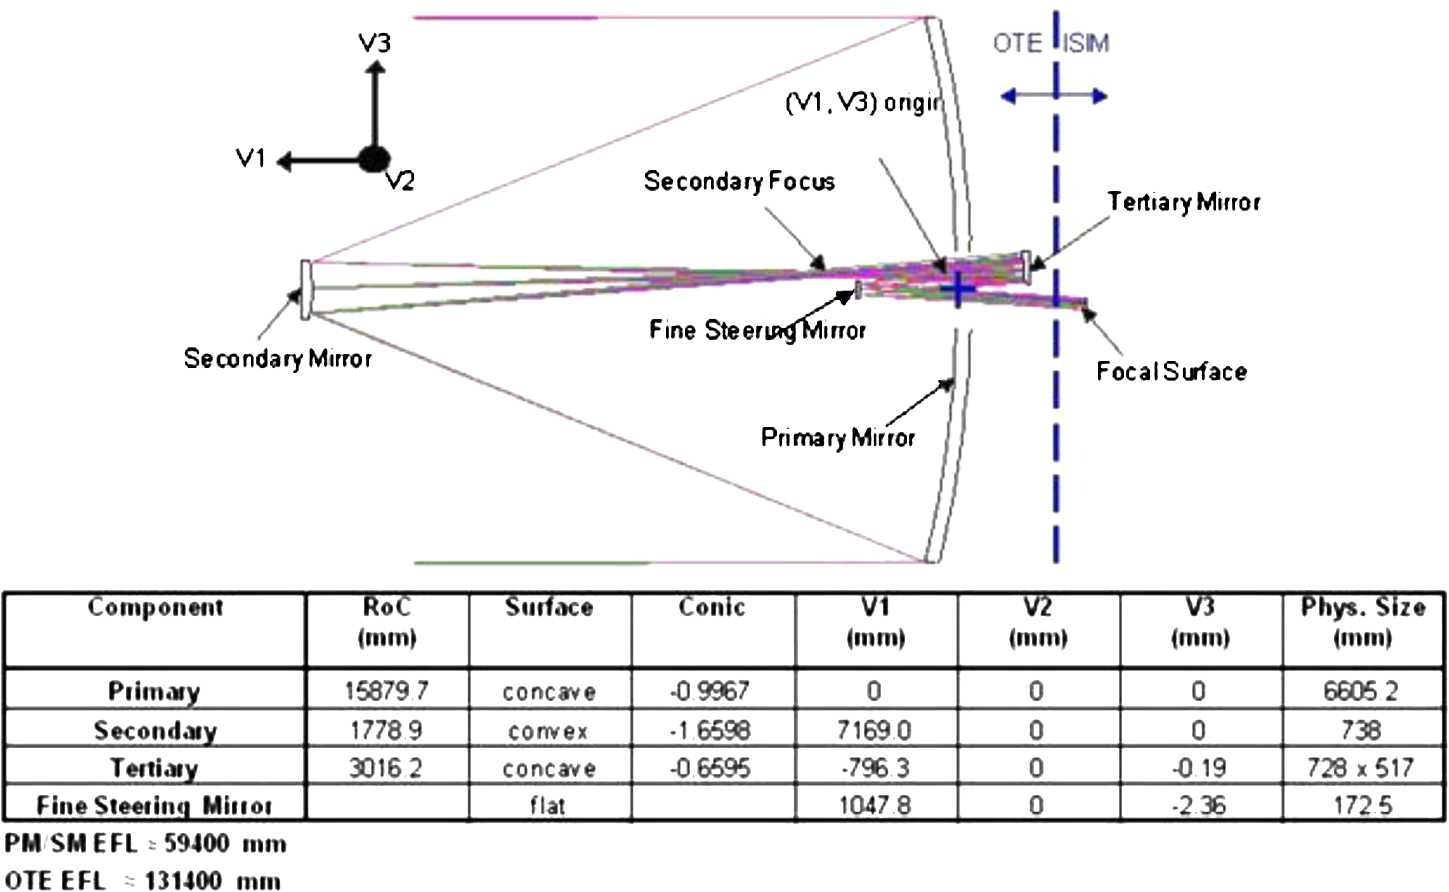 The PM consists of 18 low-mass, hexagonal beryllium segments. Each segment subassembly provides 6 degrees of freedom, rigid body pose adjustability, plus radius of curvature adjustability. The PM segment assemblies (PMSAs) are mounted on a backplane assembly (PMBA). The PMBA has deployable wings, each holding 3 of the 18 PMSAs. The secondary mirror assembly (SMA) is also a low-mass beryllium design with active pose adjustability. The SMA is mounted on a deployable secondary mirror support structure (SMSS). The aft optics subsystem (AOS) has a fixed TM and the FSM. The FSM is actively controlled in two axes of tilt and used in combination with the fine guidance sensor in the ISIM to stabilize the image. The telescope is attached to the spacecraft by a deployable tower assembly (DTA). The DTA extends the telescope away from the sunshield and spacecraft to reduce the thermal coupling into the telescope. The DTA is mounted on an isolator assembly, which reduces the mechanical coupling of disturbances from the spacecraft. An exploded view of the assemblies for the telescope is shown in Fig. 9. The deployment sequence for the telescope follows:
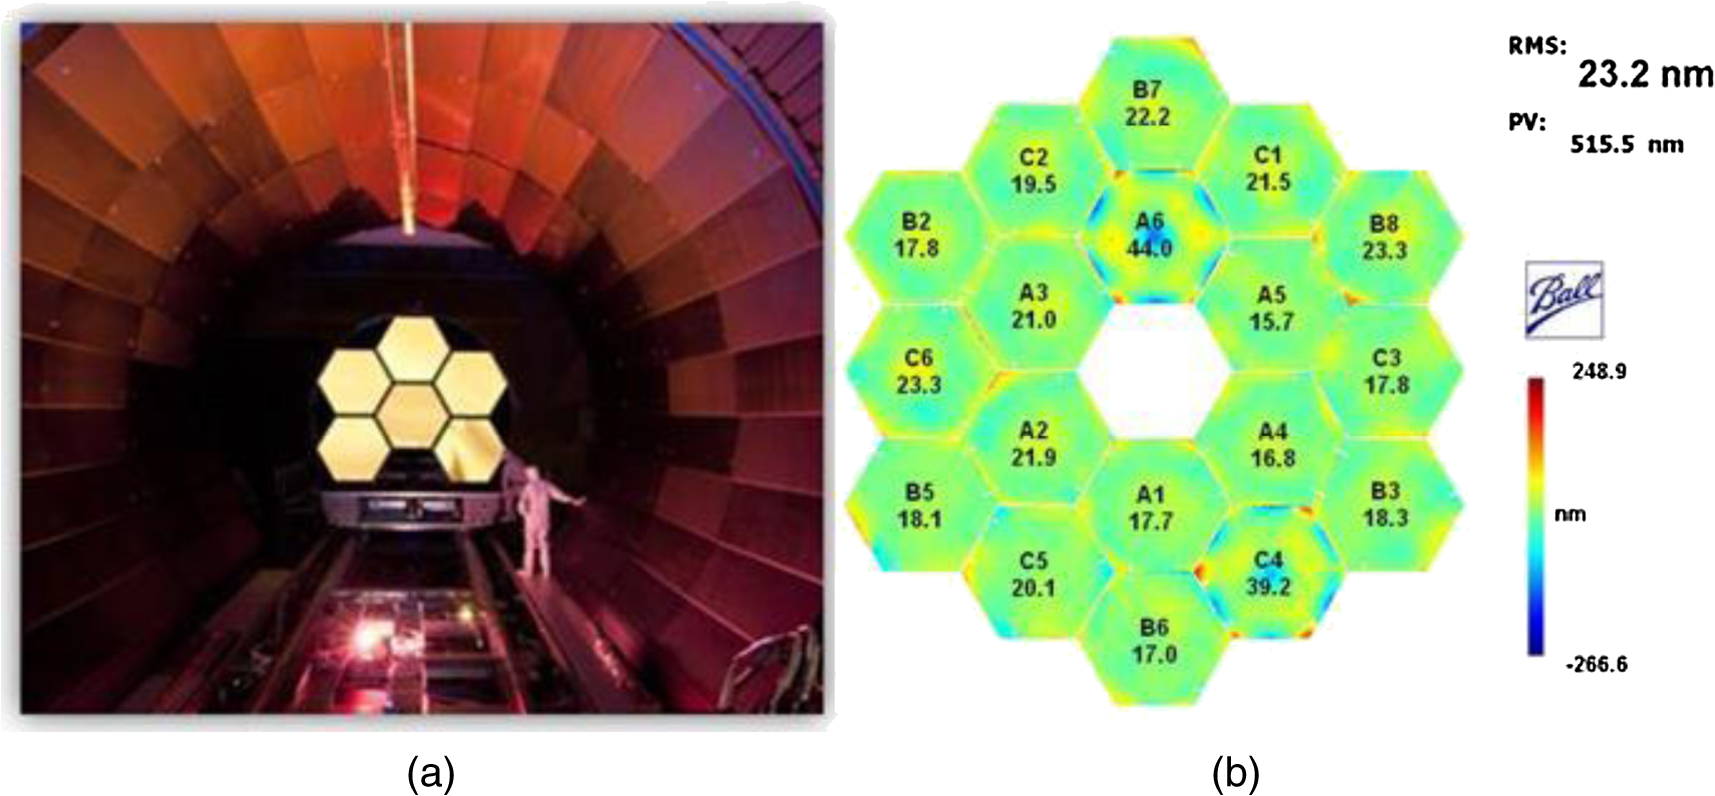
The WFSC process adjusts the poses of the individual PMSAs to form a phased PM, aligns the SM to the PM, and collectively aligns the PM/SM combination with the fixed aft optics. The aft telescope optics and science instrument optical systems are aligned and fixed preflight with capability to adjust the focus of the individual science instrument optics during flight to compensate for small fixed alignment errors to achieve optimum focal alignment between the telescope and the instruments. The MIRI is the one exception; it can tolerate the fixed alignment errors without active adjustment since it is operating at longer wavelengths. Figure 10 shows the stowed and final deployed configurations with the lower panel displaying the sequence for the deployment of the SM and PM wings. Fig. 10The stowed and deployed configurations of the telescope are shown with the small figures along the bottom displaying the sequence of deployments. After the deployable tower is extended, the secondary mirror (SM) support system deploys. The stray light shield (bib) deploys as part of this process. After the SM deployment, the primary mirror wings are deployed. 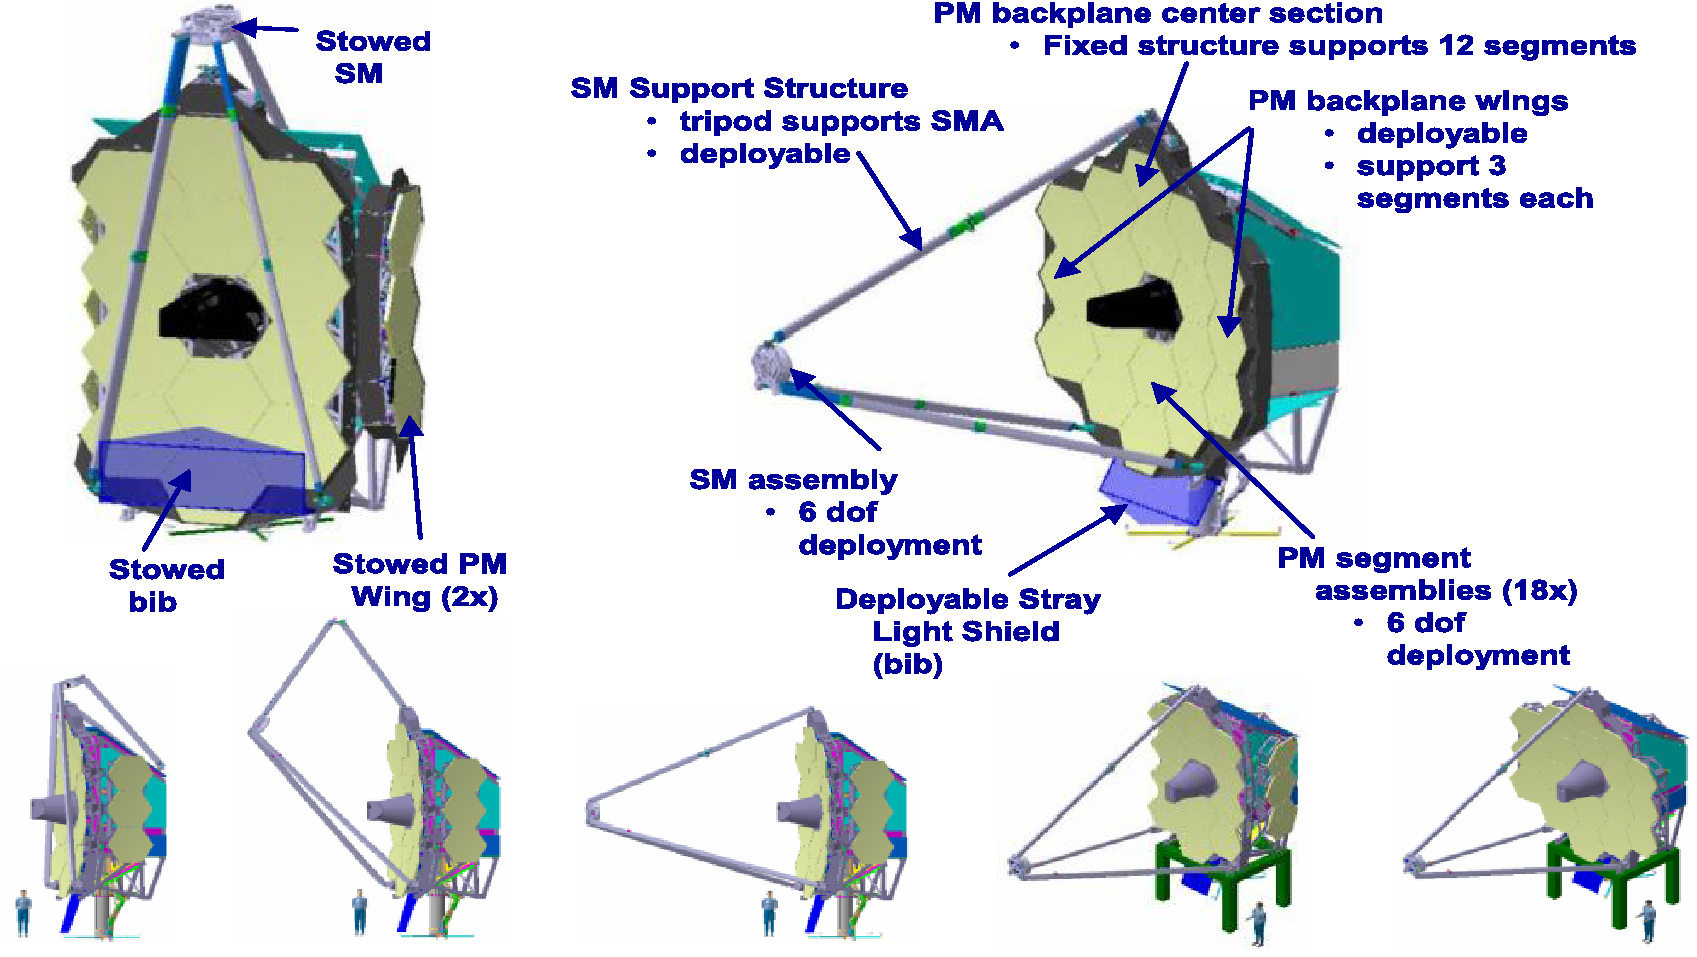 3.Semi-Rigid Primary Mirror Architecture3.1.Low Areal Density, Cryogenic Mirror TechnologyThe low areal density technology for PM is based on a semirigid architecture that has been previously demonstrated and presented in the Refs. 10–14. The PM is broken into a tiling pattern of hexagonal segments. The segments’ size, material, and light-weighting technique are such that the mirrors may be manufactured and tested to provide the desired surface shape at the flight cryogenic environment in a repeatable fashion before flight. However, curvature and surface astigmatism errors in individual segments are difficult to control to the final required performance levels due to the degeneracy between metrology of mirror placement during measurement and mirror radius of curvature (axial spacing) and surface astigmatism (off-axis spacing and/or clocking). In flight, the astigmatism may be compensated with rigid body decentration and/or clocking of the segments. However, to phase the segments, the curvature of individual segments cannot be compensated by a piston (despace) motion, but requires adjustment of the surface curvature. Hence a semi-rigid architecture is employed that utilizes a strong back structure consisting of six rods attached by flexures at the vertices of the segments which come together at a location below the center of the segment. An actuator is attached between the confluence of the rods and the segment center such that the center of the mirror may be pushed or pulled in reaction to the vertices to make small changes in the mirror radius of curvature. This allows the curvature of all 18 segments to be matched to achieve the desired performance. The mirror blanks were produced by Brush Wellman out of O30 beryllium using a hot isostatic press process. The beryllium blanks were precision machined into low mass substrate by Axsys Technologies, removing over 92% of the mass from the original blank. The substrates were polished to their initial shape by Tinsley (L3 Communications, SSG-Tinsley). The substrates were integrated to the supporting flexure and radius of the curvature system and then onto the rigid-body hexapod control system. The assembled mirrors were measured at ambient temperatures and at cryogenic temperatures to determine the combined assembly and cryodeformation surface-difference maps (a.k.a. hit maps). The mirrors were returned to Tinsley where the mirror surfaces were polished to the compensating hit map so that the mirrors would achieve final performance at operating conditions. After final polishing, the final mirrors had a reflective gold coating with a protective overcoat applied by QCI. The optical acceptance testing of the final PMSAs were performed at cryogenic operating temperatures in the XRCF facility at Marshall Space Flight Center. The flight acceptance testing of the PMSAs has been completed. Figure 11 shows six mirrors ready for testing in XRCF on the left, and the measured surface error results for the PMSAs on the right, meeting the rms-area-average required figure error. 3.2.Segmented Control TechnologyThe JWST mirrors are actively controlled using a hexapod actuation configuration as shown in Fig. 12. The actuators in each leg of the hexapod have a minimum step size and a range based on earlier actuator development.15 The robustness of the semi-rigid architecture to actuation failures has also been studied. Following the WFSC commissioning, the system is very robust. The WFSC is described in Sec. 4. Three of the six degrees of freedom of the PMSAs have only weak influence on the wavefront; hence up to three actuators would have to fail before a given segment would show significant influence on the wavefront error (WFE). In addition, the low degradation of the WFE over one segment is diluted with the WFE from the other 17 segments in terms in its effect on Strehl ratio or encircled energy (EE). The radius-of-curvature (RoC) actuators are set before launch, and flight adjustments are anticipated to be small. Loss of control of a RoC actuator on a segment will result in a very small impact to the total WFE. Since the SM is only controlled in 5 DOF, loss of one of the six actuators for the SM would not impact control of the SM. A more significant risk is the failure of an actuator to deploy a segment. The effect of this failure may be mitigated by use of the remaining actuators to adjust the segment so that the total performance is gracefully degraded. Specifically, the option with least impact is to use the remaining five actuators to adjust the tilt of the segment such that its forms a single segment telescope image that is aligned to the phased image of the other 17 segments. The RoC actuator is used to adjust the focus to compensate for the large piston mismatch of the segment relative to the others. The core radius of the point spread function (PSF) is still narrow, but with a reduced peak (Strehl ratio), and it has a low-level pedestal structure several orders of magnitude less than the peak intensity. The resulting performance at a wavelength of 2 μm is approximately a 10% reduction in the Strehl ratio and EE within an 80-mas field radius. Figure 13 shows an example that was analyzed with a segment in the interior ring failing to deploy. Fig. 12The backside of a primary mirror segment assembly showing the radius of curvature actuation structures and the rigid body hexapod system. 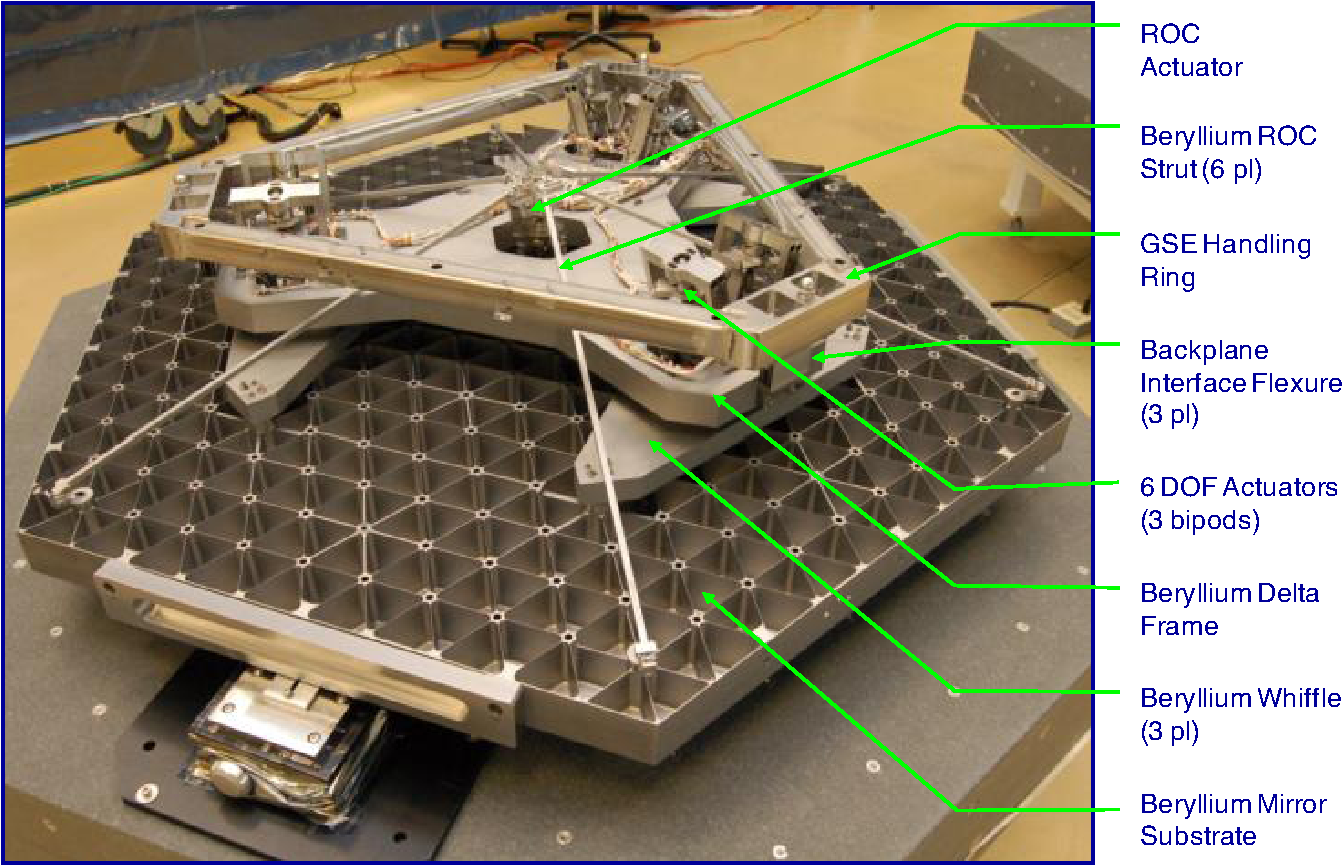 Fig. 13The nominal wavefront error (WFE) and point spread function (PSF) performance for all 18 segments are shown on the left. The WFE and PSF with one segment undeployed are shown on the right. The top center plot shows a slice through the PSF for both the nominal and undeployed case. The bottom center shows the encircled energy for both as a function of encircling radius.  3.3.Composite Structure TechnologyThe structures to which the optical components are attached are predominantly comprised of very lightweight composite material. The high stiffness-to-weight ratio and very low thermal distortion of the composite made it an excellent choice for the telescope structure. Composite structures are frequently used for space telescopes for this very reason; however, the JWST marks the first time a composite structure is being used to support individual segments in an array comprising the PM, thereby directly contributing to the optical performance of the telescope. In 2006, the backplane stability test article (BSTA) was built using the same construction materials and processes as the flight and was measured to demonstrate the very small thermal distortions necessary for JWST.16 Figure 14 shows the BSTA and flight structures along with the design of the flight PMBA. The tube-frame construction of the PMBA is ideally suited for the telescope structure. It enables the structure to take on the parabolic shape of the PM while enabling loads to be taken primarily in axial members. It also enables tailoring the coefficient of thermal expansion (CTE) of the various members to achieve the requisite thermal stability. Fig. 14The backplane stability test article technology development structure is a one-sixth replica of the flight center section structure. 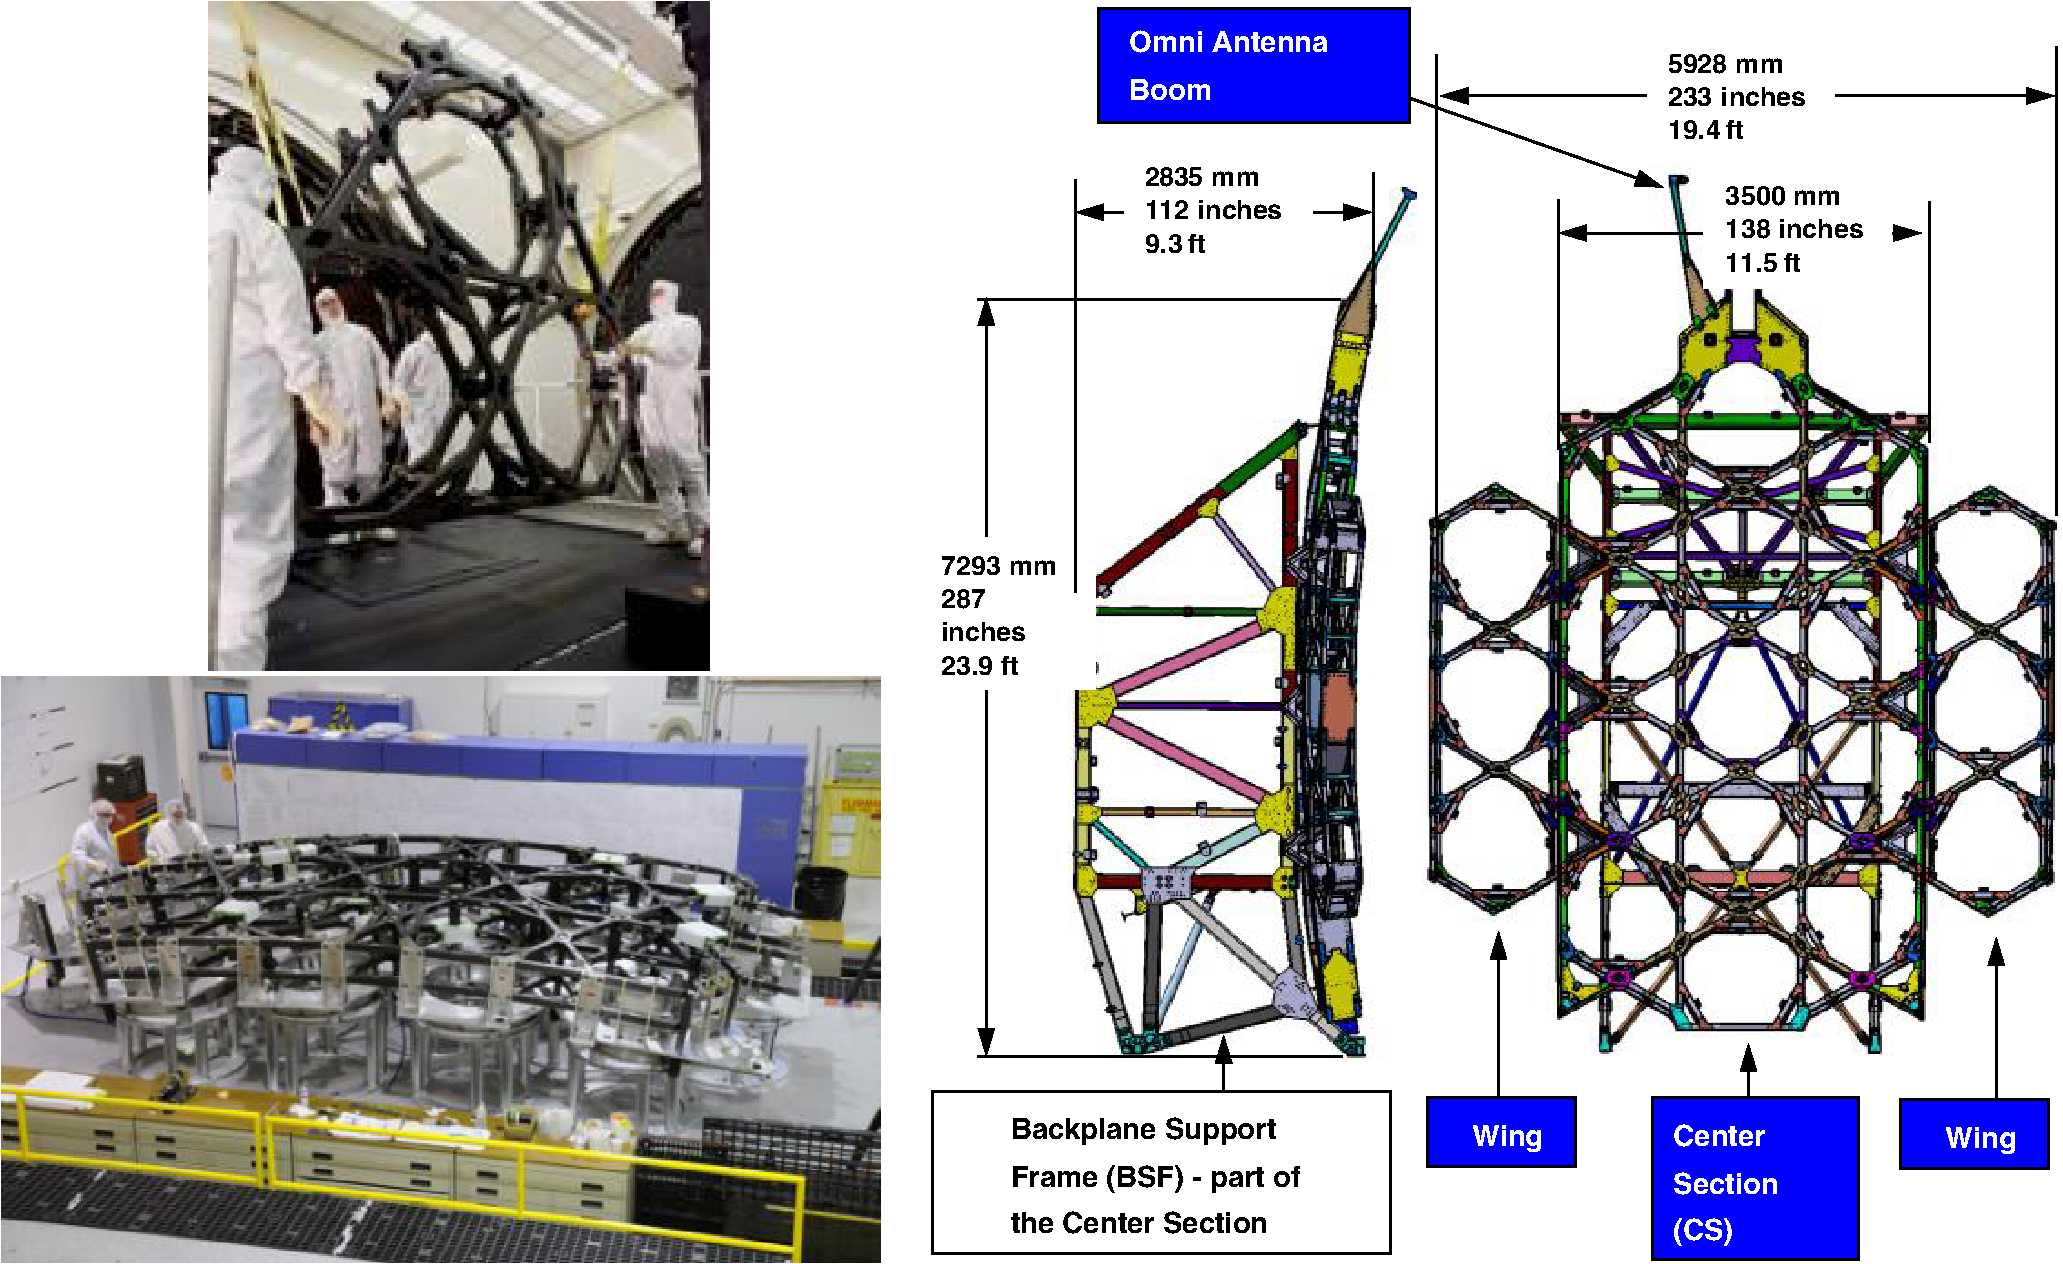 The PMBA design enables the optical elements to attach to the center section, which is designed to be optically stable. The backplane support frame is designed as the primary load-carrying structure of the telescope structure and the ISIM, along with all the thermal control equipment. While not completely independent, segregating these functions allows their respective designs to be tailored to their primary purposes. The SMSS is comprised of four tubes that, combined with the PMBA center section, create a four-bar linkage. With one driven hinge and four passive hinges, the SMSS deployment is fairly simple, as shown in Fig. 15. The two lower tubes are fixed to the secondary mirror mount, while the single strut on top attaches with a hinge. All four tubes are composite, with CTE tailored to be very stable. All four tubes have been manufactured and a full-length development tube was tested and shown to meet the stringent cooldown bending requirements necessary to keep the SMA in the capture range of the WFSC process. 4.Wavefront Sensing and ControlThe WFSC process is used to take the telescope PM segments and the SM from their nominal conditions following deployment and cooldown to their final aligned state with the 18 PM segments phased.17 The WFSC process uses imagery taken with the science instruments to sense the state of telescope and provide feedback information on performance. The fine phasing will be done using imagery from the NIRCam, and field-dependent alignment of the PM/SM to the aft optics and instruments uses imagery from all instruments. Figure 16 shows the sequence of the commissioning process. Fig. 16The wavefront sensing and control commissioning process flow takes the telescope in its initial deployed state and brings it into an aligned and phased telescope that meets the required performance. 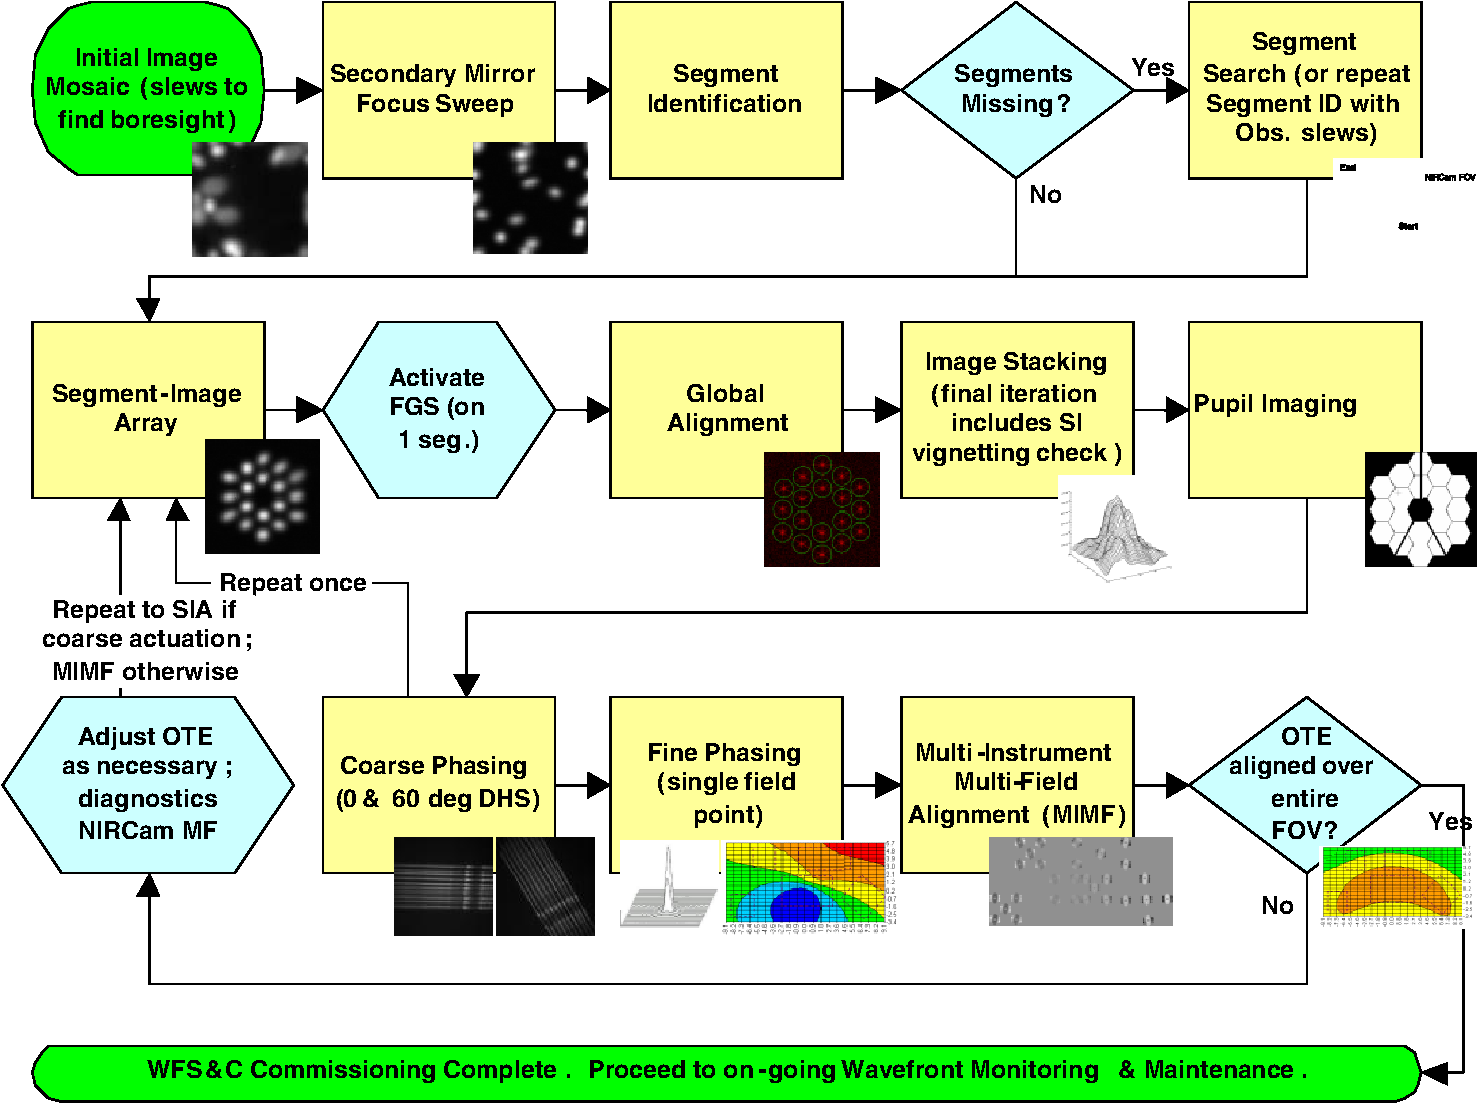 Fig. 17The test bed telescope is a scaled replica of The James Webb Space Telescope, having full sensing and control functionality.  After deployment and cooldown, the PM segments will likely be tilted relative to each other and have relative piston errors. Each of the individual segments will align with the rest of the telescope to produce 18 separate poorly aligned minitelescope images. A sequence of images taken for a sweep of the SM is used to set an average focus, and then individual segments are tilted sequentially to identify which image goes with which segment. The image locations are used to correct the tilts. For the next phase, the segment images are put into an array. Using SM defocus sweep, focus-diverse phase retrieval is used for the global alignment. The array images are then stacked into an array and a dispersed Hartmann sensor is used to determine the segment-to-segment piston mismatches. This allows the PM segments to be coarsely phased such that the telescope is now within the capture range for performing focus-diverse phase retrieval on the global telescope to achieve final performance (“fine phasing”). After the telescope is aligned and phased to the NIRCam, the other NIR instruments have focus adjustment capability to achieve common focus with the telescope aligned to NIRCam. MIRI is operating at longer wavelengths, and has sufficient depth of focus to tolerate the differences without active adjustment. The final process is to perform multi-instrument, multi-field wavefront sensing to align the PM/SM front-end optics to the aft optics. This reduces field-dependent astigmatism and field-dependent focus errors to provide good performance over all instrument fields of view. Following commissioning, the observatory may perform fine phasing at prescribed intervals to maintain telescope performance. The baseline plan is to perform maintenance updates as needed at 14-day intervals. The entire commissioning process has been demonstrated on the test bed telescope (TBT). The TBT is a scaled replica of the JWST optical telescope element (OTE) design having a 1-m aperture (shown in Fig. 17). Replication includes the sensing suite and functional degrees of freedom of control of the PMSAs and SM. The preflight verification that the flight commissioning process can bring the telescope into specified performance relies on a validated computer model [Integrated Telescope Model (ITM)] that simulates the flight hardware and the interaction with the WFSC process.18–23 The ITM simulates the implementation of the commands sent by the ground system to the observatory to control actuators and acquire imagery, performs the optical ray trace and diffraction calculations to form the images, and simulates the instrument/detector performance to create the digitized images sent to the ground for WFSC processing. The ITM processing uses preflight test and analysis data to provide realizations of the potential beginning states of the observatory at the beginning of commissioning and in conjunction with the WFSC processing goes through the commissioning process to achieve the final operational state. Figure 18 represents the flow of test and analysis data into the ITM simulations. The testing and analysis are gathered in an incremental fashion with individual mirror and science instrument verification done at those levels of assembly. Then additional testing of the science instruments and measurement of the coalignment of the instruments within the ISIM structure is done at the ISIM assembly level. The highest level of testing is done at the integrated OTE and ISIM level (OTIS). ITT Exelis has the lead responsibility for the installation of the mirror subsystems to form the OTE, and subsequently the integration of the ISIM to the OTE into the OTIS configuration with support from Northrop Grumman Aerospace Systems (NGAS), BATC, and ISIM team personnel. The OTIS will be tested at cryogenic temperatures in the large vacuum chamber at Johnson Space Flight Center, with ITT Exelis leading the optical testing with support from BATC for WFSC activities, and support from NGAS and ISIM team personnel. Fig. 18Testing and analysis are used to establish the “as-built” state of the telescope including the uncertainties. These are then used in Monte Carlo simulations to verify that the telescope and instruments may be brought into a state where the necessary performance will be achieved for the ensemble of possible starting conditions. 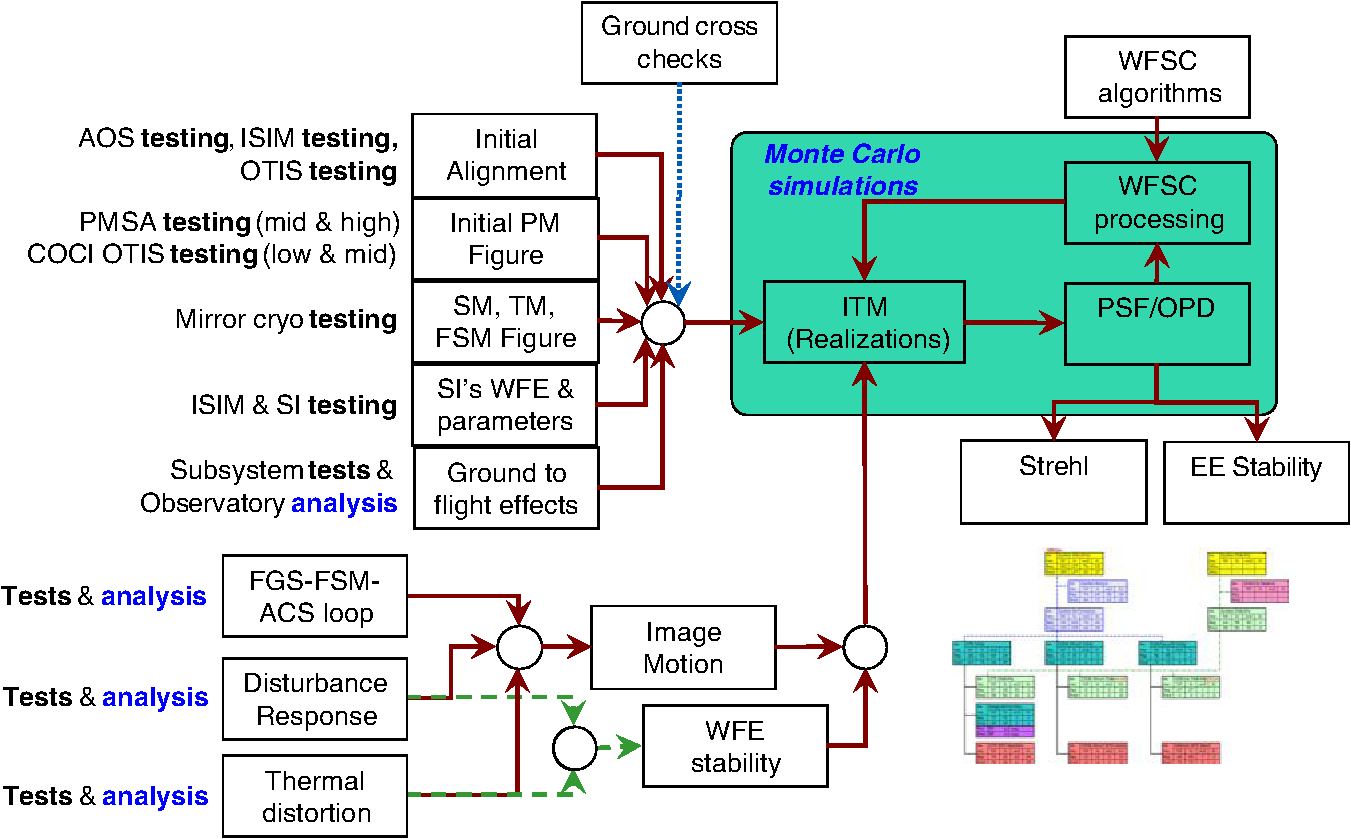 5.StabilityThe image quality stability is tied to maintaining radiometric stability. The driving performance requirement is specified in terms of the stability of the EE within an encircling radius of 80 mas for a wavelength of 2 μm. The standard deviation of the EE for observations over period of 24 h should not exceed 2% of the mean EE, and long-term variations over intervals up to 14 days should not change by more than 3% of the mean. The optical system needs to be mechanically stable to achieve these performance requirements. For JWST, the stability of the imaging performance falls into two categories: dynamic structural responses to mechanical disturbances that are transient and may last for time scales of minutes to hours, and longer duration thermal distortion responses associated with changes in orientation of the observatory with respect to the Sun. The time constants for the thermal response are on the order of a few days. 5.1.Dynamic StabilityThe mechanical disturbances impacting the JWST optical performance come mostly from two sources: the reaction wheel assembly (RWA) within the attitude control system in the spacecraft, and the cryogenic cooler (refrigerator) used to cool the focal planes in the MIRI instrument to 6 K. The RWA design reduces the magnitude of the disturbances, and then uses passive isolators to attenuate disturbances greater than from being transmitted into the OTE and ISIM structures. The response of the OTE varies as the disturbance frequencies change with wheel speed. The wheels change speed to maintain spacecraft pointing as the angular momentum of the observatory changes due to the solar torque exerted on the observatory. The variation in resulting OTE WFE and EE performance is the difference between “worst-case” responses and quiescent periods when the wheels are at speeds with little response and are considered as a contributor to the short-term (24-h) image instability. The individual mirrors are quite stiff (first-mode frequencies of the substrates are several hundred hertz) with mirror surface responses less than 1 nm rms. The response of the PMSA support structures and the PMBA are at lower frequencies, and do contribute to figure error of the global 18-segmented PM. These figure errors are on the order of the required performance for specific RWA wheel speeds. The main source of disturbance from the cooler is the pulse-tube compressor mounted in the spacecraft. The contributions from other components in the cooler system are less significant. A key factor in the response to the compressor disturbance is the transmission through the coolant line structures between the spacecraft and the cold head located in the MIRI instrument. The responses as a function of frequency are narrowly peaked (low damping). Meanwhile, the compressor speeds are adjustable and controllable. The control-speed command resolution is less than the response curve bandwidth, so the disturbance could be considered to be steady state, and not a stability concern. However, the speed sensing noise is sufficient that the compressor speed would not necessarily remain within a response bandwidth and the resulting disturbance response could change. Therefore, the compressor response is considered as a contributor to the short-term (24-h) image instability. However, if the speed was tuned to a sufficiently wide region with low response, the result would be steady state and small. Currently “tuning” of the compressor speed is not being relied on to achieve the allocated performance. 5.2.Thermal Distortion StabilityThe other source of change in the optical performance is the thermal distortion resulting from slight changes in the thermal temperature profile of the structures caused by the change in angle of incident sunlight on the observatory for different pointing of the telescope within the field of regard. The temperature changes are quite small (fraction of a Kelvin), but over the large structures, can cause changes. The beryllium mirrors at cryogenic temperatures have extremely low CTEs () and have no significant figure change. The alignments depending on the larger-sized composite structures have larger tolerances without causing significant WFE. Analysis shows that these errors over a 14-day interval will be on the order of a few nm rms WFE. The one significant temperature instability factor is the global surface figure of the PM. The combination of distortions in the PMBA and differences in the temperatures among the PMSA hexapod support structures cause a significant contribution to WFE instability over a 14-day interval. The current predictions for the response to the stressing benchmark scenario of going from a temperature soak at the coldest pointing within the field of regard to the hottest pointing direction are right at the EE change of 3%. These predictions include large modeling uncertainties added into the predicted performance, and furthermore, operationally, these stressing scenarios will not likely occur, giving confidence that JWST will be capable of meeting both the short-term and long-term EE stability required. 6.Image Motion (Line-of-Sight Stability)Image quality depends both on the WFE content in the “instantaneous” image, but also on the image motion that occurs during the “exposure” time for acquiring the image. The portioning of the allowable WFE and image motion is based on equivalency of the Strehl ratio calculations. For JWST, there are three types of image motion that need to be considered. The first is the traditional random motion about the mean centroid that is normally distributed in each axis independently (Gaussian blur), the second is a linear sinusoidal oscillating motion, and the third is a uniformly moving linear smear. The magnitudes of all three types are small () and do not have any impact on EE stability. That is, the difference between the EE at an image motion of 7 mas compared to no image motion is negligible. However, the effect on the top-level Strehl ratio metric for image quality is noticeable. As such, the total Strehl requirement is partitioned into a WFE allocation and image motion allocations. The analytic expressions for calculating Strehl used for this partitioning follow: where is the rms OPD or WFE, is the single axis standard deviation of a Gaussian blur, is the amplitude for a linear sinusoidal oscillating image motion, is the length of a uniform linear smear. is the circumscribed diameter of the aperture, and is the wavelength of light. These equations apply when and , , and .The image motion may be partitioned into three temporal domains. The first is the high-frequency image motion that is above the fine guidance control system (FGS/FSM) bandwidth and not rejected. It is characterized by a Gaussian blur. The second is the unrejected error within the fine guidance bandwidth. Besides the residual error for stabilizing the guide star image, there is an additional allocation for the differential motion resulting from motion of the FSM causing the field distortion map to breathe with the FSM angle, causing slight motion of target objects in the science instruments relative to the stabilized guide star in the FGS. This motion of the target object would be an asymmetric Gaussian blur. Also, the fine guide control does not control the rotation of the image about the optical line of sight (LOS). This roll degree of freedom is controlled by the spacecraft Attitude Control System (ACS). The roll errors cause the OTE image to rotate about the guide star, so target objects in science instruments would move along an arc at a radius equal to the separation in field from the guide star. The small magnitude of the roll combined with the field separations result in quasi-linear sinusoidal oscillations of the target image. The final partition is for motions from thermal distortion that cause relative motion between the guide star and target object images that are not sensed by the FGS. These motions result from thermal distortions causing the OTE to roll relative to the spacecraft star-tracker frame of reference, and from thermal distortions within the ISIM structure that cause bore-sight alignments of the science instruments to shift relative to the FGS bore sight. These motions would result in a linear smear in the image. The current system analysis and modeling show that the image motion will be under the 7 mas allocation. 7.Radiometric ThroughputAs described in the introduction, the science objectives require a large collection area with an efficient optical transmission. The performance metric used to assess the design on JWST is the product of the , that is, the optical throughput per solid angle (see Table 1). The polished area of the 18 PM segments that are not obscured by the shadowing of the three SMSS struts provides a collection area . The transmission for the telescope is the product of the reflectivity for each of the four mirror surfaces: PM, SM, TM, and FSM. Table 1The transmission including allocated coating performance and contamination allocations will meet performance requirements. Likewise the collecting area will exceed its allocated minimum, such that the combined area×transmission will support the science goals.
The protected gold coatings set the upper limit for the reflectivity, with subsequent degradation from the effects of contamination and surface degradation from the L2 environment. The protected gold reflectivity rolls off at the shorter wavelengths, but is fairly constant from wavelengths , as shown on the left in Fig. 19. The exception is a spectral feature at the 8-μm wavelength shown in more detail on the right in Fig. 19. This absorption feature is polarization specific, showing no effect for polarization, and increasing with angle of incidence for polarization. The area weighted-average angle of incidence on each of the telescope mirrors is relatively small, which mitigates this effect. (The averaged angles of incidence at each of the mirror surfaces for the telescope are PM, 7.8 deg; SM, 8.9 deg; TM, 2.8 deg; and FSM, 7.1 deg.) Fig. 19The graph on the left shows the reflectivity of the protected gold mirrors. The reflectivity drops off at short wavelengths below 1 μm, and has a small dip at 8 μm. The drop in reflectivity at 8 μm is shown in more detail on the right.  The mirrors that have been coated are showing performance better than allocated as shown in Fig. 20. Fig. 20The average reflectance for the primary mirror segments (17 of 18 have been measured) and the reflectance of the secondary mirror, tertiary mirror, and fine steering mirror are shown in the upper curves. The combined reflectance for system transmission is shown in the lower curve. The requirement for the transmission for the pristine mirrors is to be greater than the values shown in the stepwise bottom curve. 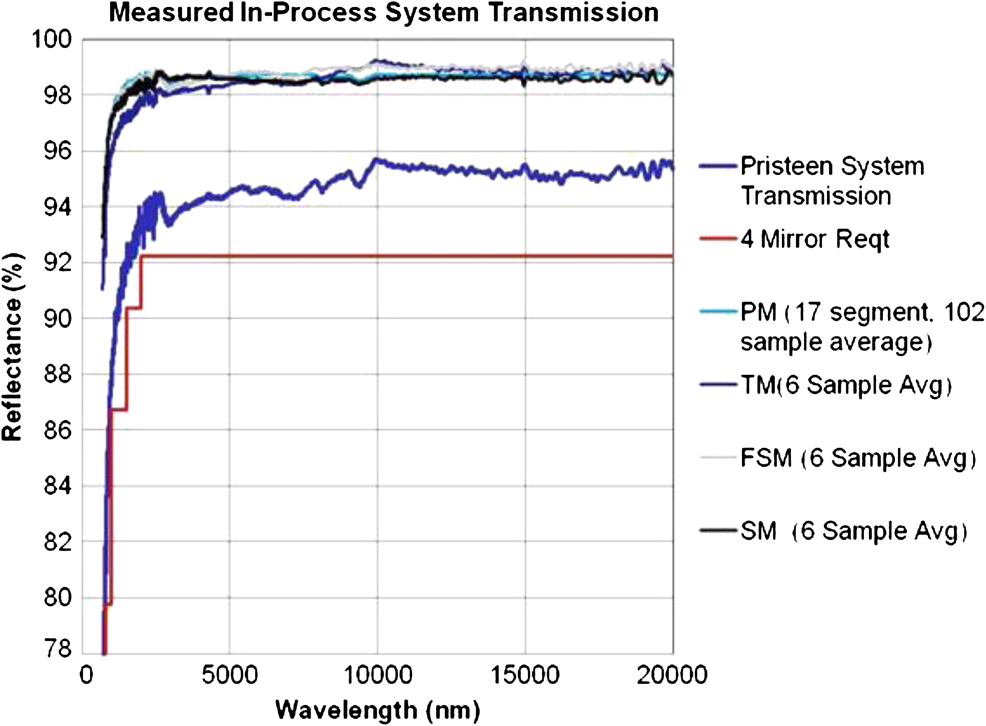 In order to take full advantage of the large aperture and highly reflective coatings, contamination needs to be maintained at very low levels. The molecular contaminants will come in three flavors. The first will be a mixture of mostly hydrocarbon contaminants accumulated during integration and testing and are represented by common “clean room” environments. The second is amorphous carbon that may form as a result of exposure of the hydrocarbons to UV light during flight. The solar UV exposure is limited to very short durations () between shedding of the launch fairing and the deployment of the sunshields. As a result, the amorphous carbon is expected to be quite low and likely not detectable. The third molecular contaminant will be molecular water. During cooldown, there will be migration of moisture out of some of the materials, and collection in the form of thin layers of ice on the colder surfaces. Thermal profiles and moisture migration analyses have been performed and are being refined to set these limits. The initial analysis shows only the FSM mirror at risk. A heater for temperature control of the FSM during cooldown has been added to eliminate the ice buildup. The effect of these thin nanometer layers of molecular contaminants have been analyzed in conjunction with the protected coatings of the mirrors using thin-film interference calculations. Figure 21 shows the reflectance performance over the NIR, showing the effect of up to 20 nm of the nonvolatile residue (molecular hydrocarbons) with varying layers of water ice representing the range for various mirrors. Fig. 21The plot shows the reflectivity for a clean coated mirror compared with the losses for 20 nm of molecular contaminants nonvolatile residue and various thicknesses of ice. 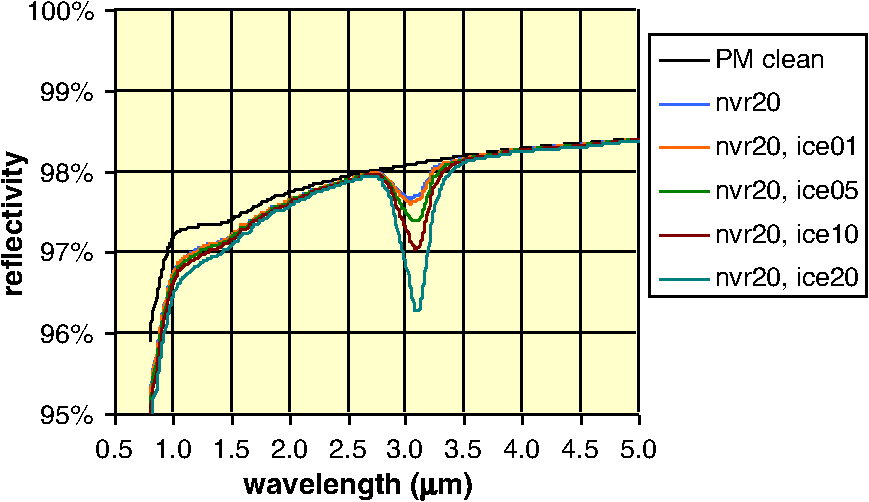 Particulate contaminants will contribute to the bidirectional reflectance distribution function (BRDF) for the mirrors and affect the transmission as well as play a role in the scattering, which affects the stray light performance. Consequently, all integration and test operations will be performed in clean rooms or with the optical surfaces bagged sufficiently to preclude contamination exposure. The final contributor is the potential for damage from impacts of micrometeoroids in the L2 environment. The damage from these will manifest itself as microscopic pitting of the mirror surface that will behave as a scattering center much in the way of particulate contaminants. The cumulative particle flux versus particle mass and the velocity distribution of the flux for the L2 micrometeoroid environment is summarized in Fig. 22. Further description of the L2 micrometeoroid environment is described in Ref. 24. Fig. 22The plot on the left is the particle flux versus particle mass as given by the Grun equation. The plot on the right shows a representative distribution of the particle velocities for the L2 environment. 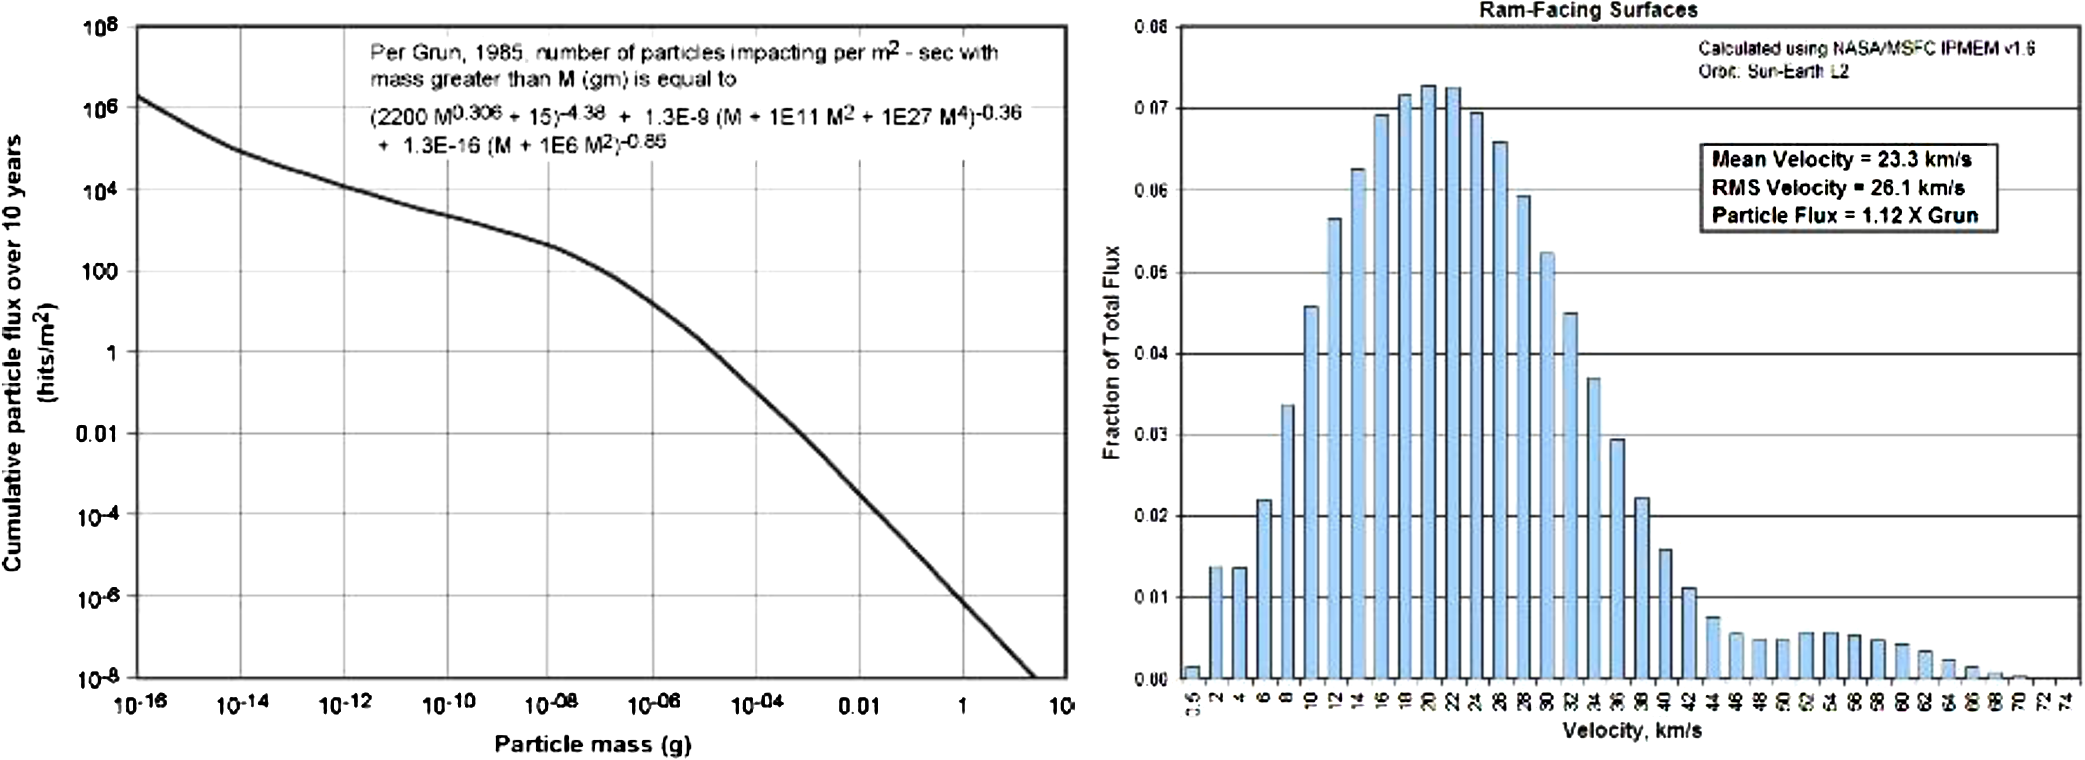 Experiments have been performed that have looked at the effects of hypervelocity particle impacts on bare beryllium mirrors25,26 and on protected gold beryllium mirrors.27 The bare beryllium tests used aluminum particles having a density of , sizes in the 32- to 93-μm range, and velocities in the 5.7- to range. The damage estimate from these experiments was on the order of of the mirror area over a 10-year mission. The protected gold coating on beryllium tests used latex particles having a density of and iron particles having a density of . The sizes of these particles were in the 0.7- to 1.44-μm range, and the velocities were in the 2- to range. The damage estimate from these studies was on the order of over a 10-year mission. These studies combined with the L2 environmental conditions show that the degradation of the optical throughput for JWST will be negligible. 8.Stray LightThe control of stray light uses a three-layered approach to prevent unwanted photons from reaching the science instrument detectors. The inner line of defense is to enclose each of the instruments individually as shown on the left in Fig. 23. Each of the instruments is shown separately, and then integrated together in the ISIM structure in the center section of the left side in Fig. 23. Light can only enter the SIs at the openings around their fore optics (pick-off mirrors and fold mirrors). The science instrument (SI) optics are baffled such that detectors see little light other than that which comes from their internal pupil stop. Fig. 23Each instrument is enclosed so that light only enters through the openings where their respective pick-off mirrors are placed to relay the optical telescope element (OTE) image as shown on the left. (Each instrument is shown individually, and as an integrated unit in the center. The instruments are enclosed within the integrated science instrument module (ISIM) such that the only light directly entering the cavity comes through the aft optics subsystem aperture as shown on the right for the enclosed ISIM attached to back of the primary mirror of the OTE. 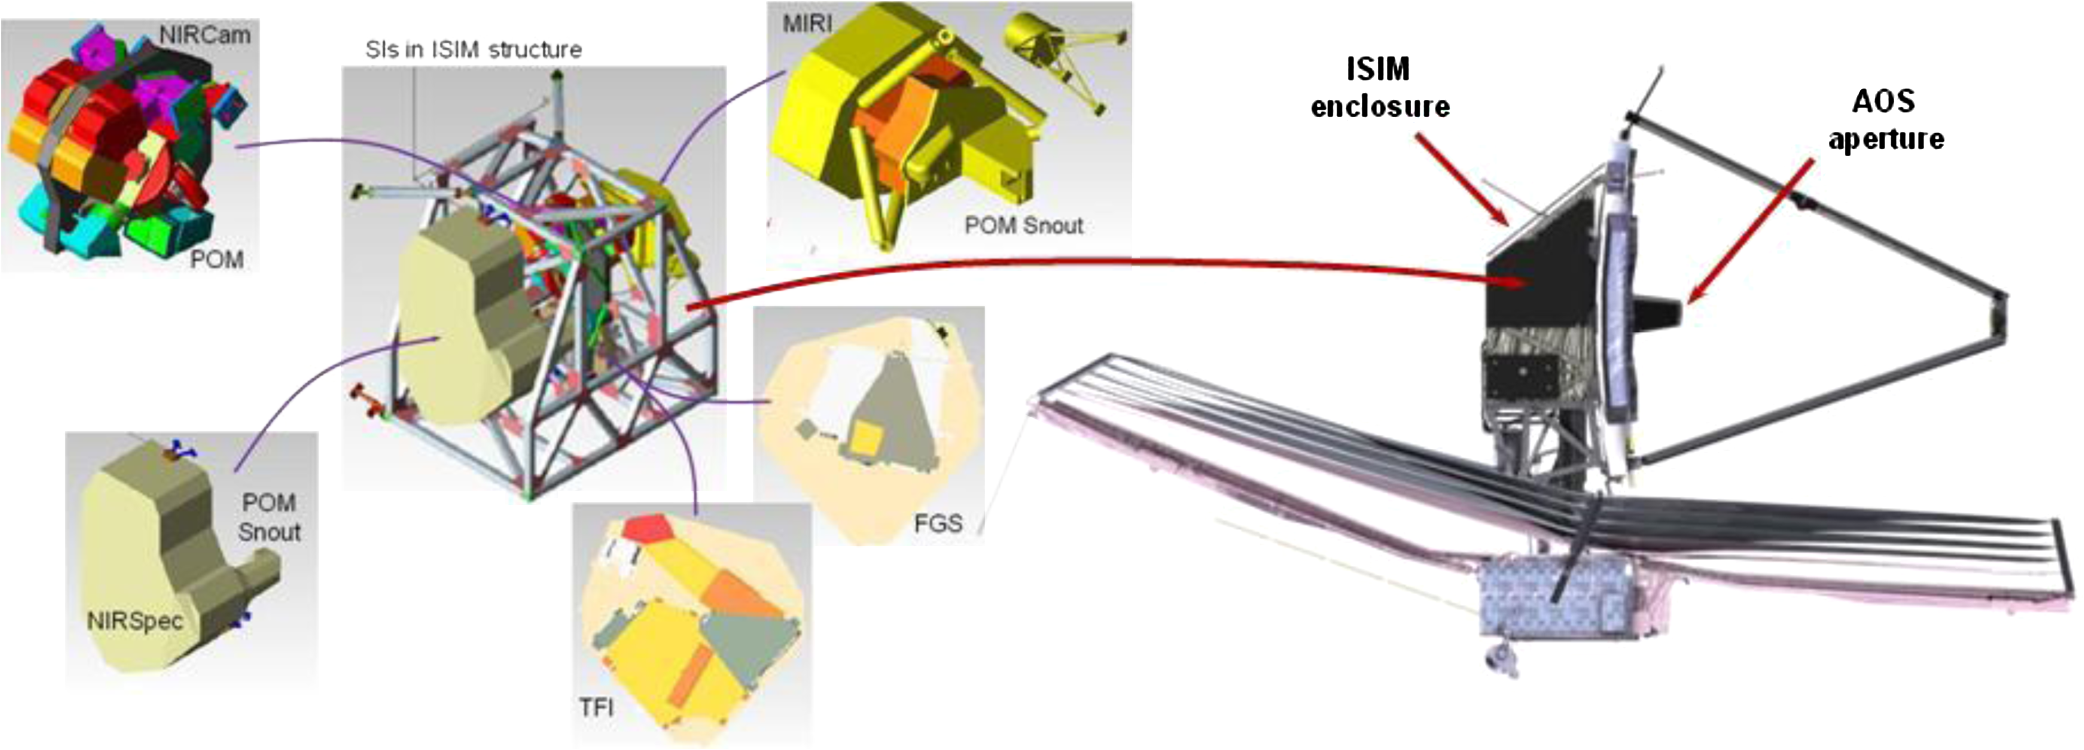 The second line of defense is to enclose the ISIM such that light entering the ISIM cavity is restricted to that which can enter through the OTE AOS entrance as shown for the integrated OTE and ISIM on the right in Fig. 23. The light entering the AOS entrance is either light that is within the optical train of the OTE forming an image of the sky at the OTE optical surface, or weak illumination from the celestial sky coming through the AOS entrance, bypassing the OTE optics, and illuminating instrument pick-off mirrors and other structures internal to ISIM. These paths have the potential to pass just above the edge of the FSM and masquerade as marginal rays coming from the OTE exit pupil and going directly to the SI detectors. However, the FSM has an oversized baffle around its perimeter so that when the internal stops of the instruments are imaged onto the FSM (SI entrance pupil), the FSM baffle blocks these direct paths, known as the “rogue path.” Figure 24 shows the geometry of the rogue path. The tolerances for the alignment of the science instruments to the OTE have been taken into account to ensure that the rogue path is blocked with adequate margins. Indirect scattering of the celestial light off the science instrument pick off mirrors and structures have been shown to not be significant contributors to observatory stray light levels. Fig. 24The schematic on the right shows the rogue path ray that enters the aft optics subsystem aperture, skims past the top of the fine steering mirror (FSM), and is picked up by the science instrument (SI) pick-off mirror as if it was coming from the margins of the optical telescope element (OTE) exit pupil located at the FSM. The picture on the left shows the overlay of the OTE exit pupil within the FSM mask, and the radial extension of the FSM mask to form the oversized baffle. The semi-transparent circle represents the overlay of the SI entrance pupil at the FSM. The alignments with tolerance do not allow the entrance pupil to extend above the FSM baffle, blocking the Rogue path from reaching the SI POM. 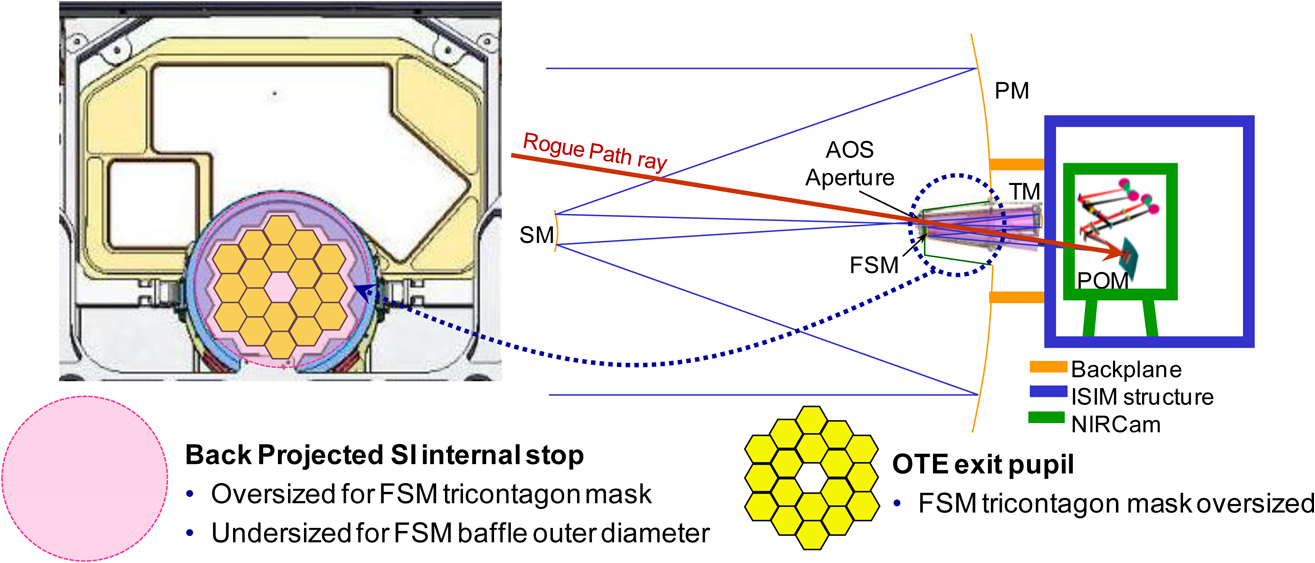 The third and most significant line of defense is the sunshield. First, it blocks the high fluence levels of sunlight from impinging on structures on the darks side of the sunshield where the optics are located so that the only fluence on the exposed PM and SM optics is from the celestial sky. Secondly, the sunshield thermally isolates the OTE and ISIM such that surface temperatures and emissivities are controlled to keep the self-emission IR light levels low. This results in the dominant source of stray light in the NIR to being celestial sky illumination that scatters from observatory surfaces into the optical train, with some additional amount resulting from the compromise of oversizing internal stops to avoid blockage of any light collected by the PM and having a well-defined exit pupil shape for the WFS. This path through the gap between the FSM pupil mask and the OTE exit pupil is called the “truant path.” The geometry for the truant path is shown in Fig. 25. In the MIR, the self-emission from the observatory surfaces dominates over the external celestial sources at wavelengths of 10 μm or longer. Fig. 25The internal stop at the fine steering mirror in the aft optics system is oversized so that the primary mirror (PM) is the aperture stop of the system is shown on the left. The image of the internal stop projected onto the PM and surrounding baffle is shown in the center, where small gaps are seen that allow light from behind the PM to reflect from the secondary mirror (SM) edges and pass through the stop as shown on the right. This is so-called truant path source of stray light.  The NIR stray light may be categorized two ways: one is to categorize by the paths taken between the sky and the focal plane, and the second is to show the contributions from different parts of the sky relative to the orientation of the observatory.28,29 The paths are described by the sequence of surfaces that the light interacts with on its way to the focal plane. The first method shows that for uniform sky brightness, the specular truant path, PM scatter, scatter from black Kapton baffles and enclosures, and the scattering from the remaining mirrors are roughly equivalent (see Table 2). The relative path weighting for nonuniform sky, however, can change in relative mix since the paths themselves have preferential portions of the sky to which they are susceptible. Table 2The relative contribution to stray light analyzed by path through the system with relevant surface identified producing the stray light.
The second method creates what is called the geometric susceptibility (GS) map for the observatory and is shown in Fig. 26. The integrated stray light as a function of the half-angle of a cone about the pointing direction (V1) is plotted to the right. This plot shows that over half the stray light comes from a cone half-angle of 18 deg. The jump at is the result of the truant path contribution. Fig. 26Plot showing the susceptibility to stray light from sources in the sky relative to the orientation of the telescope. The plot is in spherical coordinates with the origin at the vertex of the primary mirror and the polar direction along the optical axis of the telescope (V1). The azimuthal directions are relative to the V3 axis, which points away from the spacecraft and sunshield toward the sky. 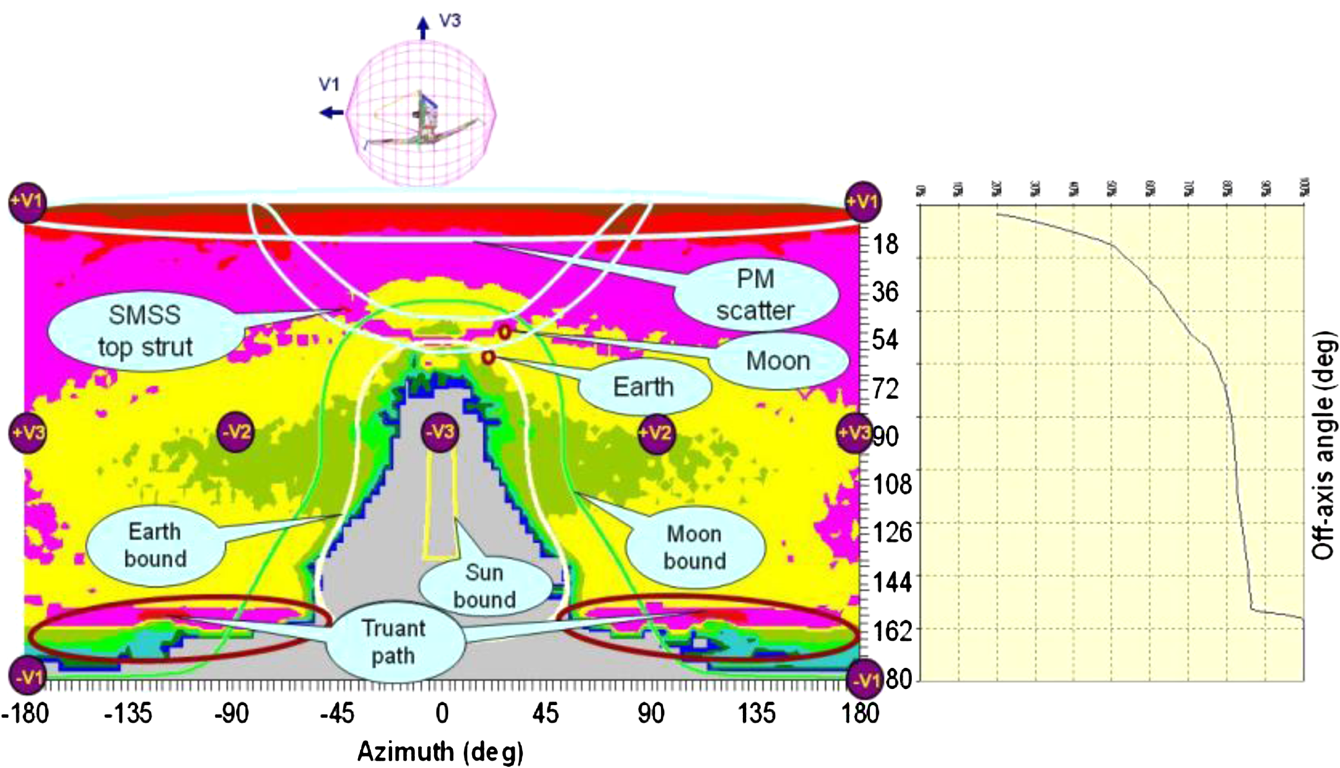 The convolution of the GS map with the sky brightness for a given orientation of the observatory is calculated to determine the stray light. The celestial sky brightness is separated into a contribution from sources beyond our solar system referred to as the galactic sky and is fixed in galactic coordinates. The second contribution is from sources in our solar system. The brightness moves with the Earth–Sun direction as it moves through the zodiac. This contributor is referred to as the zodiacal sky (or zodi sky for short), and is described relative to the ecliptic plane and the anti-Sun direction. The galactic sky brightness in ecliptic coordinates is shown in Fig. 27. Shown in the plot are locations of fields of interest for science, and a benchmark field that is a stressing case for calculating the stray light. Fig. 27Plot of the brightness of the celestial sky in ecliptic coordinates. The Milky Way is in the center. Positions of dark fields of interest and the benchmark-analysis pointing direction are labeled. 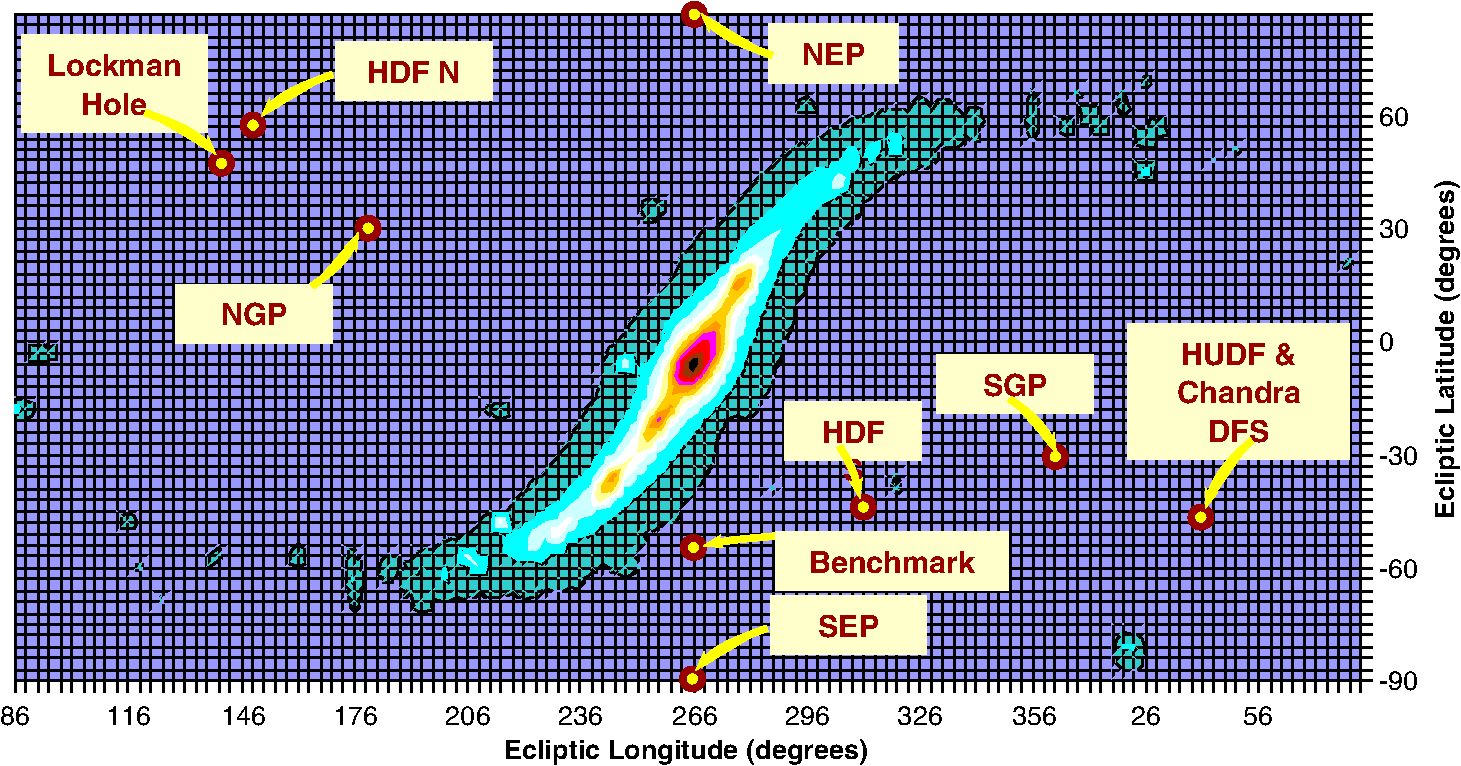 The results for the stray light calculations including the listing of the 10 paths having the highest contributions are given in Table 3. We can see that when the galactic center is near the forward cone of the observatory such as the benchmark pointing, the resulting stray light is greater with reduced contribution from the truant path coming from the dark sky behind the observatory. The scattering from the PMBSS (PM black Kapton baffle) and the PM are the dominant contributors. When the observatory is pointed away from the galactic center such as at the north ecliptic pole (NEP) or the Hubble ultra deep field (HUDF), the contribution from the scattering from the forward surface is reduced. For the truant path, the levels are not changed much with the NEP slightly greater, but the HUDF lower. This portends favorably for low stray light levels to observe the deep fields of interest. Table 3Table showing 10 top paths for stray light and how they change relative to where the observatory is pointed.
In the MIR, the contribution from the galactic sky becomes negligible, but the contribution from the zodi sky remains a factor until wavelengths are longer than 10 μm. At 10 μm the zodiacal sky contribution is comparable to the sum total of the thermal self-emission from observatory surfaces. At longer wavelengths, the thermal self-emission dominates. Table 4 shows the contributions from the observatory surfaces and scattering from the zodi sky at wavelengths of 10 and 20 μm.29 At 20 μm, we see that the largest contributor is from the emission of the PM segments. The temperature of the segments is not uniform, and the bottom four segments account for nearly all of the PM contribution. As a result, monitoring the predicted observatory thermal performance during preflight verification becomes the bellwether for assessing the MIR stray light, long-wave performance. Our current predictions for system performance show good margin against requirements. Table 4Thermal self-emission stray light from observatory surfaces and external contribution from the zodiacal sky at 10 and 20 μm.
9.SummaryThe JWST is poised to enable new and unique science opportunities to add to our growing understanding of the universe. It is breaking new ground for large deployable observatories in space. The low-mass optical design with the technology for deploying and using image-based wavefront sensing to actively control the alignment and phasing of the telescope have been demonstrated. The optical design is robust and all the mirrors (PMSAs, SM, TM, and FSM) have been fabricated, cryo polished, coated, and completed acceptance testing. Likewise, the radiometric throughput performance and stray light levels will be conducive to performing the deep-field observations critical to the science themes. The team is enthusiastically moving forward! AcknowledgmentsWork was supported in part by the Ball Aerospace & Technologies Corp. (BATC) subcontract with NGAS under the JWST contract NAS5-02200 with the NASA Goddard Space Flight Center. The JWST system is a collaborative effort involving the National Aeronautics and Space Administration, European Space Agency, Canadian Space Agency, the astronomy community, and numerous principal investigators. We acknowledge the support and contributions of the many engineers and scientists among the many organizations that make up the JWST community. We especially wish to recognize the beryllium mirror team consisting of individuals at Brush Wellman, Axsys Technologies, Tinsley, and Quantum Coating, Inc. who were instrumental in supporting the BATC development of the mirrors. We also wish to recognize the team at ATK Composite Optics who provided support to NGAS in the development of the composite design and fabrication of the telescope support structures, and the team from ITT Exelis who have led the development of the ground support equipment for the OTE integration and test, and have a leadership role in the observatory optical testing program. The success of the team has also been dependent on the support by NASA personnel and their cadre of consultants, including the OTE Product Integrity Team, a group of experts from industry and academia who have reviewed and advised as we moved forward. ReferencesR. E. Williams,
“The Hubble ultra deep field: observations, data reduction, and galaxy photometry,”
Astron. J., 112 1335
(1996). http://dx.doi.org/10.1086/118105 ANJOAA 0004-6256 Google Scholar
S. V. W. Beckwithet al.,
“The Hubble ultra deep field,”
Bull. Am. Astron. Soc., 35
(3), 723
(2003). 0002-7537 Google Scholar
I. Labbeet al.,
“Star formation rates and stellar masses of galaxies from IRAC observations of the WFC3/IR early release science and HUDF fields,”
Astrophys. J. Lett., 716 L103
(2010). http://dx.doi.org/10.1088/2041-8205/716/2/L103 0571-7248 Google Scholar
K. R. Stapelfeldtet al.,
“First Look at the Fomalhaut debris disk with the Spitzer Space Telescope,”
Astrophys. J. Suppl., 154
(2004). http://dx.doi.org/10.1086/apjs.2004.154.issue-1 0067-0049 Google Scholar
C. A. Beichmanet al.,
“Imaging young giant planets from ground and space,”
Pub. Astron. Soc. Pacific, 122
(2010). http://dx.doi.org/10.1086/648998 PASPAU 0004-6280 Google Scholar
D. Deminget al.,
“Discovery and characterization of transiting superearths using an all-sky transit survey and follow-up by the James Webb Space Telescope,”
Pub. Astron. Soc. Pacific,
(2009). http://dx.doi.org/10.1086/605913 PASPAU 0004-6280 Google Scholar
P. KalasJ. R. GrahamM. Clampin,
“A planetary system as the origin of the structure in Fomalhaut’s dust belt,”
Nature, 435 1065
(2005). http://dx.doi.org/10.1038/nature03601 0028-0836 Google Scholar
P. LightseyD. Ebbets,
“The TRW/Ball Aerospace concept for JWST,”
NGST Science and Technology Exposition, 207 37
–45 Astronomical Society of the Pacific, San Francisco, CA
(2000). Google Scholar
J. Nellaet al.,
“James Webb Space Telescope (JWST) observatory architecture and performance,”
Proc. SPIE, 5487 576
–587
(2004). Google Scholar
S. Kendricket al.,
“Design and test of semi-rigid beryllium mirrors for lightweighted space applications; SBMD cryogenic performance update and AMSD design approach,”
221
–229
(2000). Google Scholar
T. Reedet al.,
“Final results of the Subscale Beryllium Mirror Demonstrator (SBMD) program,”
Proc. SPIE, 4451 5
–14
(2001). http://dx.doi.org/10.1117/12.453614 PSISDG 0277-786X Google Scholar
J. B. Hadawayet al.,
“Cryogenic optical testing results for the Subscale Beryllium Mirror Demonstrator (SBMD),”
Proc. SPIE, 4451 15
–26
(2001). http://dx.doi.org/10.1117/12.453625 PSISDG 0277-786X Google Scholar
S. E. KendrickT. ReedS. Streetman,
“In-process status of the 1.4-m beryllium semi-rigid Advanced Mirror System Demonstrator (AMSD),”
Proc. SPIE, 4451 58
–66
(2001). http://dx.doi.org/10.1117/12.453654 PSISDG 0277-786X Google Scholar
P. A. Lightseyet al.,
“Optical performance for the actively controlled James Webb Space Telescope,”
Proc. SPIE, 7731
(2010). http://dx.doi.org/10.1117/12.859091 PSISDG 0277-786X Google Scholar
S. StreetmanL. Kingsbury,
“Cryogenic nano-positioner development and test for space applications,”
Proc. SPIE, 4850 274
–285
(2002). http://dx.doi.org/10.1117/12.461229 PSISDG 0277-786X Google Scholar
C. Atkinsonet al.,
“Technology demonstration of large stable cryogenic composite structures for JWST,”
Proc. SPIE, 6687
(2007). http://dx.doi.org/10.1117/12.734753 PSISDG 0277-786X Google Scholar
A. R. Contoset al.,
“Aligning and maintaining the optics for the James Webb Space Telescope (JWST) on-orbit: the wavefront sensing and control concept of operations,”
Proc. SPIE, 6265
(2006). http://dx.doi.org/10.1117/12.669067 PSISDG 0277-786X Google Scholar
A. A. Bartoet al.,
“Optical performance verification of the James Webb Space Telescope,”
Proc. SPIE, 7010
(2008). http://dx.doi.org/10.1117/12.790483 PSISDG 0277-786X Google Scholar
A. Contoset al.,
“Verification of the James Webb Space Telescope (JWST) wavefront sensing and control system,”
Proc. SPIE, 7010
(2008). http://dx.doi.org/10.1117/12.786984 PSISDG 0277-786X Google Scholar
J. S. Knightet al.,
“Image quality verification analysis of the JWST,”
Proc. SPIE, 7738
(2010). http://dx.doi.org/10.1117/12.858348 PSISDG 0277-786X Google Scholar
J. S. KnightD. S. ActonP. A. Lightsey,
“JWST integrated system modeling,”
Frontiers in Optics, OSA Technical Digest (CD),
(2010). Google Scholar
J. S. KnightP. A. LightseyA. A. Barto,
“Verification of the observatory integrated model for the JWST,”
Proc. SPIE, 7738
(2010). http://dx.doi.org/10.1117/12.858349 PSISDG 0277-786X Google Scholar
T. Whitmanet al.,
“Non-invasive optical end-to-end test of a large TMA telescope (JWST) from the intermediate focus,”
Proc. SPIE, 7436
(2009). http://dx.doi.org/10.1117/12.826493 PSISDG 0277-786X Google Scholar
S. Evans,
“Natural environment near the Sun/Earth–Moon L2 libration point,”
JWST Project Report, NASA/Marshall Space Flight Center, 18
(2000). Google Scholar
L. Cohen,
“Micro-meteoroid testing: plan & initial results,”
JWST Project Memorandum, Smithsonian Astrophysical Observatory, March, 8
(2002). Google Scholar
C. Perrygo,
“Calculation of primary mirror surface area damaged by micrometeoroid impacts,”
MEMORANDUM, NGST, Optical Telescope Element, 19
(2002). Google Scholar
J. B. Heaney,
“Hypervelocity particle impact studies performed on a gold-coated beryllium substrate mirror,”
Proc. SPIE, 5487 1100
–1110
(2004). http://dx.doi.org/10.1117/12.552236 PSISDG 0277-786X Google Scholar
Z. WeiP. A. Lightsey,
“Stray light from galactic sky and zodiacal light for JWST,”
Proc. SPIE, 6265
(2006). http://dx.doi.org/10.1117/12.672287 PSISDG 0277-786X Google Scholar
P. A. LightseyZ. Wei,
“James Webb Space Telescope observatory stray light performance,”
Proc. SPIE, 6265
(2006). http://dx.doi.org/10.1117/12.672102 PSISDG 0277-786X Google Scholar
Biography Paul A. Lightsey has over 40 years of experience in physics, mathematics, and engineering, much in the area of optical systems analysis and design. He has worked on JWST since 1997 and is currently the chief engineer for the James Webb Space Telescope program at Ball, and the optical thread lead for the combined Northrop Grumman/Ball/ITT/ATK system engineering team. He has contributed to all phases of development from new business through design, fabrication, alignment, test, calibration, and on-orbit operations while at Ball. He worked on several of the Hubble Space Telescope (HST) instruments built by Ball and before that, the Relay Mirror Experiment (RME) and the Retroreflector Assisted Imaging Laser Experiment (RAILE). He received his BS in physics from Colorado State University in 1966, and his doctorate in physics from Cornell University in 1972. He has received the William H. Follett, Jr. Award for Excellence in System Engineering at Ball, and the Distinguished Public Service Medal from NASA.  Charlie Atkinson is the deputy telescope manager and manager of the East Coast Office for the James Webb Space Telescope with Northrop Grumman Aerospace Systems, having worked on the program since its inception. Among other duties, he helped orchestrate the technology demonstrations for the large, cryogenic, deployable, stable structure necessary to meet JWST’s demanding science requirements. Before joining Northrop Grumman, he worked at Kodak in Rochester, NY on several programs including the Chandra X-Ray Telescope, launched in 1999. He was the operations manager for the high-resolution mirror assembly, responsible for the integration and alignment of the grazing incidence cylindrical mirrors that serve to form the x-ray images, and managed the telescope integration and test activities. He received his bachelor’s degree in physics, math, and geophysics from Washington and Lee University in Lexington, VA, where he currently serves as a member of the Science Advisory Board. He has one patent on a telescope system using a discontinuous pupil corrector and has written numerous papers on the Chandra and James Webb Space Telescopes.  Mark Clampin is currently the JWST Observatory project scientist at GSFC. He was a coinvestigator on the Attitude Control System (ACS) science team, where he served as the ACS detector scientist with responsibility for delivery of the ACS flight focal planes. Previously, he was a scientist at STScI, where he gained 10 years experience with HST servicing missions, instrument commissioning, and science operations at STScI. He served as manager of the ACS instrument group at STScI from inception through the successful completion of the SM3B servicing mission, orbital verification, and start of science operations. He is the principal investigator of the Exosolar Planetary Imaging Coronagraph (EPIC), a technology demonstration for exoplanet missions (TDEM). His science interests lie in the study of the formation and evolution of planetary systems, and he is a member of the team that discovered the exoplanet Fomalhaut-B using the ACS on the Hubble Space Telescope.  Lee D. Feinberg is the NASA optical telescope element manager for the James Webb Space Telescope and the chief large-optics systems engineer in the Instrument Systems and Technology Directorate at the Goddard Space Flight Center in Greenbelt, Maryland. Lee is an SPIE fellow and spent a decade working on the optical correction and instruments for the Hubble Space Telescope. In 1998, Lee received an MS in applied physics from Johns Hopkins University and in 1987 graduated with a BS in optics from the University of Rochester. |
||||||||||||||||||||||||||||||||||||||||||||||||||||||||||||||||||||||||||||||||||||||||||||||||||||||||||||||||||||||||||||||||||||||||||||||||||||||||||||||||||||||||||||||||||||||||||||||||||||||||||||||||||||||||||||||||||||||||||||||||||||||||||||||||||||||||||||||||||||||||||||||||||||||||||||||||||||||||