|
|
1.IntroductionOver the past few decades, global warming has become the most pressing environmental problem the world is facing. Although there are various causes of global warming, it is an undeniable fact that the explosive growth in the use of fossil fuels such as petroleum, coal, and natural gas is the major cause of global warming. The world is currently experiencing various natural disasters such as storms, wildfires, droughts, floods, landslides, and tsunamis due to the effects of global warming. According to a report from the Asian Disaster Reduction Center,1 on average, more than 200 million people have been affected by natural disasters every year for the past two decades. For example, a mudslide triggered by heavy rains buried an entire village in the Philippine province of Southern Leyte in February 2006. More than 200 people were killed in the slide with about 1500 people missing. In addition, a strong undersea earthquake, which had a 7.7 magnitude, struck Java Island off the southern coast of Indonesia in July 2006 which triggered a tsunami that swept away wooden buildings and killed at least 500 people. As we have seen from this report, natural disasters have caused huge losses of both life and property. Therefore, when disaster threatens, an early warning of disaster is crucial to reduce the potentially extensive casualties and property damage. To forecast and prevent the damage caused by natural disasters, the development of systems to analyze natural disasters using remote sensing and geographic information systems, GISs, has been receiving widespread interest over the last decade. Most current natural disaster warning systems are based on remote sensors that depend on certain characteristics of natural disasters. These systems can be categorized into the following types:
However, these conventional, remote sensor–based warning systems have the following common disadvantages:
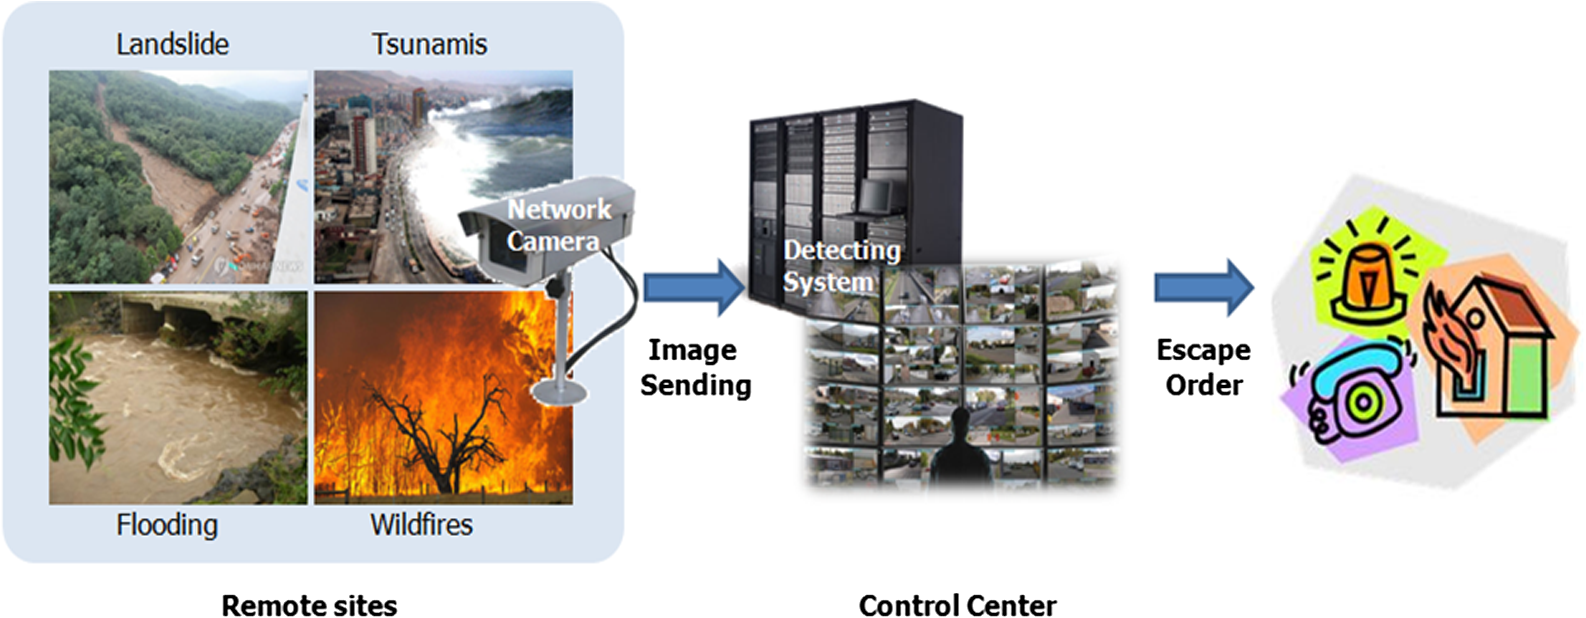
To solve these problems, many current research projects are trying to develop warning systems using vision sensors such as CCD cameras, infrared cameras, and thermal cameras. Unlike conventional remote sensors, vision sensor based disaster warning systems involve a lower equipment cost as they use surveillance cameras that are already installed in many public places. In addition, vision sensors can monitor a larger area because the camera functions as a volume sensor rather than as a traditional point sensor. Moreover, these cameras can easily be used to gather additional information such as the location, size, and degree of disaster, because the system manager can check the surveillance monitor without visiting the location.10 As shown in Fig. 1, vision sensors are installed at remote sites and transfer image sequences to a monitoring server using wired or wireless network. If an emergency situation is detected, the warning system sounds an alarm and sends image sequences of the remote site to the control center for a visual check of whether it is an actual emergency or not. Because natural disaster warnings are receiving more and more attention in recent research, a comprehensive review of various disaster warning techniques which have been developed in recent years is needed. This paper surveys recent studies on warning techniques for four types of natural disasters including wildfire detection and smoke detection, water level detection for flood warning, landslide detection, and coastal zone monitoring for tidal wave alerts, using computer vision and pattern recognition techniques. However, vision based disaster detection is a new research field with relatively few published reports, hence, we introduce a few representative works on the subject of disaster detection. Table 1 summarizes the representative categories of natural disaster warning systems based on visual sensors and their main algorithms. Table 1Representative categories of natural disaster warning systems and their main algorithms.
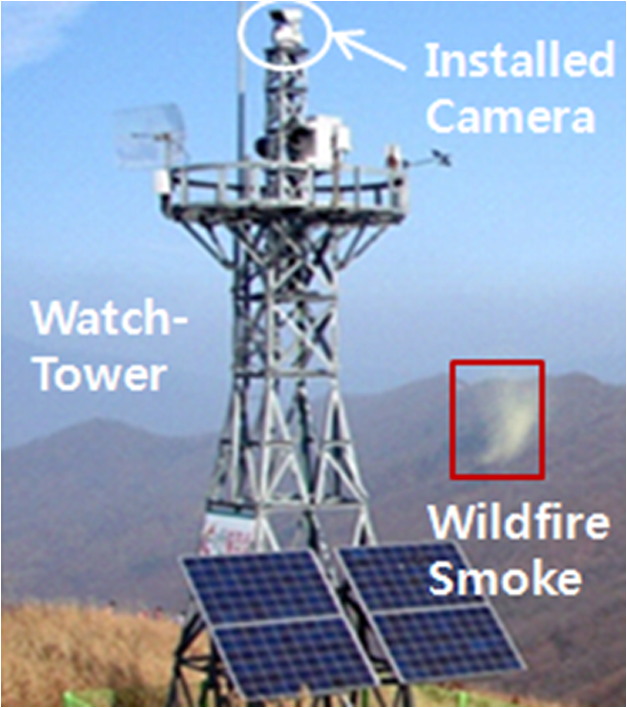
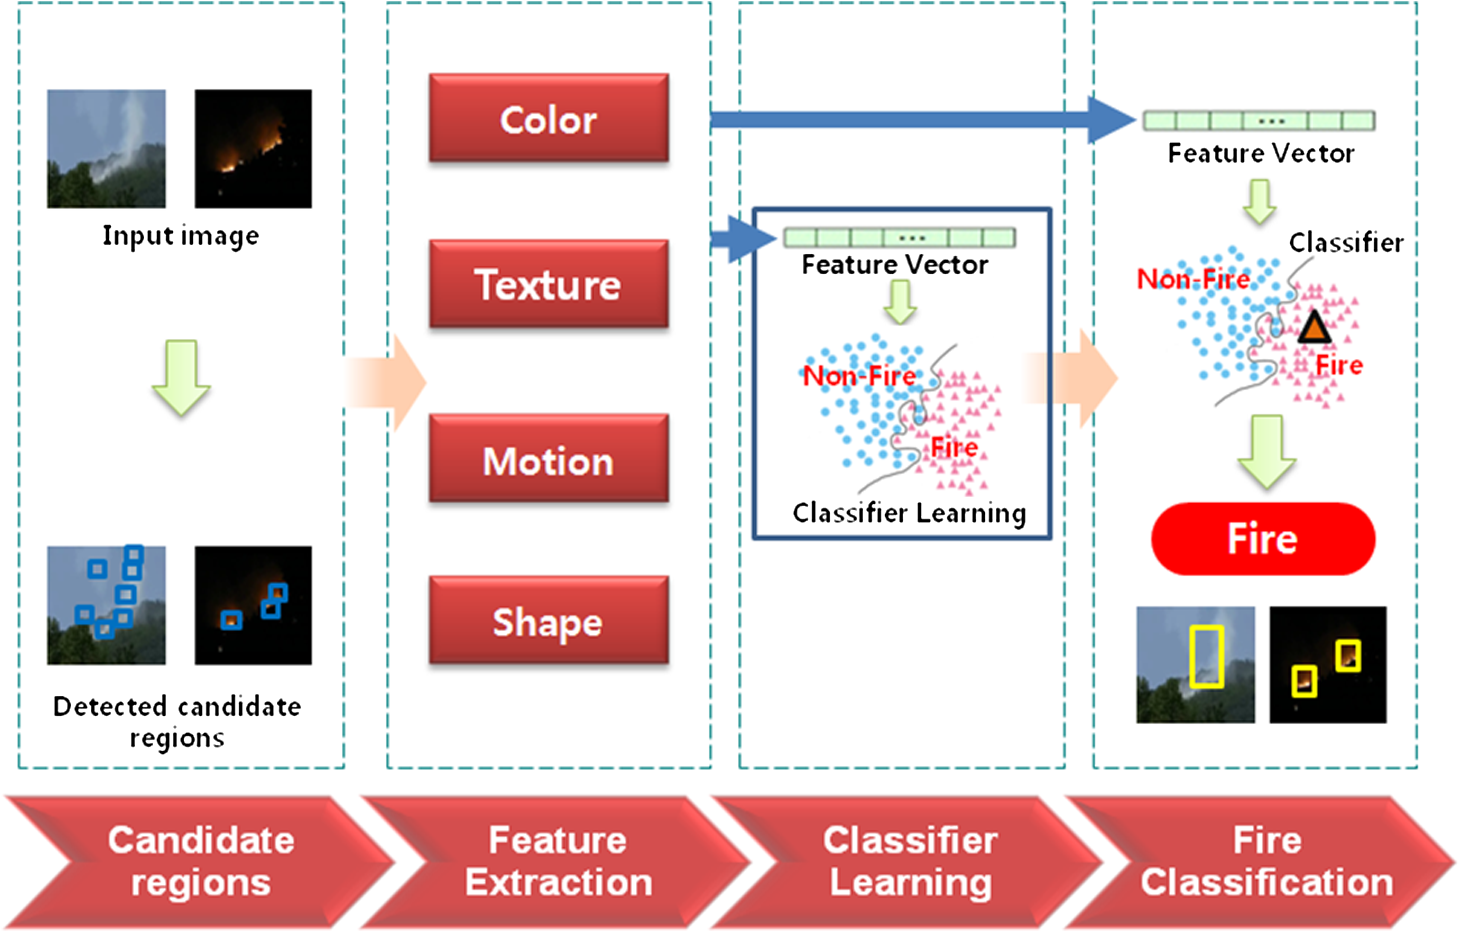
In the following sections, we discuss each of the disaster warning techniques listed in Table 1. In our previous short survey,35 some representative studies for detecting natural disasters using computer vision are introduced. However, for a more in depth survey, we added sensor based disaster detection methods and analyzed the advantages and disadvantages between sensor and vision-based disaster detection methods. Furthermore, we added not only further current research on disaster detection, but also addressed landslide detection based on computer vision, which is another issue of interest. The remainder of this paper is organized as follows. Section 2 introduces vision based wildfire smoke and flame detection techniques. The water level detection method for preventing floods is then introduced in Sec. 3. Section 4 introduces representative methods for coastal zone management as well as forecasting tidal waves. The landslide detection method is also introduced in Sec. 5. Finally, some promising future research directions are outlined in Sec. 6. 2.Wildfire Smoke and Flame Detection TechniquesEven though there are several optical-based sensors to detect wildfire smoke, these optical-based systems often generate many false alarms due to atmospheric conditions such as clouds, shadows, dust particle formations, and light reflections. Additionally, they are expensive. In contrast, a CCD camera delivers similar performance and is much cheaper than IR cameras and other types of advanced sensors. In general, a CCD camera for wildfire detection can be installed atop a mountain to monitor a wide area, as shown in Fig. 2. Wildfire detection can be divided into two research categories, wildfire smoke detection and flame detection. Smoke detection is particularly important for early warning systems because smoke usually occurs before the flames arise.11 Most current wildfire detection systems consist of four steps. The steps include detection of candidate fire regions, feature extraction, a learning classifier, and the classification of fire regions, as shown in Fig. 3. In the first step, the candidate flame or smoke regions are initially detected using a background subtraction method, while nonflame or nonsmoke colored blocks are filtered out using the color probability models. These processes are essential steps for reducing the computational time required for flame or smoke verification. Next, various parameters can be used to characterize the images for classification such as color, texture, motion and shape. After feature extraction, pattern classifier learning is performed based on the feature vectors of the training data. Finally, the candidate flame or smoke regions are classified into predefined classes using the pattern classifiers. 2.1.Wildfire Smoke DetectionDespite the significance of smoke detection, there have only been a few studies in this area. Wildfire smoke detection, using video cameras, is challenging because the main characteristics of smoke are constantly uncertain, vague patterns of shape and color. The main smoke detection methods can be summarized as follows. Gubbi et al.15 proposed an outdoor smoke detection approach based on wavelets and support vector machines (SVMs). Smoke characterization is carried out by extracting wavelet features from approximate coefficients and three levels of detailed coefficients. The SVM Light implementation for SVM was used in all the experiments. The radial basis function (RBF) kernel is used to map the input vector to a high-dimensional feature space because SVM Eq. (1): where is the input vector and is the input pattern. The symbol, , represents a parameter, specified by the user, which determines the width of the effective basis function.Ham et al.12 proposed a new forest smoke detection approach of analyzing temporal patterns of smoke and fuzzy finite automata (FFA), as shown in Fig. 4. To consider the smoke characteristics over time, the temporal patterns of intensity entropy, wavelet energy, and motion orientation have been used to generate multivariate probability density functions which are applied to FFA for smoke verification. The proposed FFA consists of a set of fuzzy states which are , , and , and a transition mapping that describes the events that can occur in a specific state and the resulting new state. Fig. 4FFA for forest fire smoke verification. The circular nodes represent a specific state, while the transition from the current state to the next state is shown by an arrow with an input event, taken from Ref. 12. 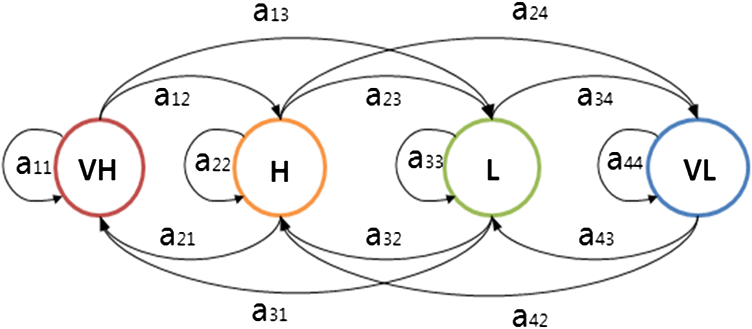 Habiboglu et al.13 proposed a method that uses background subtraction and color thresholds to find the smoke-colored, slow-moving regions in the video. These regions are divided into spatio-temporal blocks and correlation features are extracted from the blocks. Sets of properties that represent both the spatial and the temporal characteristics of smoke regions are used to form correlation descriptors. An SVM classifier is trained and tested with descriptors obtained from video data containing smoke and smoke-colored objects. In the final step of this smoke detection procedure, a confidence value is determined according to the number of positively classified video blocks and their positions. If no neighbor blocks can be classified as smoke, the confidence level is set to 1. If a single neighbor block is classified as smoke, the confidence level is set to 2. If neighbor blocks are classified as smoke, the confidence level of that block is set to 3, which is the highest level of confidence provided by the algorithm. Ko et al.11 proposed a wildfire smoke detection algorithm that uses temporal-spatial visual features and an ensemble of decision trees called a random forest. In order to detect wildfire smoke using a video camera, temporal-spatial characteristics such as color, wavelet coefficients, motion orientation, and a histogram of oriented gradients are extracted from candidate smoke blocks and the corresponding sections of the preceding 100 frames. After training two random forests, the test candidate blocks are applied to the trained random forests. The final distribution of the th class, , is generated by averaging each distribution of random forest 1 and random forest 2 using Eq. (2). In Eq. (2), is the number of trees, and is the distribution of -th tree. This system chooses as the final class of an input block , if has the maximum value. According to Eq. (2), the candidate block is declared as a real wildfire smoke block if the maximum probability of the average probability distribution in an input block belongs to the class VH or . Otherwise, a candidate block is declared as a nonsmoke block.Figure 5 shows nine examples of wildfire smoke detection results on real wildfire smoke and smoke-colored clouds and fog. Fig. 5Wildfire smoke detection results on wildfire smoke (Movies 1–5), smoke-colored cloud (Movies 6, 7, and 9) and fog (Movie 8) test videos, taken from Ref. 11. 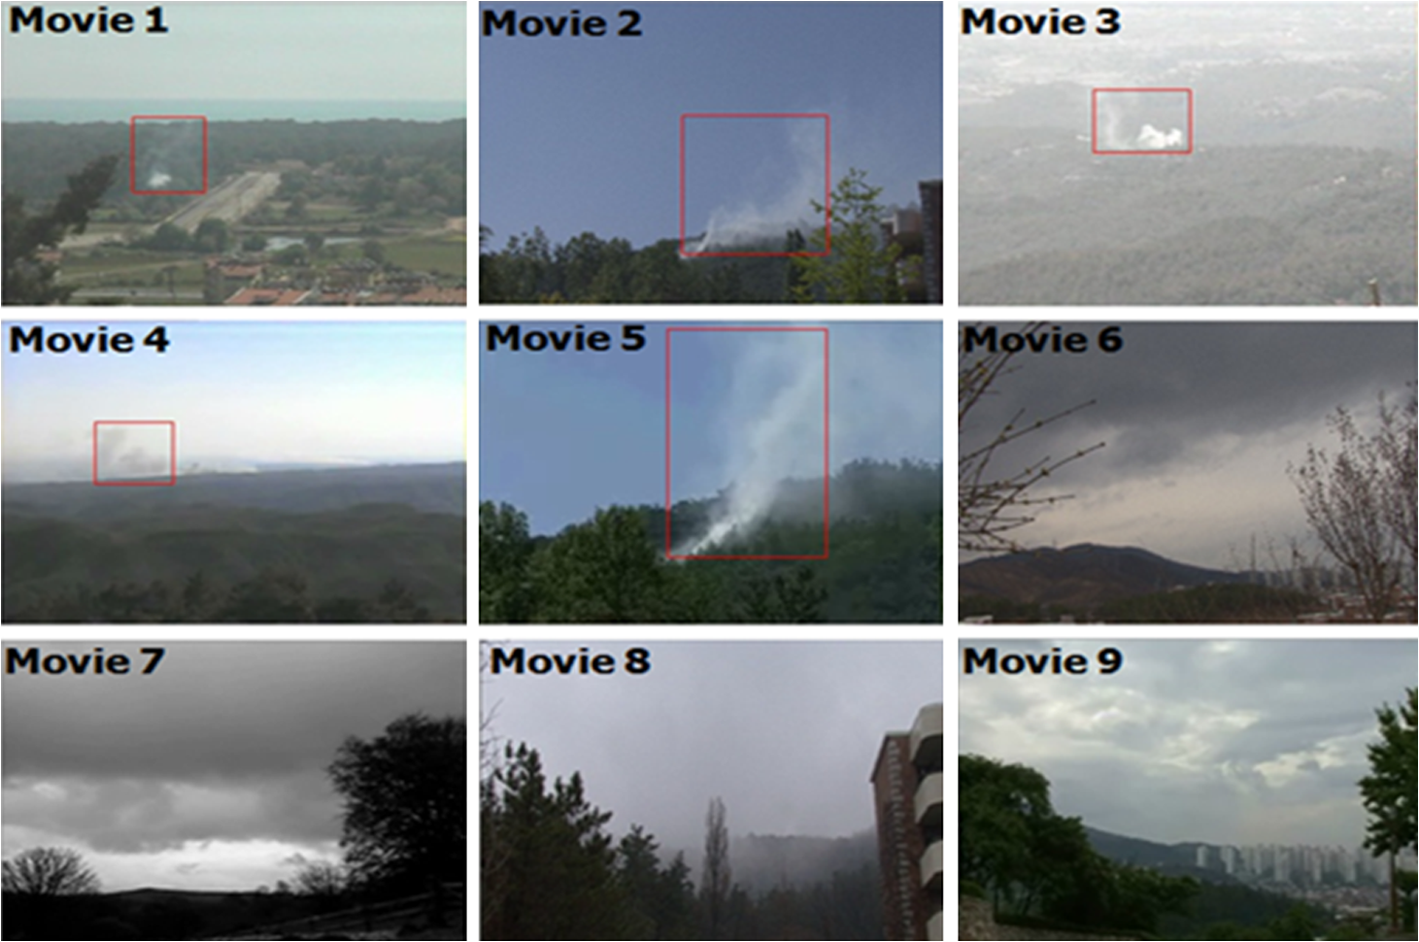 Töreyin et al.14 also proposed an automatic, video-based, wildfire smoke detection algorithm containing the following four sub-algorithms: (1) slow-moving video object detection, (2) gray region detection, (3) rising object detection, and (4) shadow elimination. Each sub-algorithm individually detects the presence of smoke in the viewing range of the camera before the decisions of the sub-algorithms are combined by an adaptive weighted majority algorithm. The weights of compound algorithms are re-estimated using an error function in the least mean square algorithm, which is based on the decision of an oracle “security guard” whenever a false alarm occurs. Guillemant and Vicente16 proposed smoke identification method using a cumulative analysis of the instantaneous motion data. They found that the most efficient data for smoke identification are the velocity distribution in the envelope, whose energy, or average number of instantaneous motion diagnoses per embedded point, is higher than the energy of most other landscape phenomena with the exception of clouds. But for clouds, the standard deviation of velocity distribution is generally lower than for smoke. Thus, their main criterion for smoke detection is based on the analysis of the velocity distribution using a minimum energy threshold and a minimum standard-deviation threshold. 2.2.Wildfire Flame DetectionRegions of flame indoors generally produce higher luminance and frequency than background regions, as well as an upward motion with irregular fluctuation patterns in the time domain.9,10 In contrast, wildfire has different characteristics from indoor and close-range fires.14
Similar to the method in Ref. 14, the algorithm proposed by Gunay et al.17 was comprised of four sub-algorithms: (1) slow-moving video object detection, (2) bright region detection, (3) detection of objects exhibiting periodic motion, and (4) a sub-algorithm interpreting the motion of moving regions in video. Each of these sub-algorithms characterizes an aspect of fire captured at night by a visible-range PTZ camera. The decision functions of sub-algorithms yield their own decisions as confidence values in the range . Sub-algorithm weights are updated according to the least mean square algorithm, which is the most widely used adaptive filtering method. The final classification result, , is combined linearly with the decision values from the four sub-algorithms and their weights in the following manner. Equation (3): where is the vector of the confidence values of the sub-algorithms for the pixel at location of the input image frame at time step , and is the current weight vector.Figure 6 shows three examples of wildfire flame detection results at night. Fig. 6Three examples of wildfire flame detection at night: (a) correct alarm for a fire at night, (b) elimination of fire-truck head lights (upper left) and correct alarm for a fire (lower right), and (d) detection results on an actual forest fire at night, taken from Ref. 17. 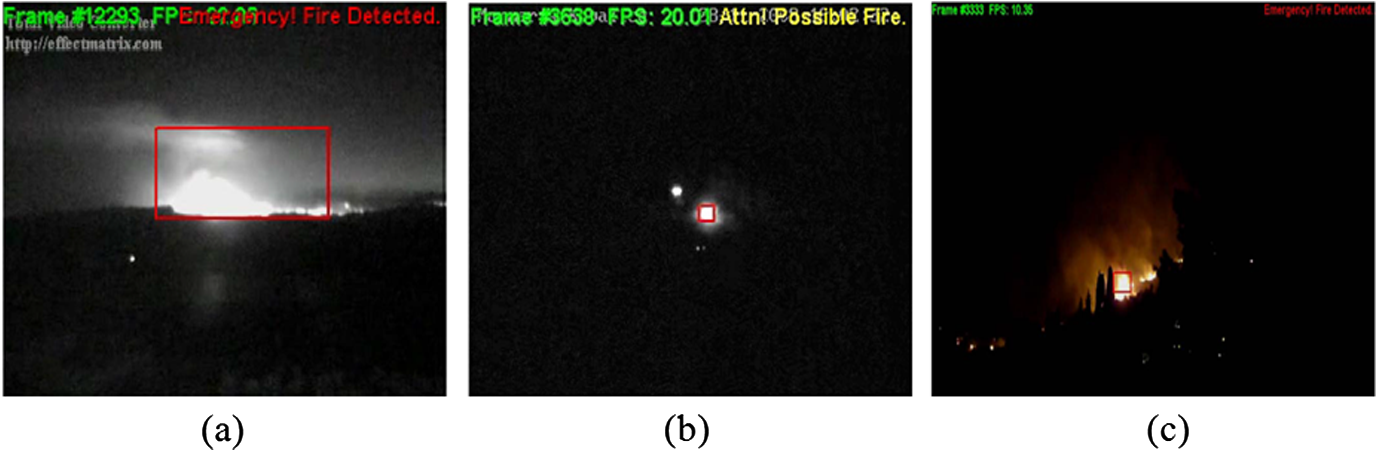 Ko et al.10 proposed a flame detection method using FFA, which was similar to the method in Ref. 11, with probability density functions based on visual features, thereby providing a systemic approach to handling irregularity in computational systems and the ability to handle continuous spaces by combining the capabilities of automata with fuzzy logic. In general, flame regions have a continuous irregular pattern, therefore, probability density functions are generated for the variation in intensity, wavelet energy, and motion orientation, as shown in Fig. 7, and applied to the FFA. The proposed algorithm has been successfully applied to various fire/nonfire videos, including indoor fires and wildfires taking place during both day and night. Fig. 7Two-dimensional probability density graph of the intensity, wavelet energy, and motion orientation. VH is very high, is high, is low and VL is very low, taken from Ref. 10. 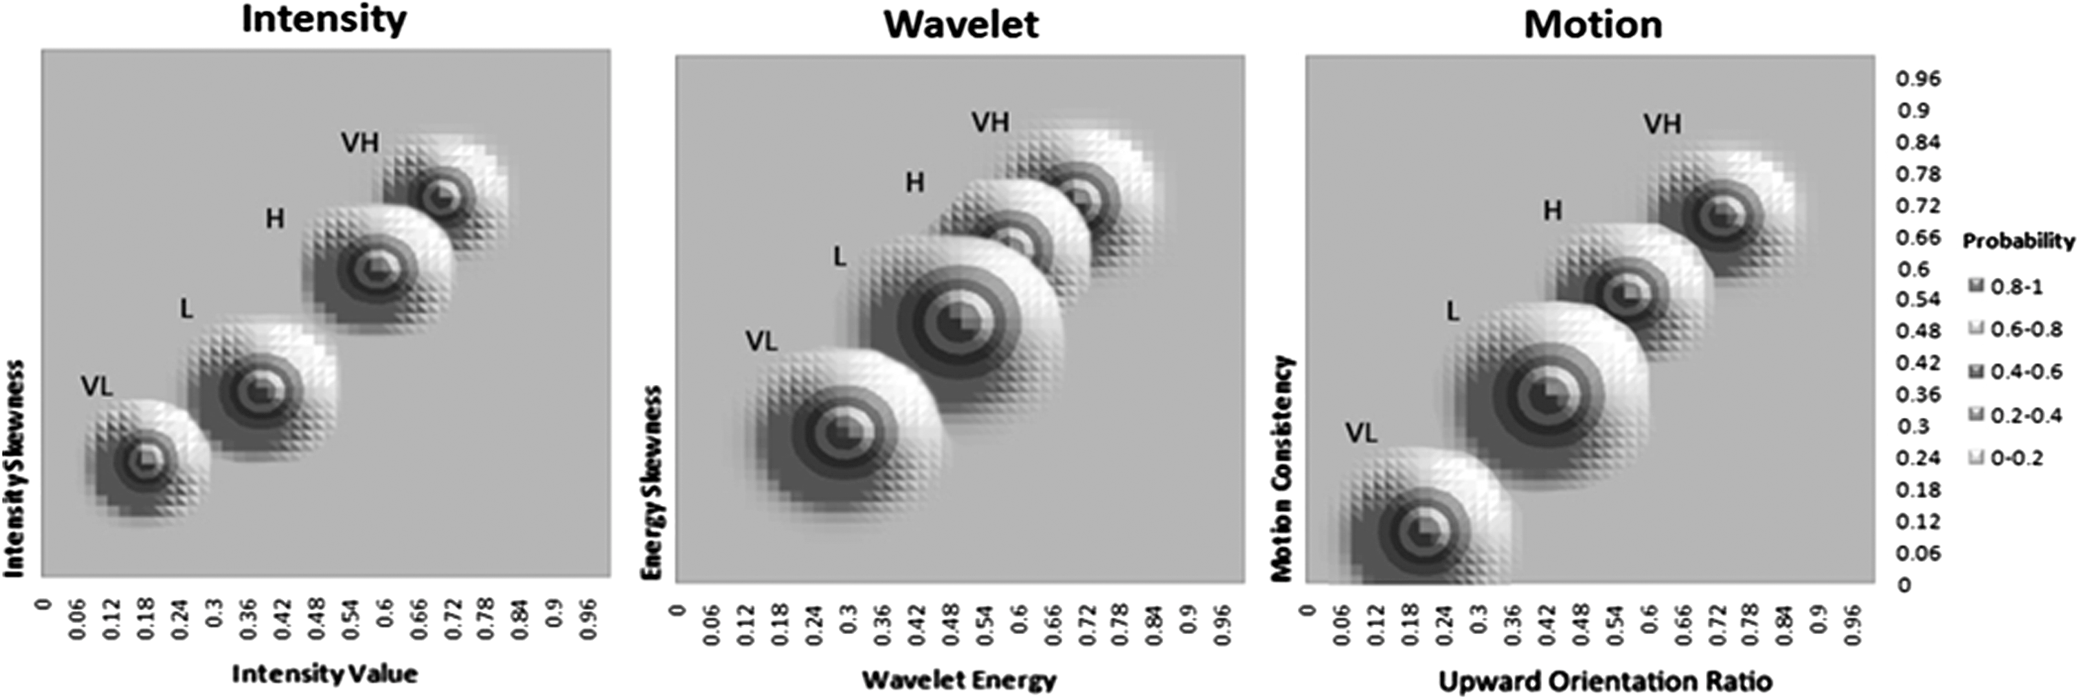 Celik et al.18 used color features and fuzzy logic to detect wildfire flame. Fuzzy logic was used to replace the heuristic rules and make the classification more robust when effectively discriminating fire and fire-like colored objects. To detect the fire region, the proposed method, measured to determine the likelihood that a pixel located at a spatial location belonged to a fire pixel in the YCbCr color image. To evaluate , a combination of triangular and trapezoidal fuzzy logic membership functions were used to represent the difference between and and the difference between and . In contrast to wildfire flame detection systems based on CCD cameras, some researchers19,20 have tried to analyze the heat of wildfires using infrared images or visible light images to compensate for the limitations of CCD cameras. 3.Water-Level Detection for Preventing FloodsAs mentioned in the introduction, a lot of work using conventional sensors has been conducted in an effort to forecast the degree of flooding of rivers. Although a pressure sensor is easy to use, it is limited because it must be calibrated and replaced frequently due to possible breakdowns stemming from continuous water pressure. In addition, the sonar sensor does not make contact with the water directly, its lifespan is short, and the returning sonic values are sensitive to the temperature, rain, and snow. Therefore, use of an image sensor to measure the water level is the most recent approach.5 Initial research on water level detection21,22,24 used spatial information derived from image sensors, such as edge direction. Comparatively, new water level detection techniques5,23 exploit the temporal motion information embedded in a sequence to overcome the misdetection problem due to wrong edge detection. A simplified spatiotemporal water level detection system is shown in Fig. 8. In the first step, the image noise produced by dust on the camera lens, rain, or snow is removed by a smoothing filter. After the spatiotemporal features have been estimated, each spatiotemporal feature is projected onto the -axis to create a cumulative histogram. During the final step, the water level decision is made using a decision function and the projected features. Udomsiri and Iwahashi21 proposed a new design of a spatial finite impulse response (FIR), filter to automatically detect the water level from a video signal of various river surroundings. This approach employed the addition of frames and a horizontal edge detector to distinguish water regions and land regions. An example of a filtered signal is shown in Fig. 9(c), which uses a three-tap bandpass filter as an edge operator. In this case, the variance of each horizontal line is used as the feature value shown in Fig. 9(d). Thus, the variance of each line in a filtered video frame is used as a feature value. The water level is recognized as the horizontal boundary line between the land and water regions. The feature values in the land region and those in the water region are calculated by setting a temporary boundary. Similarly, the mean values, and , are calculated for the land region and water region, as well as their variances and . Based on these values, the ratio defined by Eq. (4), is calculated to determine whether the boundary is correct. and denote the probability that pixels belong to the land class or water class, respectively. An appropriate water boundary is considered to be the point that maximizes the distance between the numerators and minimizes the denominator. Figure 9 shows the water level detection procedure using the spatial FIR filter.Fig. 9Water level detection procedure: (a) input frame, (b) average of frames, (c) filtered image using a three-tap bandpass filter, and (d) the detected water level, taken from Ref. 21. 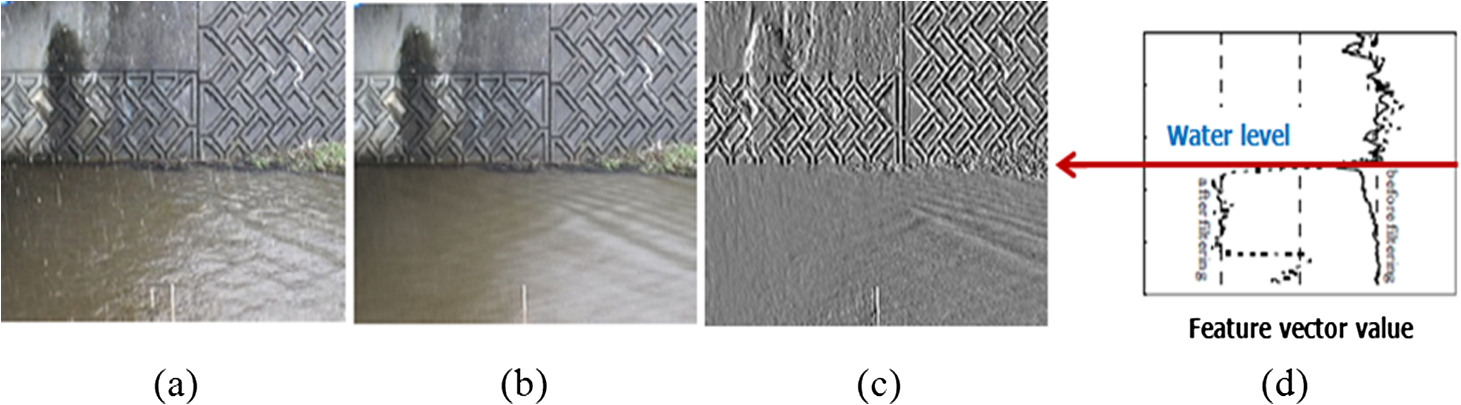 Park et al.22 introduced a cumulative histogram that emphasized the change of the water surface in sequential images. The histogram showed the cumulative differences between previous images and the current image. However, these differences also appeared in the land region, hence, a bandpass filter was used to remove noise in the cumulative histogram. Finally, this algorithm separated the water and land regions using predefined rules. Figure 10 shows the cumulative histograms and the corresponding pulse histograms for three different situations: calm, night, and day. In a similar method to Park et al.,22 Yu and Hahn5 measured the water level from images received by the master system which may contain noise caused by various sources. An averaging filter and Gaussian filter were used to reduce the noise. The horizontal edge image was extracted using a Sobel operator and the position of the longest horizontal line in the bridge support column was found by projecting the edge image onto the -axis as shown in Fig. 11. The water level is calculated by measuring the gap, , between the reference indicator, , and the water limit, . Fig. 10Cumulative histograms and the corresponding pulse histograms for three different situations: a: calm, b: night, c: day, taken from Ref. 22. 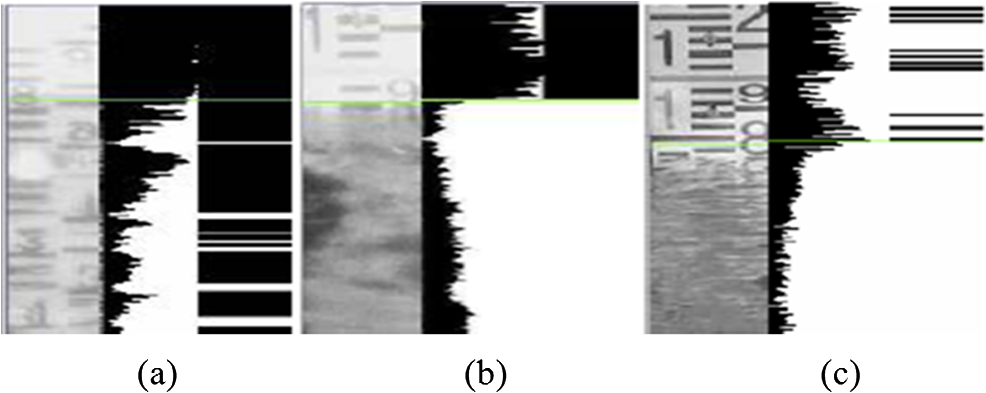 Fig. 11-axis profile for detecting the water limit: (a) the input frame ‘’ signboard is the reference indicator, (b) Gaussian filtered image, (c) horizontal edge image, and (d) -axis profile, taken from Ref. 5. 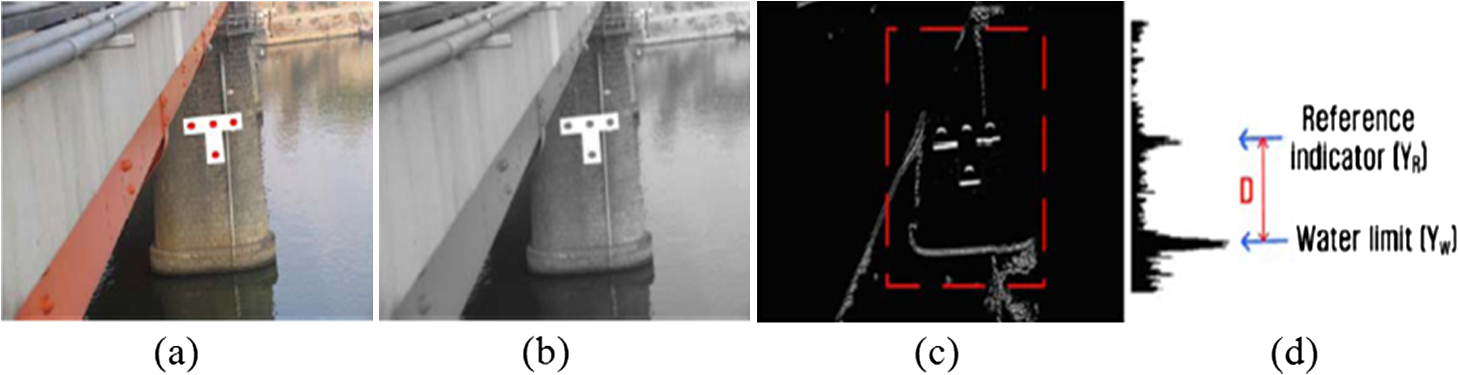 Kwak et al.23 proposed a new automatic water-level detection algorithm for flood prevention with the use of a CCD camera and -means clustering. The captured input video of the river displays the column of a bridge and flowing water. In contrast to the static column region, the water region exhibits slow and fast movement, according to the speed of the water. Using this fact, optical flows are detected using image sequences and a motion vector that is projected onto the -axis to create an accumulated motion histogram. From the accumulated motion histogram, a -means clustering algorithm is executed to distinguish the real water region from the concrete column region, as shown in Fig. 12. Fig. 12Examples of water-level detection: (a) detected optical flows of flowing water, (b) -means clustered result of accumulated motion histogram, taken from Ref. 23. 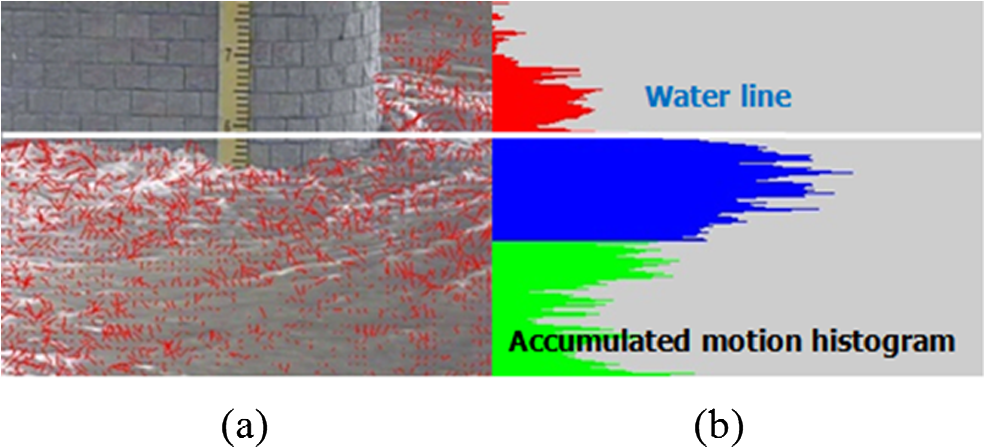 Chapman24 proposed a line-based, edge detection algorithm to find the water edge in a tube, as shown in Fig. 13. A series of vertical lines were evaluated within the tube to determine the position of the water's edge. The edge point positions were defined by their pixel row and column positions within the image. The equation for the water line was calculated by a linear regression fit to the edge points. The final step in the process was to convert the position of the line from the measurement system used in images, pixel units, to real-world measurement units, feet/meters. Fig. 13Example of water level (blue line) detection at night under infrared light, taken from Ref. 24. 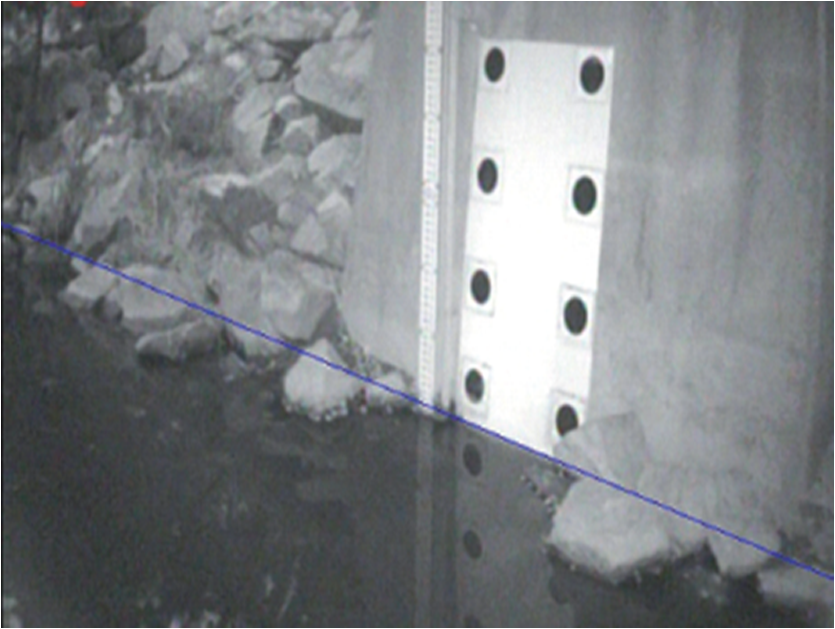 4.Coastal Zone Management and Detecting Tidal WavesMonitoring shorelines, or changes over time, and tidal waves caused by earthquake or typhoon, are core tasks carried out by coastal engineers for a wide range of research, monitoring, and design applications such as identifying and quantifying shoreline erosion and assessing the performance of coastal protection structures.36 First, to monitor the coastal zone, a conventional surveying method is the use of satellite and aircraft-mounted remote sensing systems such as light detection and ranging (LiDAR). However, these systems are generally limited to use on clear water in order to obtain improved spatial coverage, and the data that they obtain are expensive to manage from the viewpoint of long-term monitoring.25 Fixed video remote sensing systems provide continuous daylight data for periods extending over decades and they are relatively low-cost as compared to other airborne or satellite remote-sensing options. Temporal pixel difference on the shoreline is one of the most widely used shoreline detection techniques. As shown in Fig. 14, a panoramic view of the entire coastal embayment is acquired automatically from several cameras with repeated mapping of shorelines from time exposure images of different, tidal, water levels. Image analysis techniques, such as region grouping and morphological operation, and decision functions are then applied to the difference image to determine the shoreline position along the shore. Fig. 14General procedure for shoreline detection.27–36 Images acquired from multiple cameras are used to obtain (a) a panoramic view of the entire coastal embayment, (b) rectification of this merged image to produce real-world coordinates allows the resulting aerial view image to be processed using sophisticated image analysis techniques to determine the exact shoreline position on the shore, marked with a black dashed line in (c). 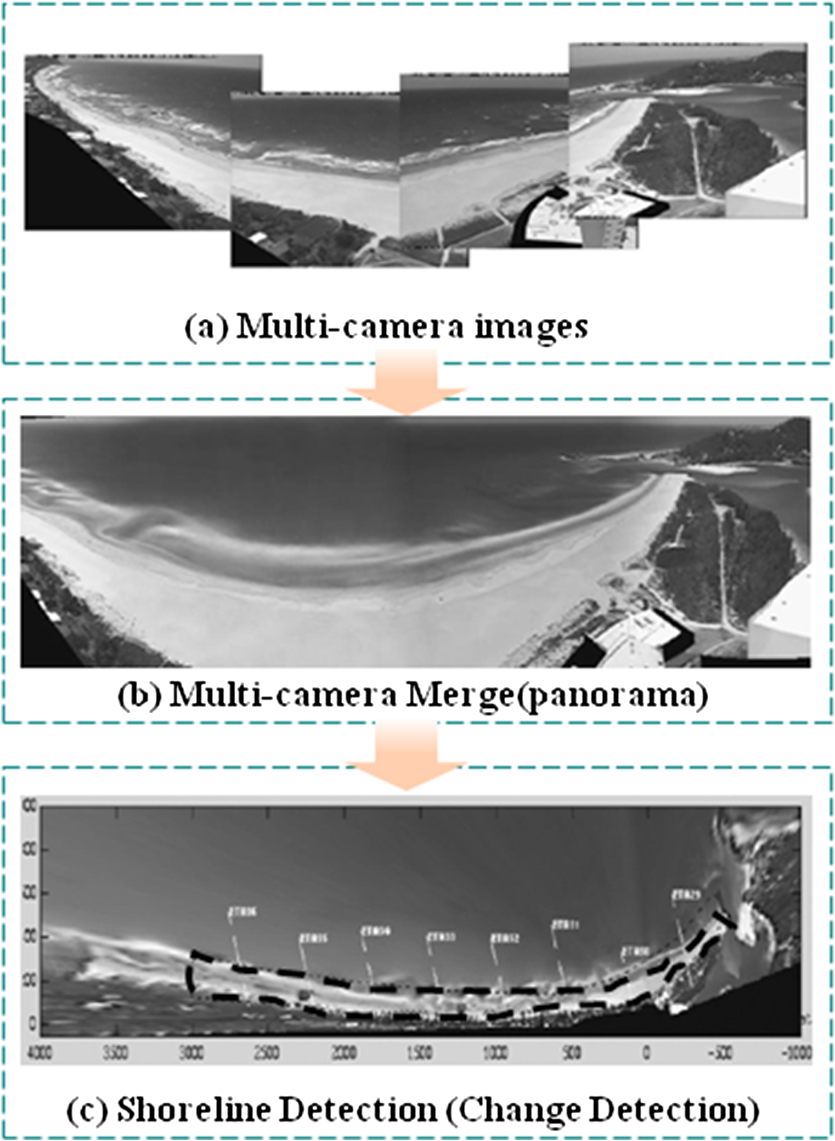 The CoastView project,25 www.TheCoastViewProject.net, aimed to develop coastal video monitoring systems in support of coastal zone management. The project utilizes Argus video systems that are capable of remotely sensing waves, currents, and beach elevation at high frequency over a scale of several kilometers. The CoastView project is a €2M European project involving 12 partner institutions from six countries, including four national-scale coastal managers from Spain, Italy, the Netherlands, and the UK. Turner and Anderson26 introduced experience from Australia, using a network of Argus coastal imaging sites, to illustrate and discuss the suite of image-derived, coastal zone, management products, that is now available to the coastal manager. Both qualitative and quantitative information is routinely delivered, via the Internet, ranging from hourly images of the monitored site to weekly summaries of shoreline variability and longer-term beach-width trends. All monitoring program results and data summaries are accessed via a World Wide Web interface, providing real-time delivery direct to the managers’ desktop computers. Uunk et al.27 presented a fully automated procedure to derive the intertidal beach bathymetry on a daily basis, from video images of low-sloping beaches that are characterized by the intermittent emergence of intertidal bars. Bathymetry data is obtained by automated and repeated mapping of shorelines from time exposure images for different tidal water levels. The developed procedure handles intelligent selection of a shoreline search area and unsupervised quality control of the obtained bathymetry data. Second, unlike coastal zone management, detection of an overtopping wave, or a high wave, caused by tidal waves or tsunamis, is also an important issue to address in order to prevent natural disaster damage. Ishimoto et al.28 proposed an automated wave overtopping detection system using image processing. This system automatically detects the optional size of overtopping waves in a video camera scene. One to four continuous, optional, time-interval, still pictures are transmitted immediately after capturing wave overtopping, including just before capture. The optimal time interval after capturing wave overtopping allows this system to detect the highest wave in still video pictures. This system allows the frequency and scale of overtopping waves to be monitored in real time, which can be used to make a decision on traffic closure. Seki et al.30 proposed an algorithm that automatically detects high waves from images captured by coastal surveillance cameras. This detection is performed directly by background subtraction and measuring wave contour in each image using active contour models from subtracted regions. The wave contour is tracked and is declared an overtopping wave if it exceeds the predefined boundary. This method measures and tracks the wave contour, hence, it is robust to other moving objects and it can be applied for the occurrence prediction of overtopping waves. In experiments using real video sequences, including the approach of a typhoon and tranquil scenes, this method was found to be 96 percent correct with 114 high waves while no misdetections occurred, even in tranquil conditions. The ITS Handbook of Japan29 contains detailed descriptions of an overtopping wave monitoring system installed on National Highway No. 42 in Japan. The accurate prediction and swift detection of overtopping waves is essential to ensure safe driving during the early stage of overtopping waves and to allow traffic restrictions to be issued without delay when overtopping becomes serious. Thus, a system is used, in this district, to automatically detect overtopping waves, similar to the method described in Ref. 28, where images captured with CCTV cameras are processed while step-type wave gauges along the highway help improve the accuracy of overtopping detection. In addition, overtopping waves are predicted using wave data obtained offshore from Nishimukai so that traffic restrictions can be issued at the proper time. An outline of the overtopping wave monitoring system installed on National Highway No. 42 in Japan is shown in Fig. 15. Fig. 15Outline of the overtopping wave monitoring system installed on National Highway No. 42 in Japan, taken from Ref. 29. 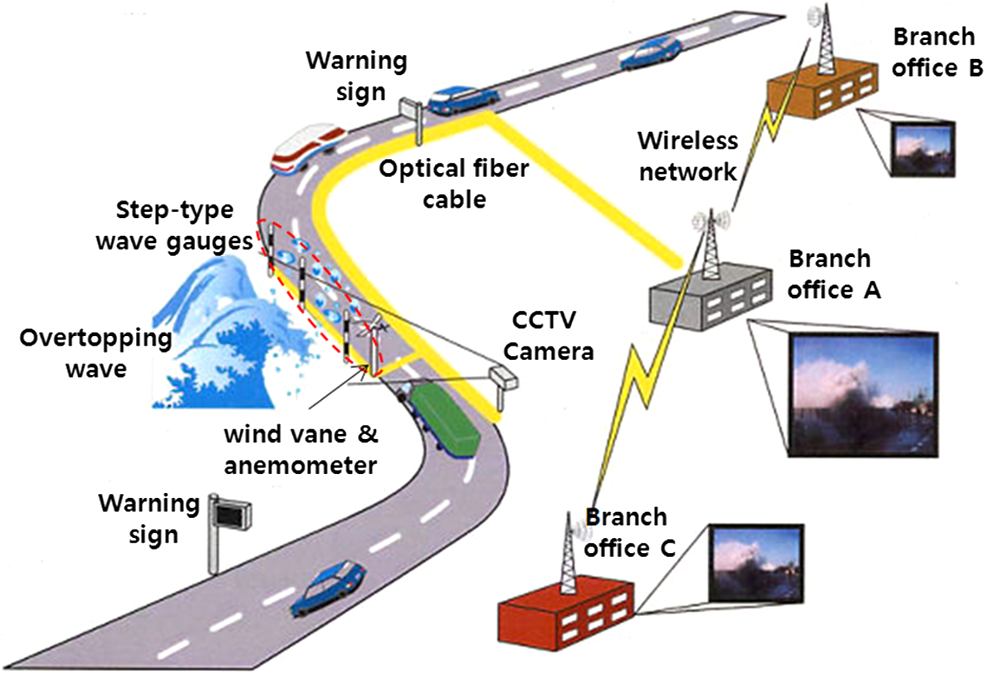 5.Landslide DetectionTraditionally landslide areas were manually measured from aerial stereo pair photography, which is a very time-consuming and tedious task. For this reason, a variety of approaches have been proposed to detect landslides automatically using LiDAR image and computer vision techniques. The most common approaches are difference region detection,31–32 comparing LiDAR images before the landslide and after the landslide, based on pixel units or region units, as shown in Fig. 16. The reference image is saved in the first step and subsequent images from the same location are obtained by automated and repeated mapping of topographical features. The modified areas are represented by thresholding based on local point similarity, while post-processing, such as connected component labeling or morphological operations, is used to detect the large connected regions. A landslide decision function is applied during the final step, along with some feature descriptors of candidate regions. Rau et al.31 proposed a pixel-based image difference method, using a logical intersection operation, to detect the main changed area based on spectral and surface characteristics, such as the terrain slope, surface texture, and greenness. Among these, greenness is an important index to discriminate the bare soil from vegetation since the greenness value changes from high to low in the landslide region. They compare the greenness index map, before and after the landslide, using a logical intersection operation to identify the change as a landslide region. Figure 17(a) shows the color ortho-images with landslide and the greenness index map as shown in Fig. 17(b). Fig. 17Examples of landslides detection: (a) color ortho-images with landslide ground truth, (b) greenness index map, taken from Ref. 31. 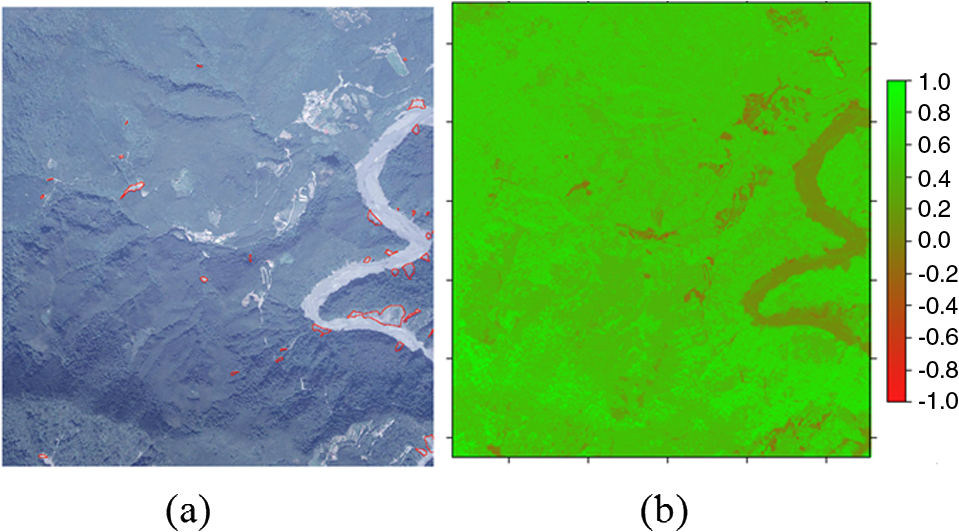 S. K. Bejo et al.33 used a point similarity measure based on mutual information to detect the most significant changed regions. The point similarities,, are defined for each pixel at coordinate : where is the normalized histogram of gray values in the reference image, is the normalized histogram of the sensed image, and is the normalized joint histogram of the gray values, and , that correspond to the same pixel . The changed areas are represented by thresholding local point similarities. Then, connected component labeling is used to detect the large connected regions, which are likely to be landslide regions. It is a very simple and fast method to detect landslides, but it cannot allow the distinction between a landslide and any other change on the surface of the earth that causes changes in the appearance of the image.Martha and Kerle34 proposed an object segmentation method to detect the difference region using multiple segmentation strategies. The segmentation method, with a single set of parameters, is not able to detect the landslide regions due to the complex shape and size of landslides. Instead of one object level pertaining to a single parameter, multiple object levels, with a set of optimum parameters, are used to detect landslides of variable sizes with high-resolution satellite images. The proposed method does not require a priori knowledge to optimize segmentation, which makes it typically suitable for a rapid response to a disastrous landslide. However, difference region detection is very sensitive to small illumination changes. In order to solve this problem, Hervas and Rosin32 combine the image differencing method and a genetic programming algorithm for landslide detection. To extract the features from the changed pixels, the difference image is computed, before and after the landslide reactivation, and mathematical morphology operations are applied. Then, genetic programming is used to distinguish the “change” and “no-change” classes in changed pixels from optical remote sensing data. 6.Conclusions and Future DirectionsThe world is currently experiencing various natural disasters such as storms, wildfires, droughts, floods, landslides, and tsunamis due to the effects of global warming. As natural disasters caused huge losses of both life and property, early warnings of disasters are crucial to reduce the potentially extensive casualties and property damage when disaster threatens. In this paper, we introduced recent developments in research on natural disaster detection with a focus on various computer vision techniques. The existing approaches were summarized for wildfire detection, water level detection, coastal zone management, and landslide detection. Despite the fact that research related to vision-based natural disaster detection is still in its preliminary stages, there has been remarkable progress. The advantages of vision-based disaster warning systems are they have a lower equipment cost, have the capacity to monitor a larger area, and provide additional information such as the location, size, and degree of disaster, without the need for visiting the location. However, there are still a few problems in the detection and accurate forecasting of natural disasters, due to the limitation of gathering information from a CCD camera. The details of these problems are as follows:
To overcome the shortcomings in related research, it is clear that further research in the areas of pre-processing for removing noises and ego-motion compensation, feature extraction, ensemble methods with other conventional sensors, classification methods, and warning representation methods are required to complete the final goal of natural disaster detection and forecasting. This review clearly shows that great advances have been made in vision-based disaster warning techniques, but many challenges still remain in achieving more accurate disaster warning techniques in diverse environments. AcknowledgmentsThis research was supported by Basic Science Research Program through the National Research Foundation of Korea(NRF) funded by the Ministry of Education, Science and Technology (2011-0007406) ReferencesK. Suzuki, Good Practices 2007 Supplement, Asian Disaster Reduction Center (ADRC), Japan
(2007). Google Scholar
B. C. KoK. H. JungJ. Y. Nam,
“Early fire detection algorithm based on irregular patterns of flames and hierarchical Bayesian Networks,”
Fire Safety J., 45
(2), 262
–270
(2010). http://dx.doi.org/10.1016/j.firesaf.2010.04.001 FSJODZ 0379-7112 Google Scholar
Wikipedia, Smoke detector,
(2011) http://en.wikipedia.org/wiki/Smoke_detector#Optical Google Scholar
J. YuH. Hahn,
“Remote detection and monitoring of a water level using narrow band channel,”
J. Inform. Sci. Eng., 26
(1), 71
–82
(2010). JINEEY Google Scholar
R. A. Lawson,
“Tsunami detection systems for international requirements,”
in Oceans,
1
–7
(2007). Google Scholar
G. M. BeltramiM. D. RisioP. D. Girolamo, The Tsunami Threat—Research and Technology, InTech open access publisher(2011). Google Scholar
K. Higuchiet al.,
“Application of new landslide monitoring technique using optical fiber sensor at Takisaka landslide,”
in 1st North American Landslide Conf.,
1
–9
(2007). Google Scholar
B. C. KoH. J. HwangJ. Y. Nam,
“Nonparametric membership functions and fuzzy logic for vision sensor-based flame detection,”
J. Opt. Eng., 49
(12), 127202
(2010). http://dx.doi.org/10.1117/1.3520069 OPENEI 0892-354X Google Scholar
B. C. KoS. J. HamJ. Y. Nam,
“Modeling and formalization of fuzzy finite automata for detection of irregular fire flames,”
IEEE Trans. Circuits Syst. Video Technol., 21
(12), 1903
–1912
(2011). http://dx.doi.org/10.1109/TCSVT.2011.2157190 Google Scholar
B. C. KoJ. Y. KwakJ. Y. Nam,
“Wildfire smoke detection using temporal-spatial features and random forest classifiers,”
Opt. Eng., 51
(1), 017208
(2012). http://dx.doi.org/10.1117/1.OE.51.1.017208 OPENEI 0892-354X Google Scholar
S. J. HamB. C. KoJ. Y. Nam,
“Vision-based forest smoke detection using analyzing of temporal patterns of smoke and their probability models,”
Proc. SPIE, 7877 78770A
(2011). http://dx.doi.org/10.1117/12.871995 Google Scholar
Y. H. HabibogluO. GunayE. Cetin,
“Real-time wildfire detection using correlation descriptors,”
in 19th European Signal Processing Conf.,
894
–898
(2011). Google Scholar
B. U. ToreyinA. E. Cetin,
“Wildfire detection using LMS based active learning,”
in Proc. IEEE Int. Conf. on Acoustics, Speech and Signal Processing,
1461
–1464
(2009). Google Scholar
J. GubbiS. MarusicaM. Palaniswamia,
“Smoke detection in video using wavelets and support vector machines,”
Fire Safety J., 44
(8), 1110
–1115
(2009). http://dx.doi.org/10.1016/j.firesaf.2009.08.003 FSJODZ 0379-7112 Google Scholar
P. GuillemantJ. Vicente,
“Real-time identification of smoke images by clustering motions on a fractal curve with a temporal embedding method,”
Opt. Eng., 40
(4), 554
–563
(2001). http://dx.doi.org/10.1117/1.1355254 OPENEI 0892-354X Google Scholar
O. Gunayet al.,
“Video based wild fire detection at night,”
Fire Safety J., 44
(6), 860
–868
(2009). http://dx.doi.org/10.1016/j.firesaf.2009.04.003 FSJODZ 0379-7112 Google Scholar
T. CelikH. OzkaramanliH. Demirel,
“Fire and smoke detection without sensors: image processing based approach,”
in European Signal Processing. Conference,
1794
–1798
(2007). Google Scholar
J. Liet al.,
“Technique for automatic forest fire surveillance using visible light image,”
in Int. Conf. Geoscience and Remote Sensing Symposium,
31
–35
(2005). Google Scholar
I. Boschet al.,
“Infrared image processing and its application to forest fire surveillance,”
in IEEE Int. Conf. on Advanced Video and Signal Based Surveillance,
283
–288
(2007). Google Scholar
S. UdomsiriM. Iwahashi,
“Design of FIR filter for water level detection,”
World Acad. Sci. Eng. Technol., 48 47
–52
(2008). Google Scholar
S. Parket al.,
“The water level detection algorithm using the accumulated histogram with band pass filter,”
Acad. Sci. Eng. Technol., 56 193
–197
(2009). Google Scholar
J. Y. KwakB. C. KoJ. Y. Nam,
“Automatic water-level detection using CCD camera and k-mean clustering,”
J. Kor. Soc. Image Sci. Technol., 17
(9), 1
–8
(2011). Google Scholar
K. W. Chapman, Camera based water level detection,
(2011). Google Scholar
H. Burcharth, Developing Coastal Video Systems in Support of Coastal Zone Management
(2005). Google Scholar
I. TurnerD. Anderson,
“Web-based and ‘real-time’ beach management system,”
Coast. Eng., 54
(6–7), 555
–565
(2007). http://dx.doi.org/10.1016/j.coastaleng.2007.01.002 COENDE 0378-3839 Google Scholar
L. UunkK. M. WijnbergR. Morelissen,
“Automated mapping of the intertidal beach bathymetry from video images,”
Coast. Eng., 57
(4), 461
–469
(2010). http://dx.doi.org/10.1016/j.coastaleng.2009.12.002 COENDE 0378-3839 Google Scholar
K. IshimotoT. ChibaY. Kajiya,
“Wave overtopping detection by imge processing,”
The second World Congress on Intelligent Transport Systems, 515
–518
(1995). Google Scholar
Overtopping Wave Monitoring system,
(2001). Google Scholar
M. SekiH. TaniguchiM. Hashimoto,
“Overtopping wave detection based on wave contour measurement,”
IEEJ Trans. Electron. Inform. Syst., 127
(4), 599
–604
(2007). http://dx.doi.org/10.1541/ieejeiss.127.599 Google Scholar
J. Y. RauY. C. ShaoL.-C. Chen,
“Landslides detection using aerial ortho-images and LiDAR data,”
in Proc. of Asian Assoc. Remote Sens.,
1
–6
(2006). Google Scholar
J. HervasP. L. Rosin,
“Image thresholding for landslide detection by genetic programming,”
in Proc. of the First International Workshop on Multitemporal Remote Sensing Images,
65
–72
(2002). Google Scholar
S. K. BejoM. PetrouA. Ganas,
“Local similarity measure for landslide detection and identification in comparison with the image differencing method,”
Int. J. Remote Sensing, 31
(23), 6033
–6045
(2010). http://dx.doi.org/10.1080/01431160903376365 IJSEDK 0143-1161 Google Scholar
T. R. MarthaN. Kerle,
“Segment optimisation for object-based landslide detection,”
Int. Arch. Photogramm. Remote Sens. Spatial Inform. Sci., XXXVIII-4/C7
(1), 1
–6
(2010). Google Scholar
B. C. Koet al.,
“Current trend in natural disaster warning systems based on computer vision techniques,”
in First Asian Conf. on Pattern Recognition,
1
–5
(2011). Google Scholar
M. Davidsonet al.,
“The coastview project: developing video-derived coastal state Indicators in support of coastal zone management,”
Coast. Eng., 54
(6–7), 463
–475
(2007). http://dx.doi.org/10.1016/j.coastaleng.2007.01.007 COENDE 0378-3839 Google Scholar
Biography ByoungChul Ko received his BS degree from Kyonggi University, Korea, in 1998, and his MS and PhD degrees in computer science from Yonsei University, Korea, in 2000 and 2004. He was a senior researcher of Samsung Electronics from 2004 through 2005. He is currently an associate professor in the Department of Computer Engineering, Keimyung University, Daegu, Korea. His research interesting includes content-based image retrieval, fire detection and robot vision.  Sooyeong Kwak received her PhD degree from Yonsei University, Seoul, Korea in 2010. She was a senior researcher of Samsung Electronics from 2010 through 2011. She is currently an assistant professor in the Department of Electronic and Control Engineering at Hanbat National University, Daejeon, Korea. Her research interests include robot vision, video analysis, and intelligent surveillance system. |