|
|
1.IntroductionPassive millimeter wave (PMMW) imaging has many applications, such as remote sensing of the Earth’s resources, aircraft landing in optically obscure weather, and security point inspection of concealed weapons in humans.1 The Earth’s resources that may be sensed by passive MMWs include terrain mapping, soil moisture and polar ice mapping, ocean surface sensing, as well as atmospheric water vapor and temperature profiling as a function of altitude for climate modeling and weather sensing.2 The underlying principle is the measurement of Planck’s blackbody radiation of materials at millimeter wavelengths. The main advantage of passive MMW imaging is that it provides information about ground-based targets under all weather conditions; optical systems [visible and infrared (IR)], on the other hand, require clear atmospheric conditions for reliable operation. For example, the atmospheric attenuation of MMW frequencies at sea level is 0.07 to in drizzle and fog, whereas it is one to three orders of magnitude higher for optical frequencies (exceeding in foggy conditions).3–5 Excellent image contrast is obtained in outdoor environments due to cold sky-reflected radiation by targets. For example, the apparent temperature of the sky in clear weather at 94 GHz is 70 K in comparison to 220 K at infrared wavelengths. Even at the same ambient temperature, there exists variation in MMW thermal contrast of objects because of their emissivity differences at these wavelengths, e.g., the emissivity6 of metal is , water 0.4, wood 0.4, and concrete 0.8. Signal “washouts” do not occur since the apparent temperature between the background and the object is rarely the same. In addition to imaging, passive MMWs can be used to obtain spectroscopic signatures of chemicals based on molecular rotational energy transitions.7 With a 16-channel filter bank in the 146 to 154 GHz band, we have measured the 150 GHz spectral line of nitric oxide from a test stack at a distance of 600 m from the radiometer.8 We upgraded the MMW spectrometer into an integrated imaging and spectroscopy system for broad area search and detection of nuclear facilities.9,10 Figure 1 is an example of an outdoor image of a dome-shaped building at 300 m, in which the passive MMW image is overlaid on optical image using augmented reality technique. Fig. 1Passive MMW image (a) of an outdoor scene overlaid on optical image (b); the scene consists of a dome-shaped building at 300 m from the imager. 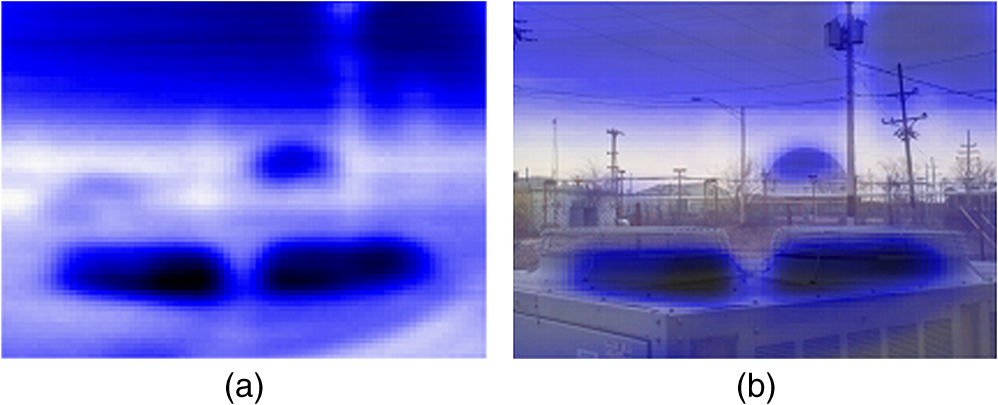 A major disadvantage of such a single-pixel imaging system is the long scanning time that it takes for image acquisition. For example, the pixel image of Fig. 1 with 1 s integration time per pixel took about 3 h. Such a long imaging time diminishes the imager’s value for applications involving nonstationary objects. We have investigated the application of compressive sensing (CS) techniques in this paper as they have the potential to reduce the image acquisition time by a factor of 10 or more. 2.Compressive Sensing with Coded Aperture MasksCS involves exploiting the sparsity or compressibility of an image in some transform domain such that one can utilize fewer measurements (fewer samples) than the ones required for conventional imaging, yet the image can be reconstructed with minimal loss of information. While conventional data compression techniques, such as JPEG, use bandwidth compression for efficient storage and communication purposes after a full image is collected, CS techniques exploit compression in signal/image structure and collect fewer data, thus saving on imaging time.11 In order to guarantee lossless image reconstruction by CS theory, the acquisition matrix must satisfy the restricted isometry property (RIP).12–14 Matrices that are known to satisfy the RIP condition with high probability include matrix elements drawn from Gaussian independent and identically distributed (iid) random numbers.14 Because iid-based spatial light modulation is difficult to implement, binary representation of the iid random numbers is used in practice. Digital micromirror devices (DMD) have been used in single-pixel optical cameras in which random masks are created by electronically orienting them into one of two reflecting positions. Unlike DMDs that are individually controlled to reflect the incident light beam toward (on) or away (off) from the imaging lens, one may use coded apertures with binary elements representing transmission (on) or reflection (off) of the light. Feasibility of CS with such masks was tested in an active MMW system by inserting a sequence of prefabricated printed circuit masks in a collimated MMW beam and collecting mask-modulated radiation through a dielectric object to be imaged.15 The manual introduction of masks as above defeats the purpose of fast imaging by CS. In this paper, we present for the first time a novel method of implementing CS in passive MMW imagers. Compared to active MMWs, passive MMW radiation is very weak and incoherent; as a result, the quasioptical components in passive MMW systems must be carefully designed to minimize diffraction losses by the masks and maximize the signal-to-noise ratio (SNR). We used Hadamard transform masks as coded apertures for light modulation as they offer a practical means of introducing random selection of Hadamard patterns using a single extended mask. Like random binary numbers, randomized Hadamard patterns, such as the scrambled block Hadamard ensemble, are also known to satisfy the RIP property.16 While our imaging setup, in principle, can employ scrambled block Hadamard ensemble, we followed a slight variation of it in that the Hadamard patterns were chosen from a random selection of the rows of a cyclic -matrix derived from the Hadamard transform theory.17 The main advantage is that the reconstruction problem becomes linear in the form of simple matrix manipulation of the -matrix, significantly reducing the computation burden and time involved with the nonlinear minimization reconstruction algorithms used in traditional CS methods. 2.1.Design and Fabrication of Hadamard MasksInstead of using random masks one at a time, a single extended Hadamard mask, , may be constructed that encompasses all possible Hadamard patterns as submatrices. The procedure to construct an extended Hadamard mask is as follows. A cyclic -matrix of size , where and are prime numbers and , is formed using the twin prime construction method by which a row of elements of value 0 or 1 is produced by a set of rules on the ’th element based on the remainders of and .17 Once the first row of is formed, the -matrix can be completed by shifting the row by one element to the left and filling the missing rightmost element in a circular pattern. Taking and as an example, Fig. 2(a) gives the -matrix in which black represents 0 and white 1. To form the extended Hadamard mask, the elements of the first row of the -matrix are folded into a matrix that is concatenated to the right and below to form a matrix as shown in Fig. 2(b). From the extended Hadamard mask, one can randomly choose Hadamard acquisition matrices , to by matching the top left corner of a template of size to the location in , where corresponds to the ’th row of the -matrix. Fig. 2The elements of cyclic matrix (a) and extended Hadamard matrix shown by the box (b) for and . The dark shades represent 0 and the light shades 1. The matrix elements are indentified by numbers 1 to 35 in (b). 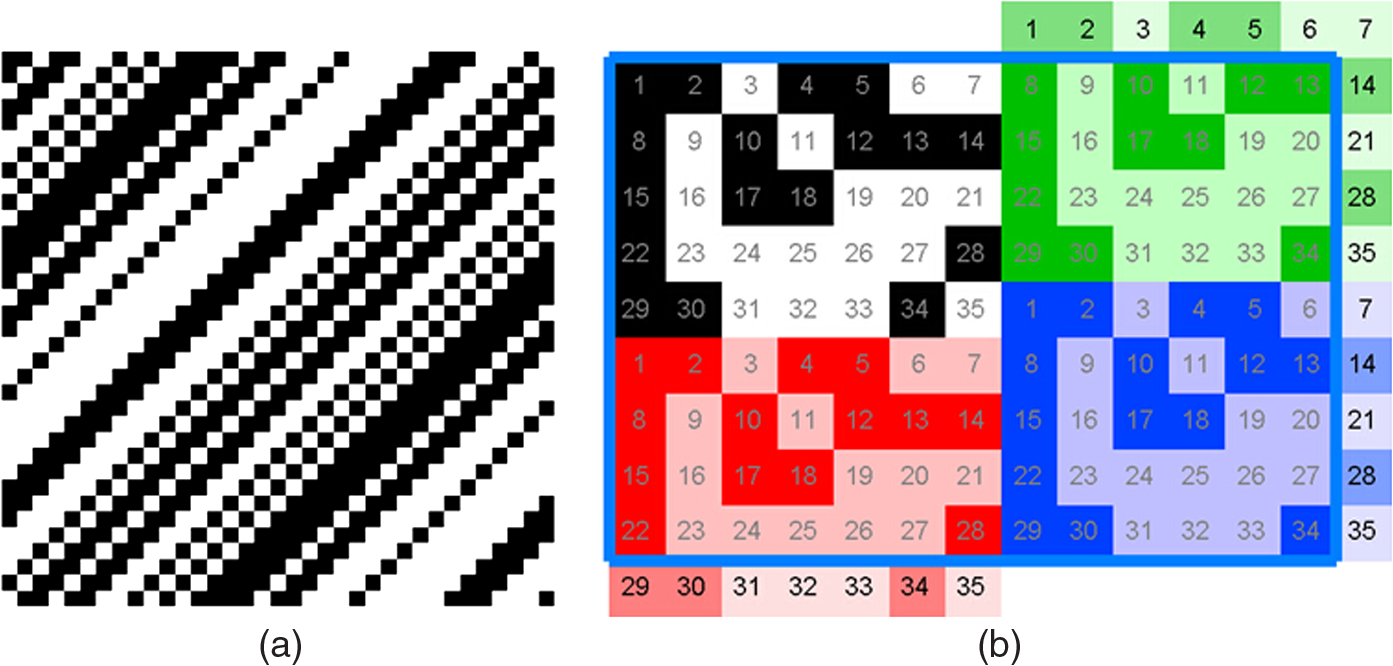 The design of mask size and pixel resolution is based on the following considerations:
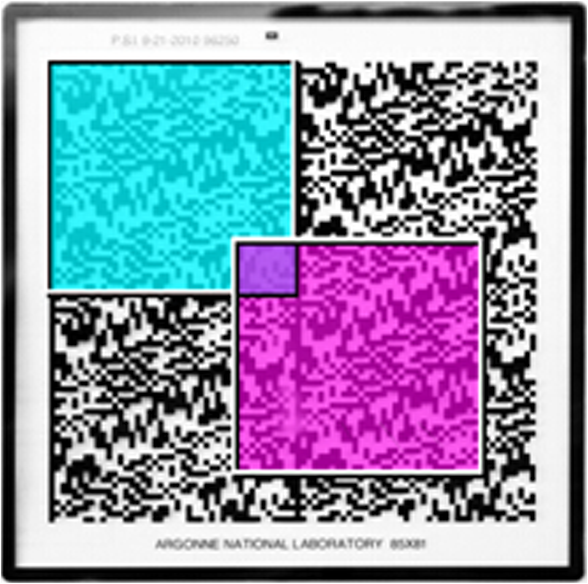
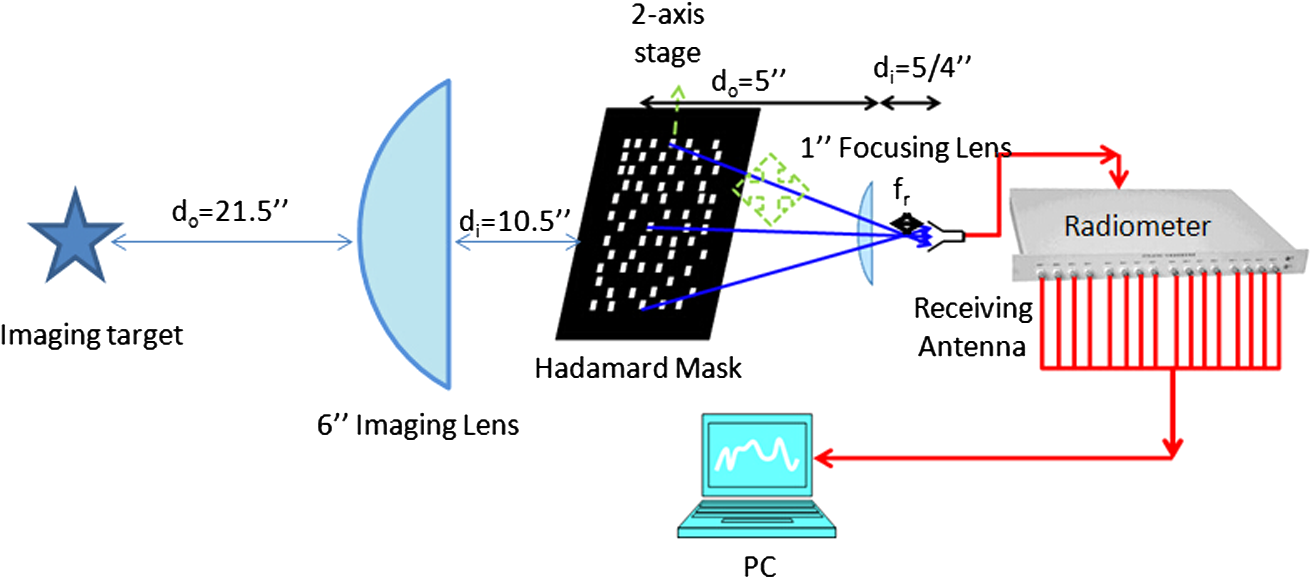
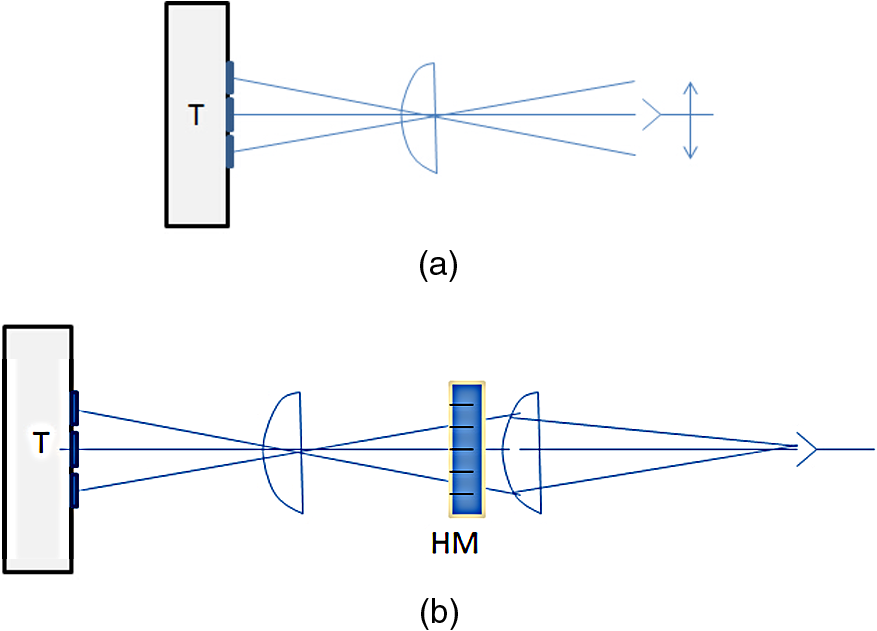
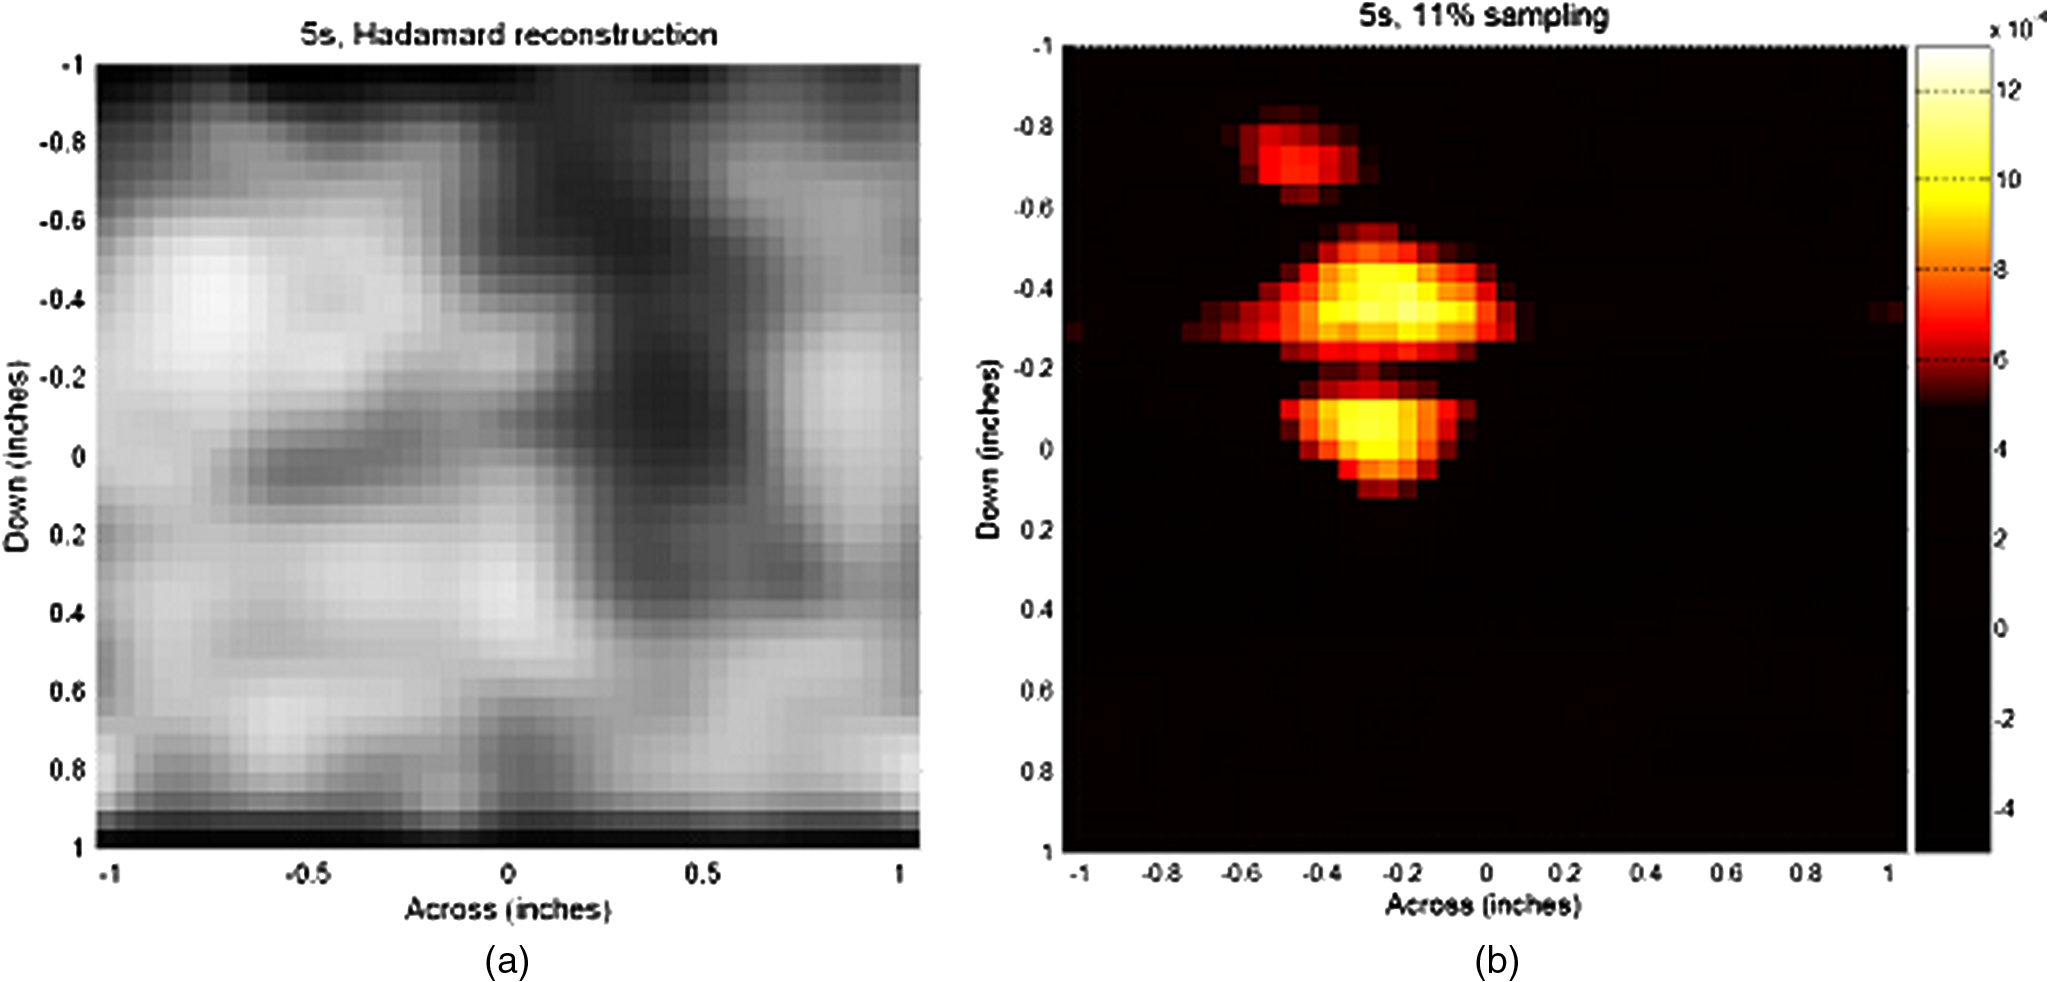
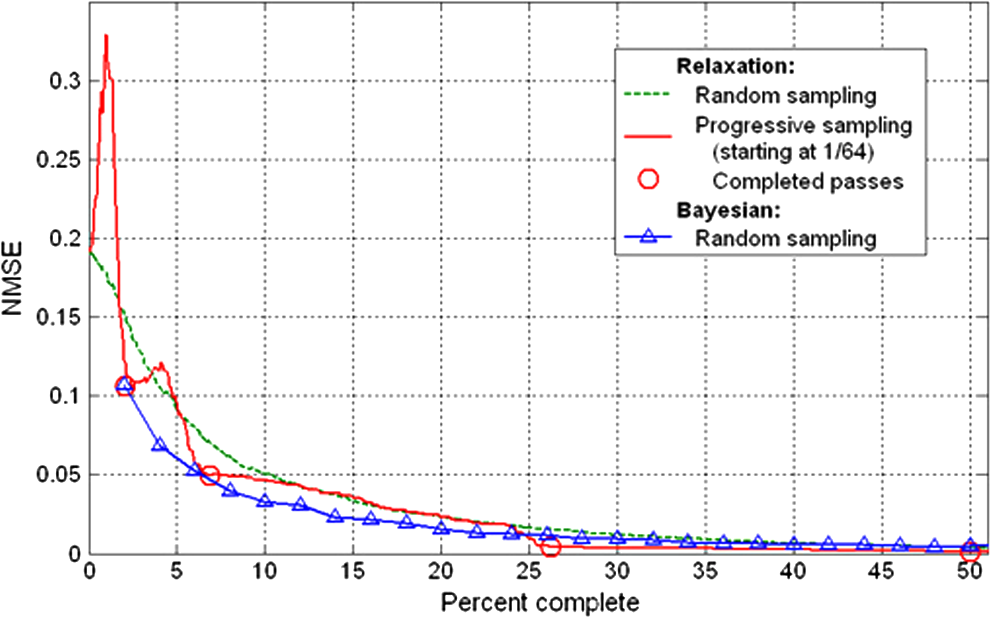
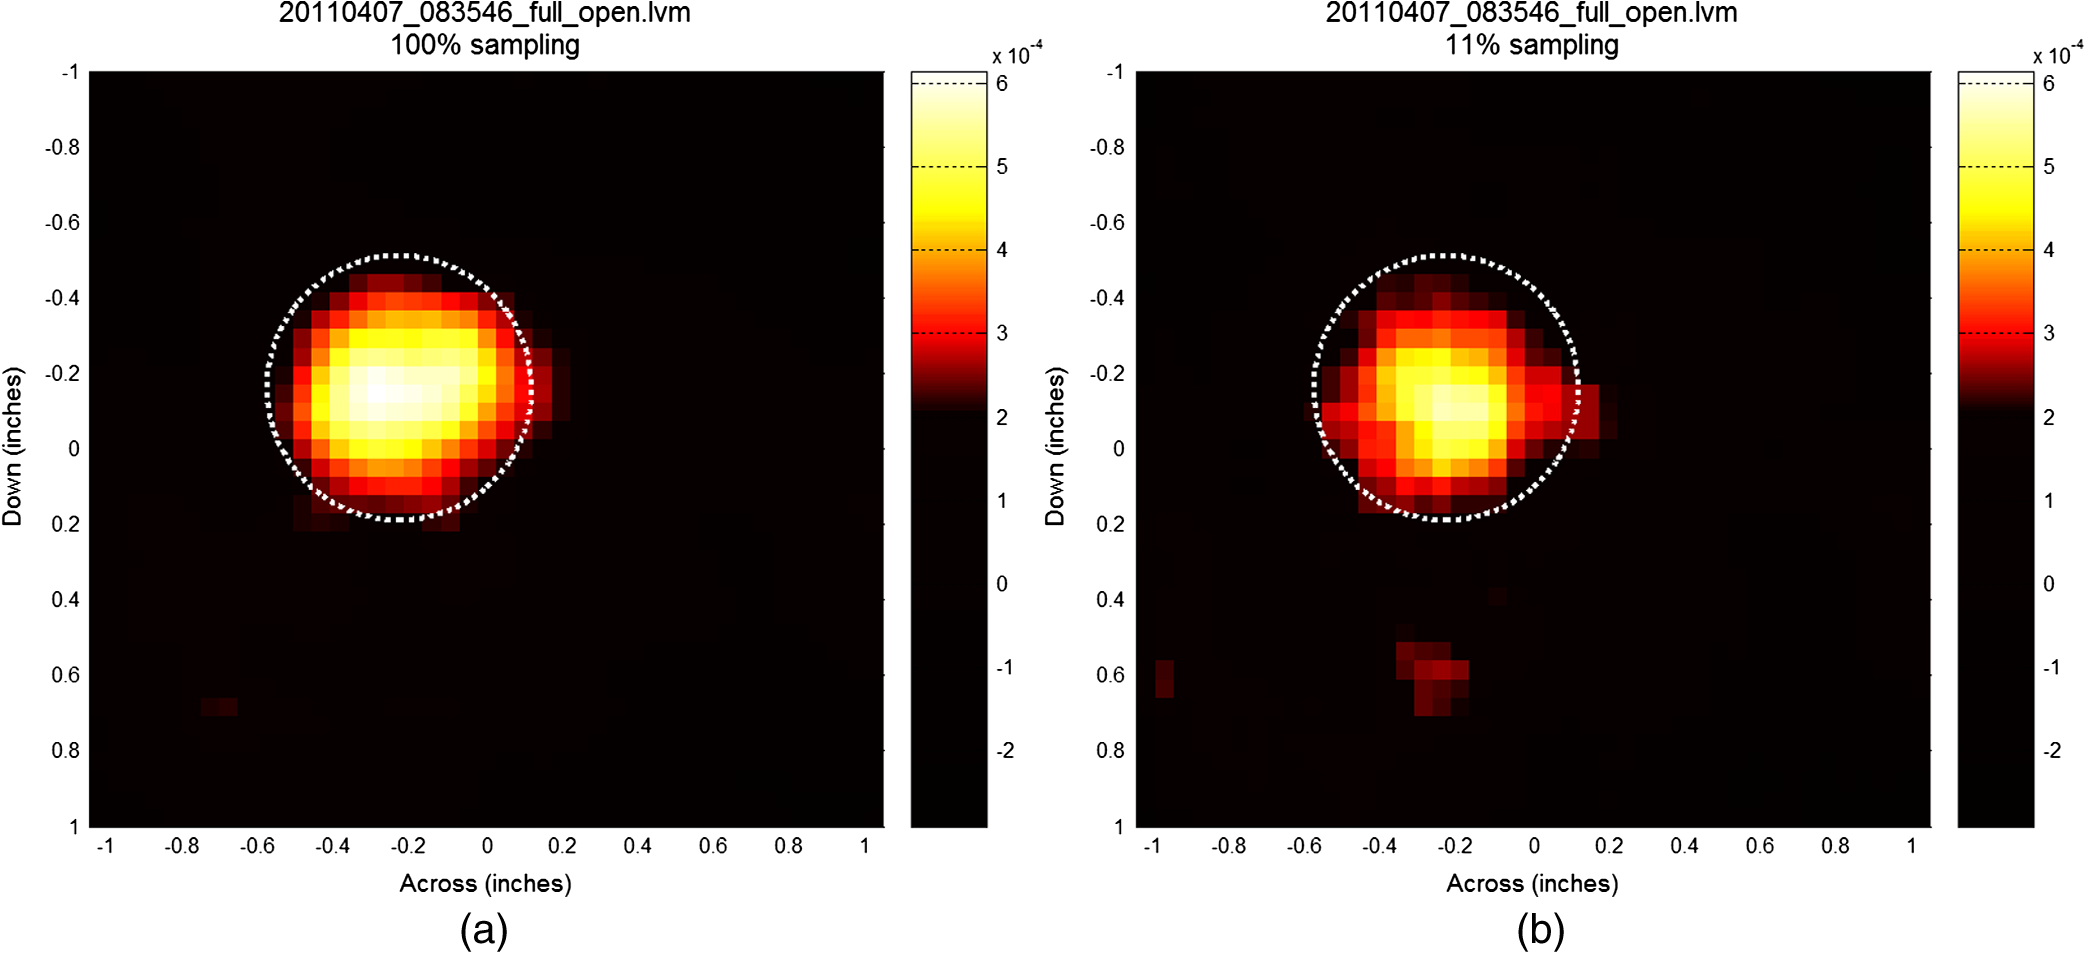
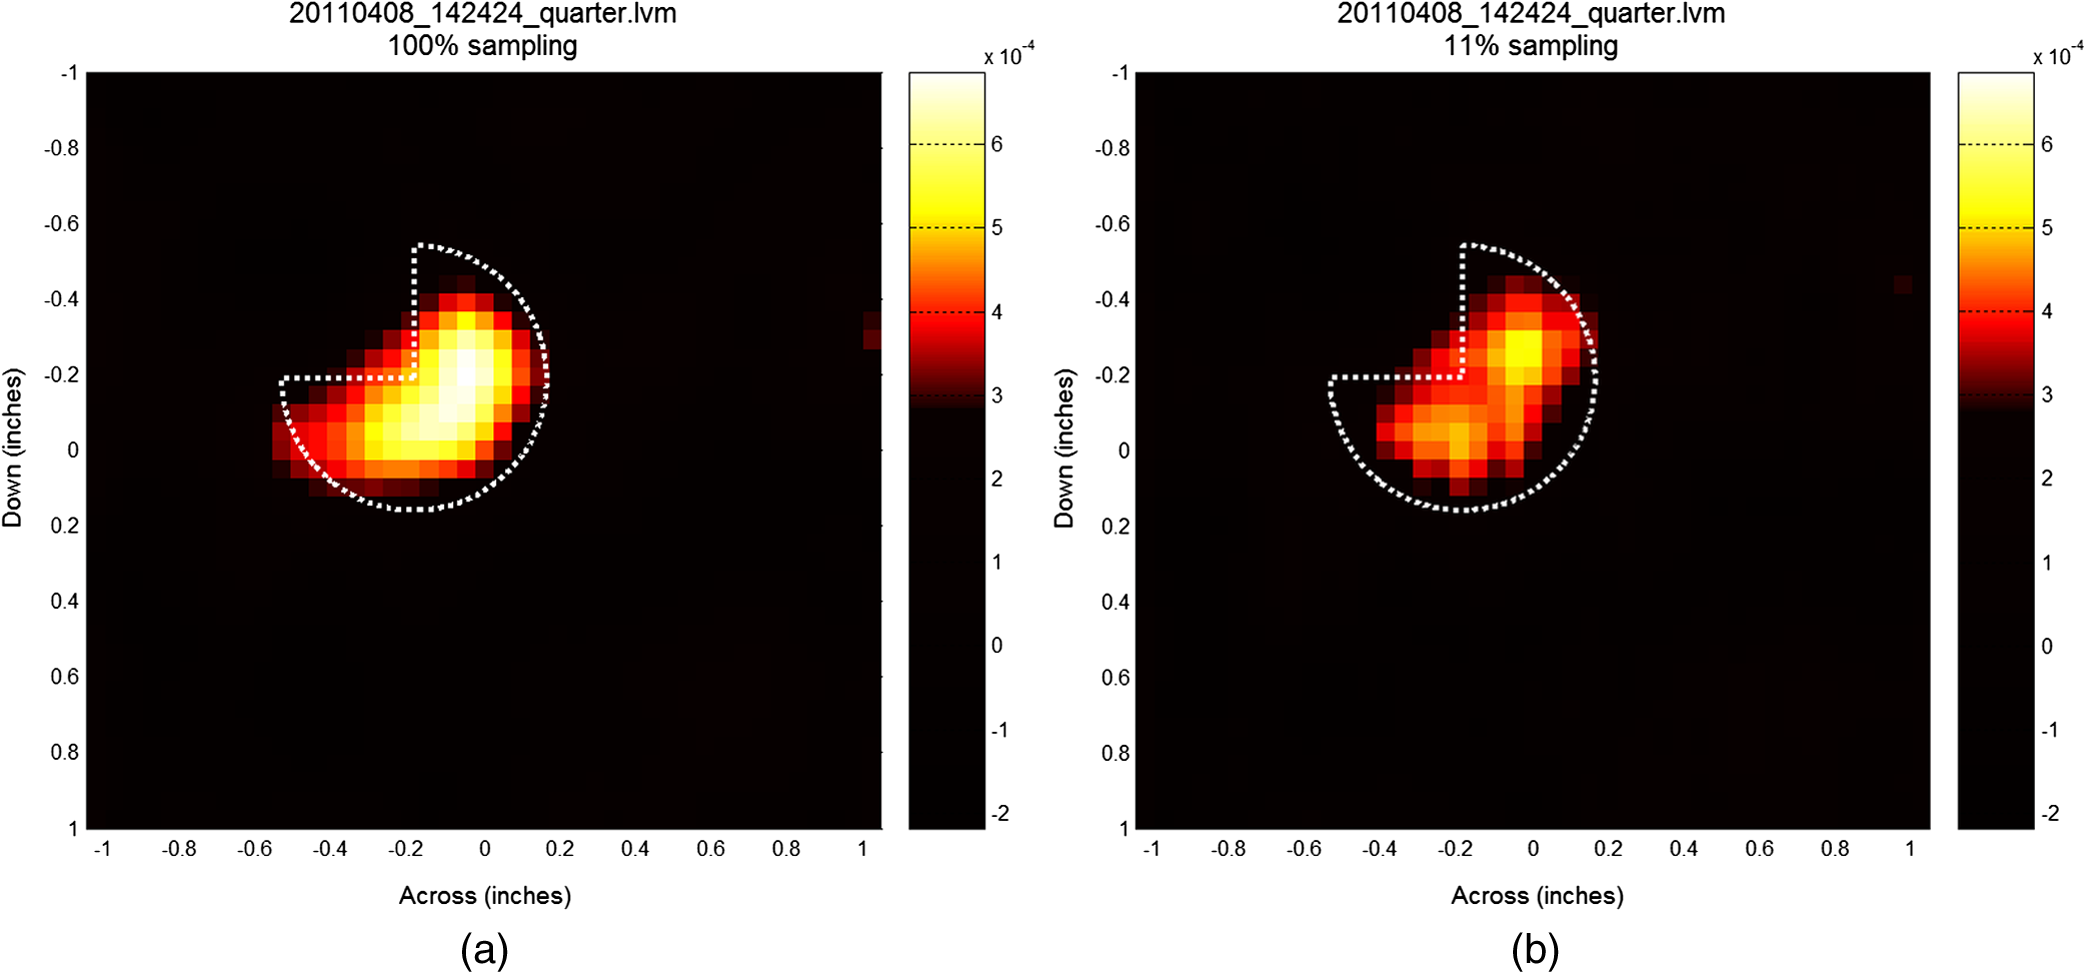
We used and with a pixel size of 1.24 mm and produced an extended cyclic mask of pixels of size . Each mask is of size . The extended Hadamard mask was fabricated using chrome coating on a millimeter-wave transparent quartz plate, as shown in Fig. 3. The colored boxes show two of the 1763 possible Hadamard patterns that can be created by exposing parts of the mask. 3.Compressive Sensing Passive MMW Imager3.1.Imager SetupFigure 4 shows a two-lens passive millimeter-wave setup for CS implementation using Hadamard masks. The extended Hadamard mask is placed at the image plane of a six-in. lens, where the image of a distant target is formed. A metal plate (template) with a hole of size is placed in front of the mask, which defines the exposure window. The extended mask is controlled by a two-axis translation stage to expose different mask patterns for compressive data collection, one for each measurement. A second lens of 1-inch diameter collects the modulated radiation field through the Hadamard mask and focuses it onto the multichannel radiometer. The positions of the lenses and the mask are governed by the lens equation: , where is the focal length of either of the lenses, and and are the image and object distances, respectively. Because the targets used in these experiments do not have spectral features, we averaged all 16 spectral channels, which offers an increase of SNR by a factor of four. 3.2.SNR Analysis of CS Imager SetupIt is important to compare the SNR between the raster scanning and CS systems to ensure that the reduction in imaging time obtained with the latter does not come at the expense of the radiometer sensitivity. A reduction in sensitivity by a factor in the CS setup is equivalent to a reduction in the integration time by a factor of in the raster scanning setup, as the sensitivity of a Dicke-switched radiometer is given by: , where is the noise temperature of the receiver, is the predetection bandwidth, and is the postdetection integration time. For example, if the CS setup offers a reduction in imaging time by a factor of 10 at a cost of 3.16 times less in sensitivity (), the same saving in imaging time can be obtained with conventional imaging by reducing the integration time by ten times for an equivalent sensitivity of . However, if the raster scanning system uses a stop-and-go implementation for data collection at each pixel, the total acquisition time including the translation time of the raster scanning system can be substantially longer than that of the CS system. Figure 5 shows ray tracing diagrams of raster-scanned and CS-based signal acquisitions. While the raster scanning system collects the radiation from each pixel of the target, the CS system in principle sums up the radiation from (as approximately half of the pixels in the mask are open) of the target. If there were to be no loss due to the mask or in the radiation collection from the target to the radiometer, the SNR of the CS system would be times the raster scanned system as the noise is averaged while the signal related to the target temperature remains the same. In practice, however, radiation losses occur due to (a) diffraction effects from the subwavelength-sized mask apertures and (b) inefficient radiation collection by the finite-size lenses. The diffraction loss due to the mask may be analyzed as follows. Each aperture in the mask can be treated as a dipole antenna18 radiating over a spherical area and only part of this radiation is collected by the 1-in. diameter lens. The actual intensity of each pixel collected by the radiometer can be expressed as: , where is the intensity of a single pixel, and is the fraction of the intensity collected by the radiometer. For the experimental setup in Fig. 4, is the ratio of the area of the focusing lens and that of the spherical surface at a distance . Accordingly, . For and , and . The total intensity from all pixels collected by the radiometer is thus given by , where we have assumed uniform intensity from all the pixels. For , we get . Hence, the corresponding improvement in SNR is estimated as three times that of the raster scanned imagers. The two-lens setup we have used is not an optimal design for radiation collection since a large portion of the radiation from the target does not reach the radiometer. With better collection efficiency and higher pixel count , the SNR of the CS system is expected to be higher than that of the raster-scanned setup. Furthermore, there is a tradeoff between pixel size (image resolution) and SNR; with a larger aperture (lower resolution), the diffraction losses will be less, resulting in a higher and, in turn, a higher SNR. 4.Image Reconstruction4.1.Image Reconstruction from Full Hadamard AcquisitionsIf a complete set of acquisitions is obtained by fully raster scanning the extended Hadamard mask, the image reconstruction consists of simple matrix manipulations as given below. The measured intensity vector using Hadamard masks may be expressed as19 where is the cyclic -matrix realized by the Hadamard mask and is the scene intensity vector, which can be reconstructed from the full set of Hadamard measurements byFor a given Hadamard mask size, the matrix in Eq. (2) can be predetermined from the Hadamard sequence, so the image reconstruction is very fast. To test image formation and reconstruction, we used a single lens imaging setup as in Fig. 6, with a light bulb (thermal light source) illuminating an object and the Hadamard mask placed behind the object in close proximity. The relative sizes of the object (at the mask) and images for the single-lens setup may be determined using the ray tracing diagram in Fig. 6. According to the lens equation, the object and image distances and are given by , where is the focal length. With and , . The magnification is given by , where and are the object and image sizes, respectively. For an antenna of radius , the field of view (FOV) is . The imaging setup we used provides only 2.54 cm FOV; as a result, we covered the imaging area for this setup with a metal plate having a 2.54 cm diameter hole. In order to expand the FOV to the full extent so that it covers the size of the Hadamard template (), the distances and may be changed to 22.86 and 2.8575 cm, respectively, keeping the lens diameter the same. Fig. 6Proof-of-principle test with a thermal light source illuminating an object consisting of a 2.54 cm diameter circular hole with a 3-mm wide rectangular metal strip. 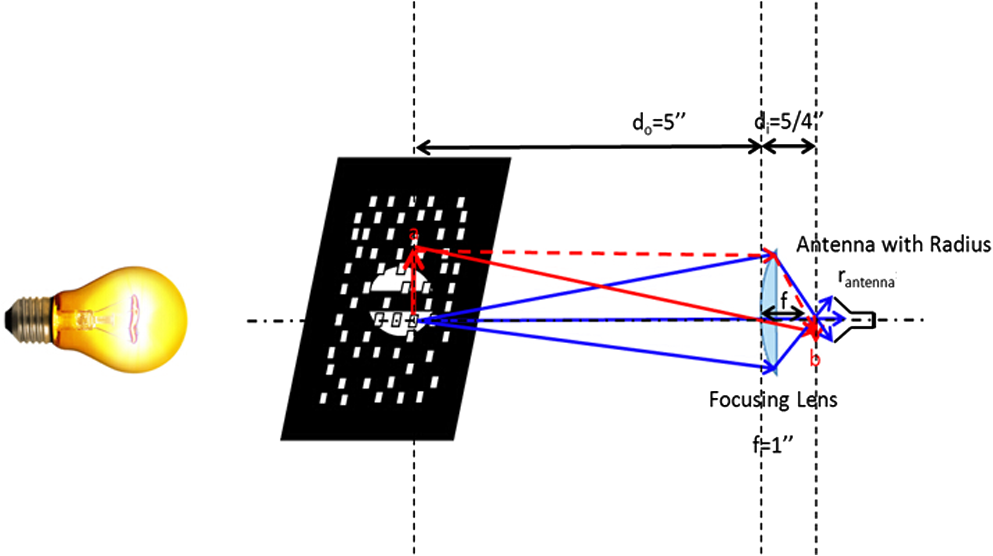 We first simulated the Hadamard transform and image reconstruction process for an object geometry consisting of a metal plate with a circular hole of diameter 2.54 cm and a 3-mm wide rectangular metal strip across the middle. Figure 7(a) gives the binary coded image of the object with 1 representing the hole and 0 the metal portion, and Fig. 7(b) is its Hadamard transformed image according to Eq. (1) after folding the vector into a matrix. The reconstructed image from Hadamard transformed data using Eq. (2) was exact and identical to Fig. 8(a) as there was no measurement noise for this ideal case. Fig. 7Simulation of target geometry: (a) digitized image of circular hole with a strip in the middle and (b) simulated Hadamard transformed image. 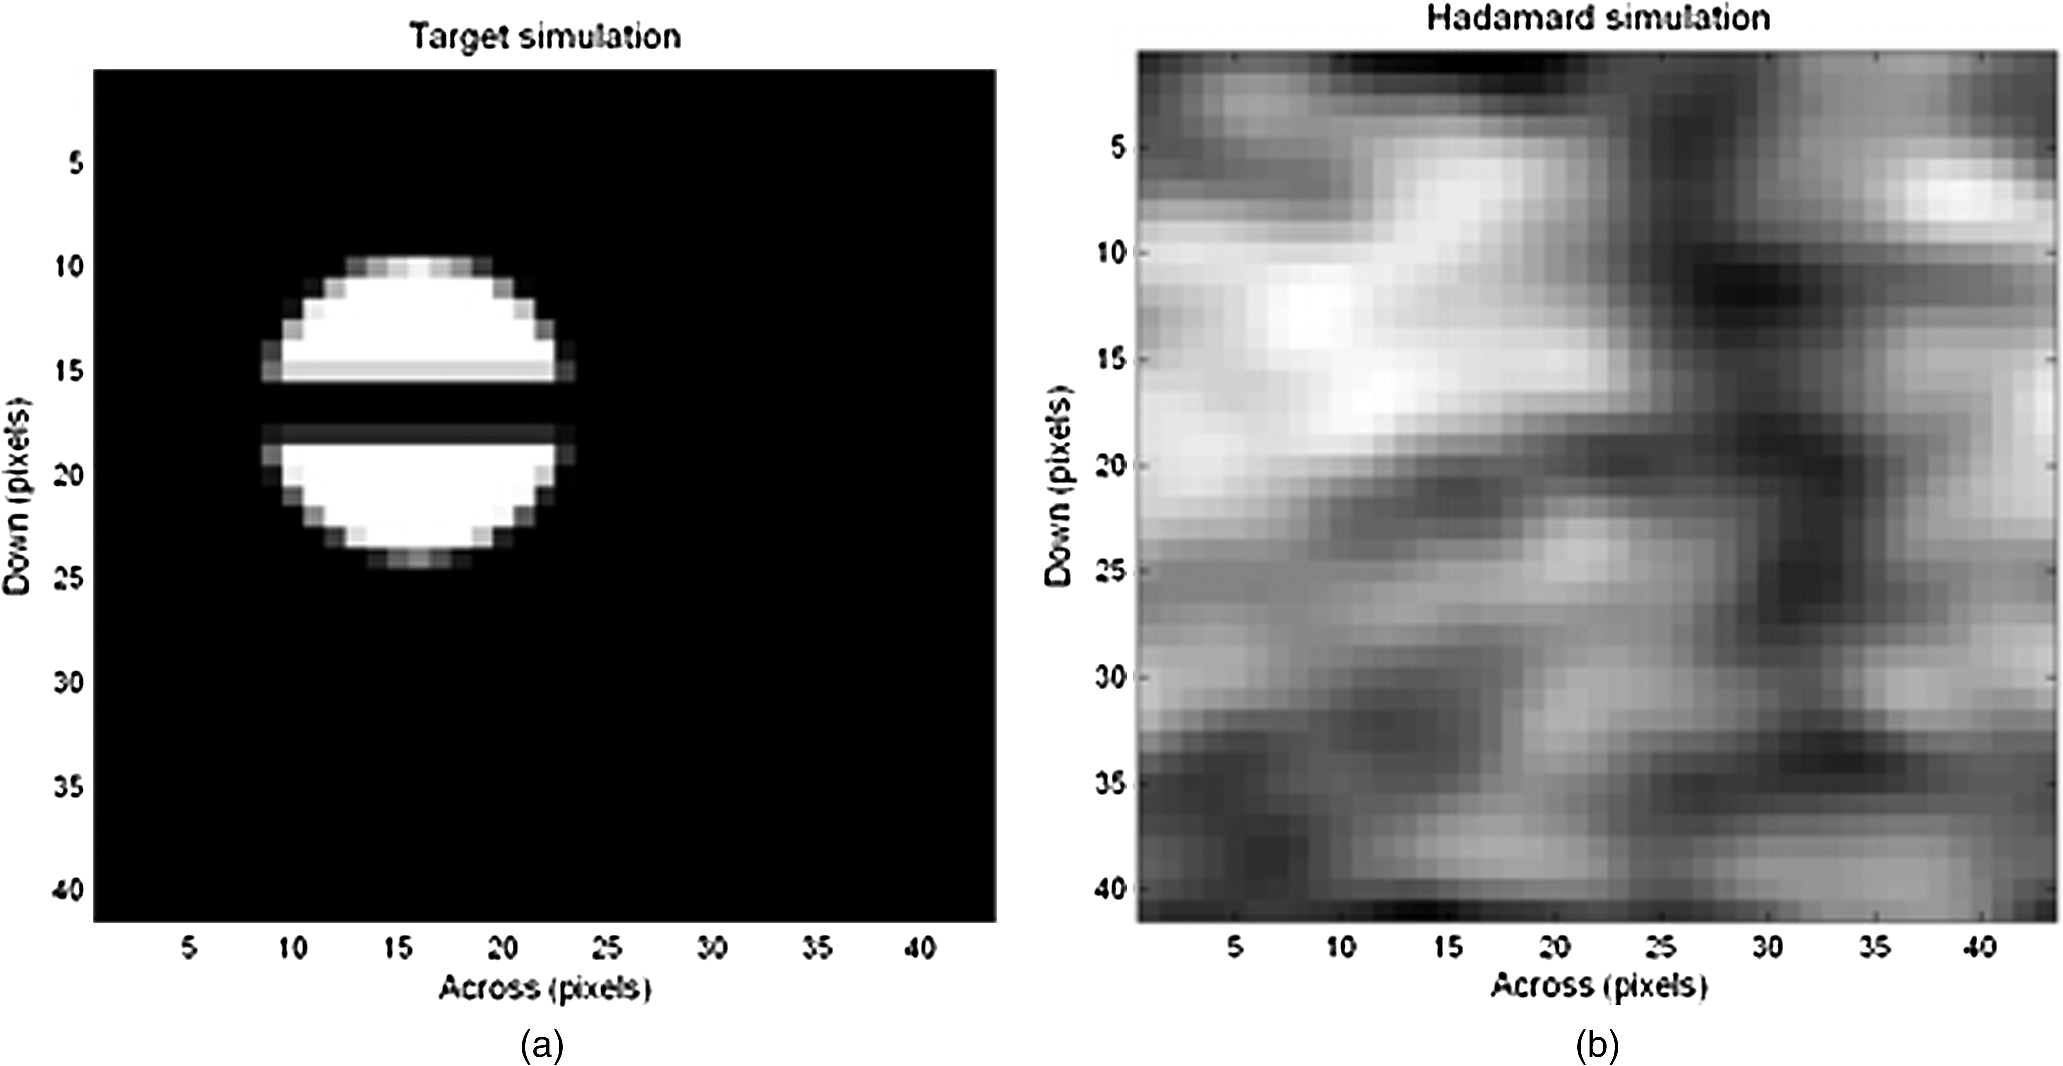 We next obtained a full set of Hadamard acquisitions by raster scanning the Hadamard mask. Figure 8(a) gives the Hadamard transformed image, and Fig. 8(b) shows the reconstructed image using Eq. (2). An excellent agreement is seen between the simulated [Fig. 7(b)] and experimental [Fig. 8(a)] Hadamard transformed images. The reconstructed image of a circular hole with a horizontal metal strip shows the feasibility of Hadamard imaging at millimeter wavelengths with subwavelength resolution (1.24 mm pixel size for 2 mm wavelength). 4.2.Image Reconstruction from Partial Hadamard AcquisitionsInstead of fully scanning the extended Hadamard mask, one may sample the mask randomly or sequentially every ’th pixel in the horizontal and vertical directions. Figure 9 gives a flowchart of data acquisition and image reconstruction steps as the data acquisition proceeds. The measured data with the Hadamard matrices are in the Hadamard transform space. If the Hadamard transform space is complete with all acquisitions, the reconstruction is simply multiplication of the matrix with the unwrapped Hadamard transform data as presented before. To reconstruct from an incomplete data set in the Hadamard transform space (compressive sampling), we introduce an iterative method of estimating the missing elements in the Hadamard transform space: the relaxation method, used in the numerical electrodynamics field.20 Fig. 9Flowchart of Hadamard matrix acquisition and image reconstruction from compressively sampled data. 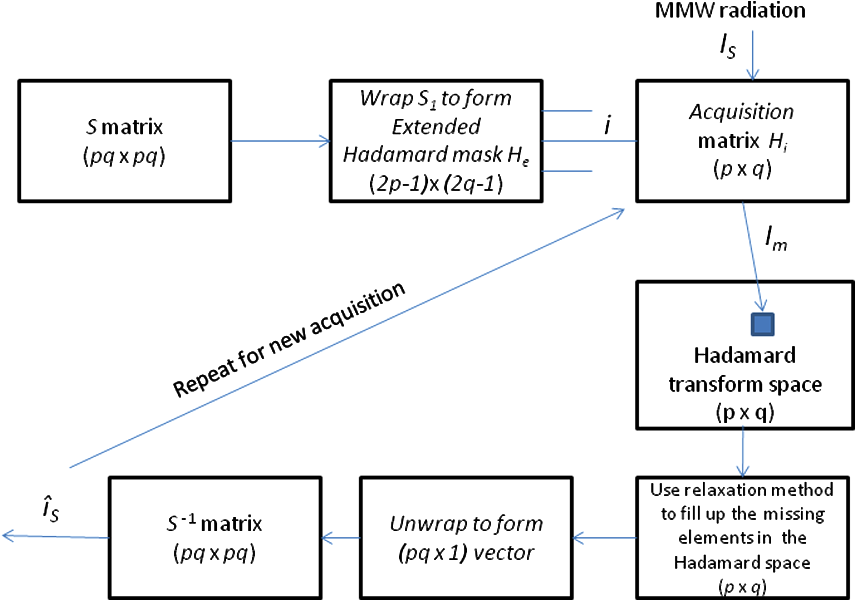 The relaxation method is based on iteratively estimating the two-dimensional (2-D) functional value at the coordinate () from the nearest neighbors (straight) and next nearest neighbors (cross), where and is the distance between the grid points. This is equivalent to applying a filter at the grid ():The iterative procedure consists of: 1. Enter the known values, 2. guess the missing elements, 3. apply the filter B and estimate the average value for (), 4. reassert the known values and iterate on step 3 until desired convergence is reached. If the function is well behaved, convergence can be shown by a Taylor series analysis.20 To test the relaxation technique, we sampled every third column and third row of the Hadamard space, providing of the full acquisitions. Figure 10(a) gives the recovered image in the Hadamard space, and Fig. 10(b) shows the reconstructed image of the object. The recovered Hadamard transformed image [Fig. 10(a)] from partial data compares well with the full Hadamard transformed image in Fig. 8(a). The reconstructed image of the object clearly shows the circular hole with a strip in the middle; however, the geometry looks somewhat distorted around sharp edges, which gets improved with additional samples. 4.3.Progressive Compressive Sensing and Real-Time Image ReconstructionWe developed a progressive sampling and image reconstruction method in which the Hadamard acquisition starts at every ’th row and ’th column in the Hadamard space. The relaxation technique is applied to fill the Hadamard space from which the image is reconstructed after every sample in real time by Eq. (2), since the -matrix is predetermined for a given and . If the image is not satisfactory, we continue sampling the Hadamard space in between the sampled points and reconstruct with () data, and so on. The sample space is progressively increased until satisfactory image quality is obtained. The complete image acquisition and reconstruction software is implemented in LabVIEW. The reconstructed image quality using the progressive sampling method was compared against the Bayesian random sampling method that we had developed in the past.21 A normalized mean squared error (NMSE) metric was adopted for comparison of reconstructed images from partial and full sets of samples. , where and are the intensities of the ’th pixel corresponding to the reconstructed images from partial and full acquisitions, respectively. Figure 11 provides the comparison of NMSE versus the percent completion of the full acquisitions for the case of (a) relaxation method with random Hadamard patterns, (b) progressive sampling after each acquisition starting at of full samples, (c) progressive sampling after each complete cycle in the Hadamard space, and (d) Bayesian reconstruction from random Hadamard acquisitions. The reconstructed image obtained after every complete cycle (e.g., ) showed comparable or better performance than the random sampling methods. In addition, the computational time of the Hadamard transform-based reconstruction is significantly less than that of the conventional nonlinear minimization algorithms used in traditional CS reconstruction methods. 4.4.Imaging with Two-Lens SetupThe single lens imager setup shown in Fig. 6 was used for proof-of-principle testing of compressive sensing. To extend it to a full imaging system, we used a two-lens CS setup as shown in Fig. 4. To ensure high thermal contrast under indoors, a 60 W incandescent lamp (thermal source) was used as the target to be imaged. In outdoor conditions, however, such an artificial hot source is not needed as the cold sky reflected radiation would offer excellent thermal contrast. Figure 12 gives the reconstructed image of the lamp with (a) full and (b) 11% samples, and Fig. 13 gives that with one quarter of the lamp blocked by a metal plate with (a) full and (b) 11% samples. The reconstructed images with 11% samples compare well with those from full samples; however, there is a slight distortion in the object geometry due to the smoothing nature of the algorithm around sharp edges. 5.ConclusionsWe have developed a CS approach for single-pixel passive millimeter wave imaging; it offers the potential to reduce the image acquisition time by a factor of 10 or more, obtain subwavelength pixel resolution, and achieve better SNR than with raster scanned systems. It is based on Hadamard transform masks for spatial intensity modulation, which allows for near real-time image reconstruction from partial samples. The traditional CS methods use acquisition matrices that satisfy the RIP or incoherence property that guarantees accurate image reconstruction with nonlinear minimization algorithms. The Hadamard patterns we employed for image acquisition would fit the CS framework if we had used, for example, a scrambled block Hadamard ensemble. While our imaging setup, in principle, can use such random acquisition matrices, we followed a slight variation of it in that the Hadamard patterns were chosen from a random selection of the rows of the -matrix. The advantage we gained was the feasibility of real-time (relative to the integration time) image reconstruction as the reconstruction problem became linear, significantly reducing the computational complexity. We used a Hadamard mask of , with pixel size of 1.24 mm, about half the wavelength of our 146 to 154 GHz radiometer. To introduce different Hadamard masks in the MMW beam path for compressive sensing, we designed an extended Hadamard mask of ; a two-axis translational stage was used to expose different submasks of size from the extended mask. Images were first reconstructed from a full set (1763) of Hadamard acquisitions. We devised an iterative relaxation method for image reconstruction from partial Hadamard acquisitions; the Hadamard space is efficiently extrapolated by a numerical relaxation procedure and the image reconstruction then uses standard (full set) inversion of the -matrix. The reconstructed image of the object compared well in quality with the original image with as little as 11% of the full samples. We extended the relaxation method to implement a progressive sampling scheme in LabVIEW with near real-time reconstruction and image display. The image is reconstructed and displayed after each Hadamard acquisition; the acquisitions may continue until satisfactory image quality is obtained. Most test cases resulted in good-quality images with about 10 percent of the acquisitions, thus offering a factor-of-ten increase in imaging speed by adapting the CS approach. AcknowledgmentsThis work is supported by the Office of Nonproliferation and Verification Research and Development under the National Nuclear Security Administration (NNSA) of the U.S. Department of Energy under Contract No. DE-AC02-06CH11357. The work of L. Spinoulas and A. K. Katsaggelos has been supported in part by a grant from the Department of Energy (DE-NA0000457). ReferencesC. Elachi, Introduction to the Physics and Techniques of Remote Sensing, Wiley, New York
(1987). Google Scholar
M. P. CadedduD. D. Turner,
“Evaluation of water permittivity models from ground based observations of cold clouds at frequencies between 23 and 170 GHz,”
IEEE Trans. Geosci. Remote Sens., 49
(8), 2999
–3008
(2011). http://dx.doi.org/10.1109/TGRS.2011.2121074 IGRSD2 0196-2892 Google Scholar
L. YujiriM. ShoucriP. Moffa,
“Passive millimeter-wave imaging,”
IEEE Microw. Mag., 4
(3), 39
–50
(2003). 1527-3342 Google Scholar
R. ApplebyR. N. Anderton,
“Millimeter-wave and submillimeter-wave imaging for security and surveillance,”
Proc. IEEE, 95
(8), 1683
–1690
(2007). http://dx.doi.org/10.1109/JPROC.2007.898832 IEEPAD 0018-9219 Google Scholar
A. H. Lettingtonet al.,
“Passive millimeter-wave imaging architectures,”
J. Optics A Pure Appl. Opt., 5
(4), S103
–S110
(2003). http://dx.doi.org/10.1088/1464-4258/5/4/363 JOAOF8 1464-4258 Google Scholar
M. R. Fettermanet al.,
“Simulation, acquisition, and analysis of passive millimeter-wave images in remote sensing applications,”
Opt. Express, 16
(25), 20503
–20515
(2008). http://dx.doi.org/10.1364/OE.16.020503 OPEXFF 1094-4087 Google Scholar
C. H. TownesA. L. Schawlow, Microwave Spectroscopy, Dover, New York
(1975). Google Scholar
N. Gopalsamiet al.,
“Application of millimeter-wave radiometry for remote chemical detection,”
IEEE Trans. Microw. Theory Tech., 56
(3), 700
–709
(2008). http://dx.doi.org/10.1109/TMTT.2008.916985 IETMAB 0018-9480 Google Scholar
N. Gopalsamiet al.,
“Passive millimeter wave imaging and spectroscopy system for terrestrial remote sensing,”
Proc. SPIE, 7670 767003
(2010). http://dx.doi.org/10.1117/12.850123 PSISDG 0277-786X Google Scholar
S. Liaoet al.,
“An efficient iterative algorithm for computation of scattering from dielectric objects,”
Opt. Express, 19
(43315), 3304
(2011). http://dx.doi.org/10.1364/OE.19.003304 OPEXFF 1094-4087 Google Scholar
D. L. Donoho,
“Compressed sensing,”
IEEE Trans. Inf. Theory, 52
(4), 1289
–1306
(2006). http://dx.doi.org/10.1109/TIT.2006.871582 IETTAW 0018-9448 Google Scholar
M. Duarteet al.,
“Single-pixel imaging via compressive sampling,”
IEEE Signal Process. Mag., 25
(2), 83
–91
(2008). http://dx.doi.org/10.1109/MSP.2007.914730 ISPRE6 1053-5888 Google Scholar
E. J. CandèsJ. RombergT. Tao,
“Robust uncertainty principles: exact signal reconstruction from highly incomplete frequency information,”
IEEE Trans. Inf. Theory, 52
(2), 489
–509
(2006). http://dx.doi.org/10.1109/TIT.2005.862083 IETTAW 0018-9448 Google Scholar
R. M. WillettR. F. MarciaJ. M. Nichols,
“Compressed sensing for practical optical imaging systems: a tutorial,”
Opt. Eng., 50
(7), 072601
(2011). http://dx.doi.org/10.1117/1.3596602 OPEGAR 0091-3286 Google Scholar
W. L. Chanet al.,
“A single-pixel terahertz imaging system based on compressive sensing,”
Appl. Phys. Lett., 93
(12), 121105
(2008). http://dx.doi.org/10.1063/1.2989126 APPLAB 0003-6951 Google Scholar
L. GanT. T. DoT. D. Tran,
“Fast compressive imaging using scrambled block Hadamard ensemble,”
in Proc. European Signal Processing Conference,
(2008). Google Scholar
M. HarwitN. Sloane, Hadamard Transform Optics, Academic Press, New York
(1979). Google Scholar
J. LynchR. MaticJ. Baron,
“Performance limitations of compressive sensing for millimeter wave imaging,”
Proc. SPIE, 7670 76700D
(2010). http://dx.doi.org/10.1117/12.853090 PSISDG 0277-786X Google Scholar
N. Gopalsamiet al.,
“Compressive sampling in passive millimeter wave imaging,”
Proc. SPIE, 8022 80220I
(2011). http://dx.doi.org/10.1117/12.886998 PSISDG 0277-786X Google Scholar
D. Jackson, Classical Electrodynamics, Wiley, New York
(1998). Google Scholar
D. Babacanet al.,
“Compressive passive millimeter wave imaging,”
in Proc. IEEE Int. Conf. in Image Processing (ICIP),
(2011). Google Scholar
Biography Nachappa Gopalsami received his BE and MS degrees in electrical engineering from the University of Madras, India and PhD degree in electrical engineering and computer science from the University of Illinois, Chicago. He joined Argonne National Laboratory in 1980 where he is currently a senior electrical engineer in the sensors and instrumentation section of the nuclear engineering division. His current research interests include development of radio frequency, microwave, millimeter-wave, and terahertz sensors and imaging systems for national security, biosensing, environmental monitoring, and materials applications.  Shaolin Liao received a BS degree in materials science and engineering from Tsinghua University, Beijing, China, in July 2000, he received an MS degree in material science and an MS degree in electrical and computer engineering, both from the University of Wisconsin at Madison, in August 2003 and December 2005, respectively, and a PhD degree in electrical and computer engineering from the University of Wisconsin at Madison, in May 2008. He has held the research fellow position in the physics department, Queens College, City University of New York from May 2008 to January 2010. He is now with Argonne National Laboratory, doing microwave/millimeter wave/THz wave/laser research.  Thomas W. Elmer received a BS degree in physics with minors in math and computer science from La Sierra University in 1998 and an MS degree in physics from the University of Illinois, Chicago in 2004. While at La Sierra, he worked for the physics department, writing and maintaining programs to run laboratory experiments. He has also lectured on astronomy and gravitational physics for the department. In 1999 he joined Argonne National Laboratory as a student intern, eventually staying as a software engineering associate for the system technologies & diagnostics department of the nuclear engineering division. He writes programming for modeling, motion control, data acquisition, and data analysis in the microwave, millimeter-wave, and terahertz sensors labs.  Eugene R. Koehl received a BA in physics from Lewis University in 1969 and a BS in electrical engineering from Midwest College of Engineering (Illinois Institute of Technology) in 1981. He is an electrical engineer at Argonne National Laboratory with 37 years of experience in the design, fabrication, instrumentation, control, and automated data acquisition of experiments and facilities for testing the design and characteristics of sensors, power systems, and LMR components.  Alexander Heifetz is an electrical engineer in the nuclear engineering division at Argonne National Laboratory. Heifetz came to Argonne as a director’s postdoctoral fellow in the nuclear engineering division. His research interests are in simulations and modeling for electromagnetic engineering, nuclear engineering, signal processing, and controls. He received a PhD in electrical engineering, MS in physics and BS (summa cum laude) in applied mathematics, all from Northwestern University. Heifetz has published over 20 peer-reviewed papers in major scientific journals, and has one provisional U.S. patent.  Apostolos C. Raptis is a senior electrical engineer at Argonne National Laboratory with 35 years of experience in teaching and in research and development. His areas of expertise include sensors, instrumentation and controls, nondestructive evaluation, data processing, electromagnetics, plasmas, optics, acoustics, and geophysical exploration. He is presently the department manager for systems technologies and diagnostics in the nuclear engineering division. At ANL he initiated and helped develop ANL’s instrumentation and NDE (I&NDE) programs for nuclear and fossil energy, conservation, and arms controls. He is responsible for work on national security for remote detection of chemical, biological, nuclear agents, and explosives.  Leonidas Spinoulas received the BS degree in electrical and computer engineering from the National Technical University of Athens, Athens, Greece in 2010 and his MS degree in electrical engineering and computer science from Northwestern University, Evanston, IL, USA in 2012. He is currently pursuing a PhD degree in the department of electrical engineering and computer science of Northwestern University, Evanston, IL, USA.  Aggelos K. Katsaggelos received a diploma degree in electrical and mechanical engineering from the Aristotelian University of Thessaloniki, Greece, in 1979, and MS and PhD degrees in electrical engineering from the Georgia Institute of Technology, in 1981 and 1985, respectively. In 1985, he joined the department of electrical engineering and computer science at Northwestern University, where he is currently a professor holder of the AT&T chair. He is the co-author of Rate-Distortion Based Video Compression (Kluwer, 1997), Super-Resolution for Images and Video (Claypool, 2007), and Joint Source-Channel Video Transmission (Claypool, 2007). |