

|
|
1.IntroductionApplications of synchrotron radiation sources are becoming increasingly sophisticated in their ability to probe the smallest scales of interesting natural and man-made materials. This places stringent requirements on the performance of the x-ray optics that are used, especially the mirrors that focus the light onto the sample. Despite highly effective fabrication and ex situ tuning methods, the eventual degradation of these optics due to use, drifts and mechanical instabilities at the beamlines remains a challenge. This has compelled the development of comprehensive methodologies for in situ alignment and tuning of focusing mirrors, in order to realize and maintain the best possible performance. Much fruitful work has been carried out by groups elsewhere towards the development of adjustable focusing x-ray mirrors. Mimura and coworkers1–5 have made significant progress towards developing adaptive optical systems for focusing of hard x-rays as well as metrology techniques for evaluating their characteristics. Similarly, Mercére and coworkers6–8 have developed related methods for tuning active optics to minimize wavefront aberrations. The propagation of focused x-ray beams and their aberrations from precisely figured Kirkpatrick-Baez (KB) mirrors was simulated and studied in great detail by Kewish and coworkers.9,10 Achieving diffraction-limited quality from soft x-ray optics requires alignment feedback with sub-100 nrad slope error sensitivity, a challenging goal for any technique. In this work, we present a systematic and effective methodology for simultaneous alignment and tuning of dual bendable mirrors, arranged in the KB configuration,11 for focusing of soft x-rays at grazing incidence. After applying the described methodology, we demonstrate that the waist size of the resulting focused beam is nearly diffraction-limited. This two-dimensional (2-D) focusing methodology is based largely on our preceding work,12–15 wherein we achieved diffraction-limited one-dimensional (1-D) focusing with a single bendable mirror. To accommodate two orthogonal KB mirrors, we modified the existing experimental 1-D focusing system. The overall system is summarized in Sec. 2. Setting of the two bendable mirrors began in the Advanced Light Source (ALS) Optical Metrology Laboratory (OML). In the OML, the mirrors’ reflective surfaces were bent to most closely fit the desired elliptical slope profile, using the ALS Upgraded Second Generation Long Trace Profiler (LTP-II+).16–20 We found, in situ, that maintaining the mutual perpendicularity of the two mirrors to a high accuracy is critical for achieving the best focusing performance. This relative roll alignment was carried out in the OML. After the surface figure of the two mirrors was set close to optimum ex situ, they were brought to the ALS developmental beamline for in situ tuning and analysis. The straightforward methodology presented in Sec. 3 was effectively employed to optimally configure the two mirrors for focusing. The mirror farthest from the desired focus was aligned and tuned first, and the same techniques were then used to align and tune the second mirror. Following these steps, we obtained nearly diffraction-limited focusing of a coherent monochromatic soft x-ray beam. The size of the beam waist is measured by Foucault knife-edge testing, discussed in Sec. 4, for verification of the nearly diffraction-limited performance of the KB mirror system. Going further, we implemented a wavefront sensing technique for possible finer tuning of the mirrors, which is described in Sec. 5. 2.Optical System for Diffraction-Limited Focusing of Soft X-RaysThe ALS developmental beamline and its endstation were configured for development of in situ metrology techniques.12,14,15 The endstation chamber was designed to isolate the internal optical elements from the outside environment, in order to reduce the effects of vibrations and thermal drifts. This careful design, already described extensively by Yuan and coworkers,12,14 was crucial to the success of this work. Most of this apparatus remained unchanged through the transition from 1-D to 2-D focusing. We therefore limit the scope of this discussion to optics downstream of the monochromator, which emits light of 1 nm wavelength (1.24 keV) into the endstation vacuum chamber. Figure 1 illustrates the arrangement of optics for focusing of the input soft x-ray beam. The beam illuminates an entrance aperture which then produces a divergent cylindrical or spherical wave, when the aperture is a slit or pinhole, respectively. Between the entrance aperture and the mirrors is a pair of bidirectional scanning slits of adjustable width. A pair of bendable mirrors in the KB configuration focuses the beam to a predetermined point. In the vicinity of this expected focal point are a set of downstream metrology tools used to determine the focusing performance of the mirror system. Farther downstream, the beam may be viewed with a wide field CCD camera. Fig. 1Layout of Endstation Optics. The input beam is incident on a small entrance aperture which produces a diverging spherical wavefront. Two Kirkpatrick-Baez mirrors focus the beam to the desired location. A comprehensive but straightforward set of metrology tools are employed to quantitatively characterize the performance of the focusing system and provide feedback for in situ optimization. The YAG crystal and CCD microscope system and nano-structure metrology tools can be translated in all directions.  The entrance aperture consists of two components in series, as illustrated in Fig. 1. A 20 μm circular pinhole accepts a portion of the beam from the monochromator. This is immediately followed, going downstream, by a nano-structure rectangular array of pinholes and slits of varying size and geometry. Fabricated using electron beam lithography at Lawrence Berkeley National Laboratory’s (LBNL’s) Center for X-Ray Optics (CXRO), this array is embedded in a 2.5-μm-thick gold absorbing layer deposited on a 100-nm silicon nitride membrane. A thick absorber is required to attenuate the otherwise bright beamline illumination. The slits in this array have widths ranging from 400 nm to 4 μm. The circular, elliptical, triangular and square pinholes in this array vary in diameter from 400 nm to 10 μm. The slits and pinholes are separated from each other by 100 μm. The array of small pinholes and slits is translated across the larger 20-μm circular pinhole in order to select the appropriate virtual source for the focusing mirrors. The bidirectional scanning slits are part of a JJ X-Ray™ model AT-F7-HV slit system. They have the dual purpose of acting as a secondary aperture for the input beam and as a pair of scanning slits for the mirror tuning process, described below. The vertical scanning slit translates horizontally, and the horizontal scanning slit translates vertically. They are placed near the upstream end of the horizontally focusing mirror to maximize the angular resolution of the scanning procedure. Both the vertical and horizontal focusing mirrors were originally created for different optical configurations than their uses here. They were recently delegated to this work, because they have sagittal width profiles compatible with the requirements.20,21 The central grazing incidence angle is for both mirrors. The usual grazing incidence angle for this photon energy is 4 mrad, but we doubled this angle to increase the numerical aperture (NA). Even though the grazing angle was doubled, the mechanical moments required to tune the mirror were still within the elastic range. The larger angle permitted a tradeoff of 5% in reflectivity for a doubling of the NA. This increased NA allowed the achievement of smaller focused spots, a major goal of this work. Of course, the loss of reflectivity at 1.2 keV from to was also offset by greater light collection at the 8 mrad incidence angle due to the nature of the synchrotron source. A more rigorous optimization accounting for the combined effects of efficiency, incidence angle, and mirror figure error is also possible. Certainly the errors would be smaller at the larger radii of curvature, and hence smaller mechanical moments required at smaller angles of incidence. However, such an optimization is beyond the scope of the present work. For the horizontally focusing mirror, the distance from the entrance aperture to the mirror center is , and the predicted distance from the mirror center to focus is . For the vertically focusing mirror, these distances are and , respectively. The lengths of the horizontally and vertically focusing mirror substrates (made of Si, coated with Au) are 102.0 mm and 101.6 mm, respectively. The clear apertures for both mirrors span the middle 80% of the length. From these parameters, the image side NAs in the vertical and horizontal directions are found to be 2.7 mrad and 1.3 mrad, respectively. Both mirrors are mounted on a common Thorlabs™ XT95 optical rail. This allows easy transfer of both mirrors to and from the endstation between in situ and ex situ adjustments. Prior to in situ alignment and tuning, the expected incidence planes of both mirrors were made orthogonal to within 0.1 mrad in the OML, using a Zygo™ GPI-XP interferometer. We found that without this relative roll alignment of the mirrors, the best focusing of the two mirrors was far from optimum due to an uncorrectable astigmatism. Following this alignment, the benders of both mirrors were adjusted on the OML LTP-II+ such that the surface tangential slope profiles best fit the desired elliptical cylinders, defined by the values of , , and given above for each mirror. The residual tangential figure slope error, the root-mean-square deviation from the desired ellipse, was found to be less than 0.4 μrad for both mirrors after the adjustments. Near the desired optical focus, or image, are a yttrium–aluminum–garnet (YAG) crystal and visible CCD microscope system, along with a second nano-structure array. Both of these components are placed on a single three-axis translation stage, such that they may translate 50 mm along the beam and also the same distance transverse to it in both directions. The YAG crystal fluoresces visibly upon exposure to the soft x-ray beam. This visible light fluorescence is viewed through a microscope objective and attached CCD camera. The effective pixel size when viewing the beam on the YAG crystal is 0.825 μm, and the overall resolution is 2.6 μm. This system gives a visual presentation of the focused beam and used to obtain quantitative information about the focusing performance. The image-side nano-structure array, also created at the CXRO, serves as a multi-element metrology tool, with several 1-D and 2-D transmission gratings, 10 μm vertical and horizontal slits, and vertical and horizontal knife-edges embedded in its surface (with 75% opacity). Similar to the object aperture array, the gold absorber layer is deposited on a transparent silicon nitride membrane. The five 1-D gratings in this array have periods ranging from 4 to 8 μm. The five 2-D cross gratings have the same periods, which are the same in both directions. This nano-structure set of metrology tools is situated on the same translating stage as the YAG and CCD microscope system. In the ideal case, the object is a perfect point source and the wavefront produced by the KB mirrors is perfectly spherical with the focus as its center of curvature. The diffraction-limited width of the beam intensity profile in the focal plane along either direction is estimated as . This width is approximately half the radius of the Airy disc, and the width of the Gaussian distribution which best fits the central lobe of the Airy pattern. Therefore, the smallest possible dimensions of the beam waist in these terms are approximately . 3.Optimal Settings of Bendable Focusing MirrorsUsing the experimental optical system described here, we have developed a methodology to optimally align and tune a pair of bendable KB mirrors. The mounting of these two mirrors at the beamline endstation permits five motorized degrees of freedom for each mirror: height, pitch, roll, and upstream and downstream bending moments. Each of these is controlled by NewPort® Picomotors™ and monitored with linear variable differential transformers (LVDT). The height of either mirror is the position of the mirror in the beam, with respect to motion in the direction perpendicular to the mirror surface. The pitch of either mirror is the angle that the x-ray beam makes with the surface in the plane of incidence. The roll of the mirrors is as described above in Sec. 2. Based on SHADOW ray-tracing simulations, we estimate that mutual roll misalignment of these mirrors in the presented configuration should not exceed an angle of , for diffraction-limited focusing of soft x-rays. Setting this degree of freedom ex situ to a high accuracy simplifies the in situ alignment of the mirrors, allowing independent optimization of each mirror. For this reason, we make no further adjustments to the roll of either mirror. The upstream and downstream benders apply a torque to the upstream and downstream ends of the mirror, with the ends as the centers of rotation.20–23 The following procedures optimally configure the available degrees of freedom of both mirrors in situ. The first step for both mirrors is to simultaneously set the height and pitch of the mirrors. The second step sets the two benders for each mirror. Though the desired focal point is known, there are many combinations of mirror height and pitch which may pass the beam through this point. It is difficult to know a priori which combination of motor positions sets the correct grazing incidence angle. However, the correct combination of height and pitch of a mirror minimizes the beam width when measured in the desired focal plane. This is easily seen by inspection of the equation for 1-D grazing incidence tangential imaging,11 where, for any small section of the mirror surface, is the distance from the object to the section, is the distance from the section to the image or focal point, while and are the grazing incidence angle and radius of curvature of the section, respectively. Consider varying both the height and pitch of the mirror continuously and in a manner such that the reflected beam always passes through the desired focal point, as illustrated in Fig. 2. A given change in height is compensated by a certain change in pitch, or vice versa. The object distance is typically very large and unaffected by this motion. However, the grazing incidence angle changes in proportion to the pitch angle of the mirror, causing the right side of Eq. (1) to vary. Therefore, the effective image distance for this section of the mirror surface must vary accordingly. Assume that the figure of the whole mirror is sufficiently close to the desired elliptical figure, i.e., the benders are set ex situ close to optimum. Then for every part of the mirror will coincide with the distance to the desired focal point if and only if the angle takes on the correct value, at which point the beam width in the desired focal plane is minimized. Hence, the best combination of height and pitch is found by varying both simultaneously, while keeping the beam passing through the desired focal point, and seeking the minimum beam width. Moreover, performing this procedure with both mirrors guarantees that they share a common focal plane.Fig. 2The height and pitch of either mirror are set simultaneously by seeking the combination that minimizes the beam width in the desired focal plane. The beam width when the mirror is misaligned, as with orientation a, will always be larger than the minimum given by the correct orientation b. The dimensions of this diagram are not to scale. 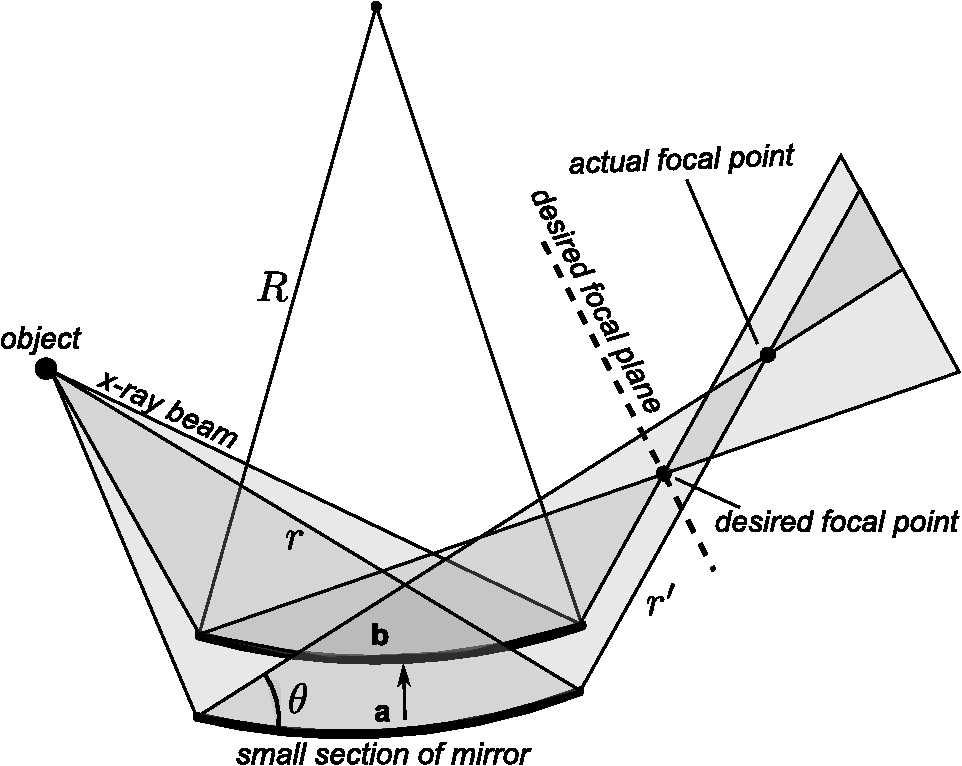 We reduce any remaining figure error of the mirrors by adjusting the two benders of each mirror. One figure of merit for optimal adjustment of the benders of a mirror is the focal plane ray error. This is measured by contracting the corresponding upstream scanning slit so as to illuminate one section of the mirror at a time, and observing the position of the resulting image in the focal plane as a function of slit position. We previously described this procedure in detail.14,15 From a series of measurements, we compute the characteristic functions of the benders with respect to focal plane ray errors and apply linear regression to find the optimal settings of the benders.18,24 The third portion of this methodology uses a lateral shearing interferometer to obtain rapid wavefront feedback for further optimization of the mirror system. This takes advantage of the Talbot effect,25 whereby the diverging spherical wave just downstream of focus is normally incident on a 2-D grating, producing in the far field a self-image of the grating. Any deviations of the resulting intensity interferogram from a perfect self-image indicate wavefront aberrations. The wavefront slope is recovered from this interferogram using well-known Fourier-transform based phase retrieval methods.26–40 We applied this alignment first to the horizontally focusing mirror. The vertically focusing mirror was completely retracted from the beam path and a 4 µm vertical slit was used as the entrance aperture, serving as the object. In this 1-D focusing configuration, the horizontally focusing mirror formed a demagnified image of the slit. The YAG crystal was placed in the desired focal plane in order to observe the beam with the CCD microscope system. From this point forward, we shall simply refer to the desired focal plane as the focal plane. An image of the beam as viewed on the YAG in the focal plane is shown in Fig. 3. Fig. 3Image on YAG of horizontally focused beam in the focal plane. Darker pixel values indicate higher intensity. 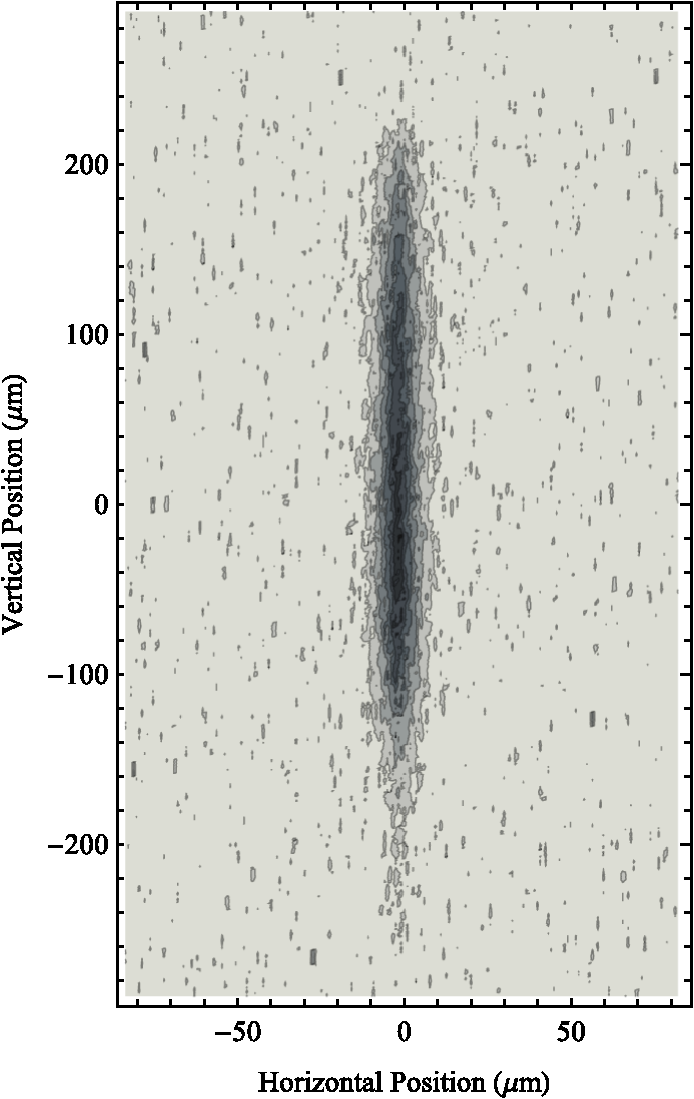 As the first step, we conducted the height-pitch alignment described above. We translated the mirror through various heights, while keeping the position of the beam in the focal plane fixed by adjusting the pitch in compensation. As the mirror height was translated through 500 µm, the mirror angle was adjusted by approximately 0.9 mrad. Here, we define the beam width as the root mean square (RMS) normalized intensity distribution, where and are respectively the horizontal and vertical coordinates on the focal plane, is the intensity centroid position, and is the normalized intensity, . The summation is taken over pixels within the region of interest, after subtraction of background noise, with and being the position and normalized intensity of the pixel in the ’th row and ’th column.The measured beam width as a function of mirror height for this procedure is shown in Fig. 4. The minimum of this curve indicates the optimal height and corresponding pitch angle of the mirror. After setting the mirror to these values, the beam width was reduced to 3.7 µm. The true width of the beam is much less than this value. The beam observed on the YAG is significantly broadened due to the resolution of the CCD microscope system.12 The effective resolution of a few microns is sufficient for the purposes of this alignment procedure. Moreover, despite the image resolution being greater than 1 µm, the beam centroid can in fact be known to within 100 nm because it is a weighted average over all pixels. Fig. 4Horizontal beam width versus horizontal mirror height. There is a one-to-one correspondence between mirror height and pitch. The given values for mirror height are raw motor values. 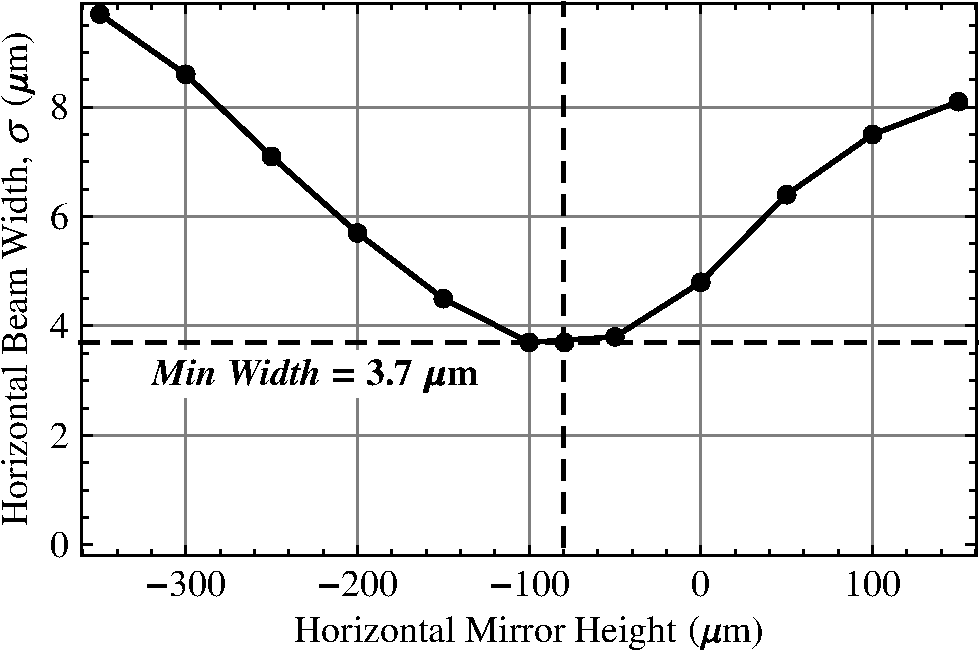 After setting the height and pitch of the horizontally focusing mirror, we optimized the tangential surface figure by making small adjustments to the benders. The upstream vertical scanning slit was closed to a width of 50 µm to illuminate a longitudinal section of the mirror. We found that slit sizes narrower than this do not transmit enough light for reliable measurements. In this configuration, we measured the horizontal centroid of the reflected beam as a function of slit position. In the focal plane, the horizontal distance between the centroid and the focal point is the horizontal ray error. The initially measured horizontal ray error, an average of four sequential measurements, is shown by the dashed curve in Fig. 5(a). Fig. 5(a) Initial (filled circles) and final (squares) measurements of horizontal ray error. Predicted final values (open circles) are also shown. The optimization was performed using linear regression methods developed for tuning bendable mirrors. (b) Characteristic functions of the benders for the horizontally focusing mirror, given in nm of ray error change per μm of motor adjustment. Slit position values are relative. 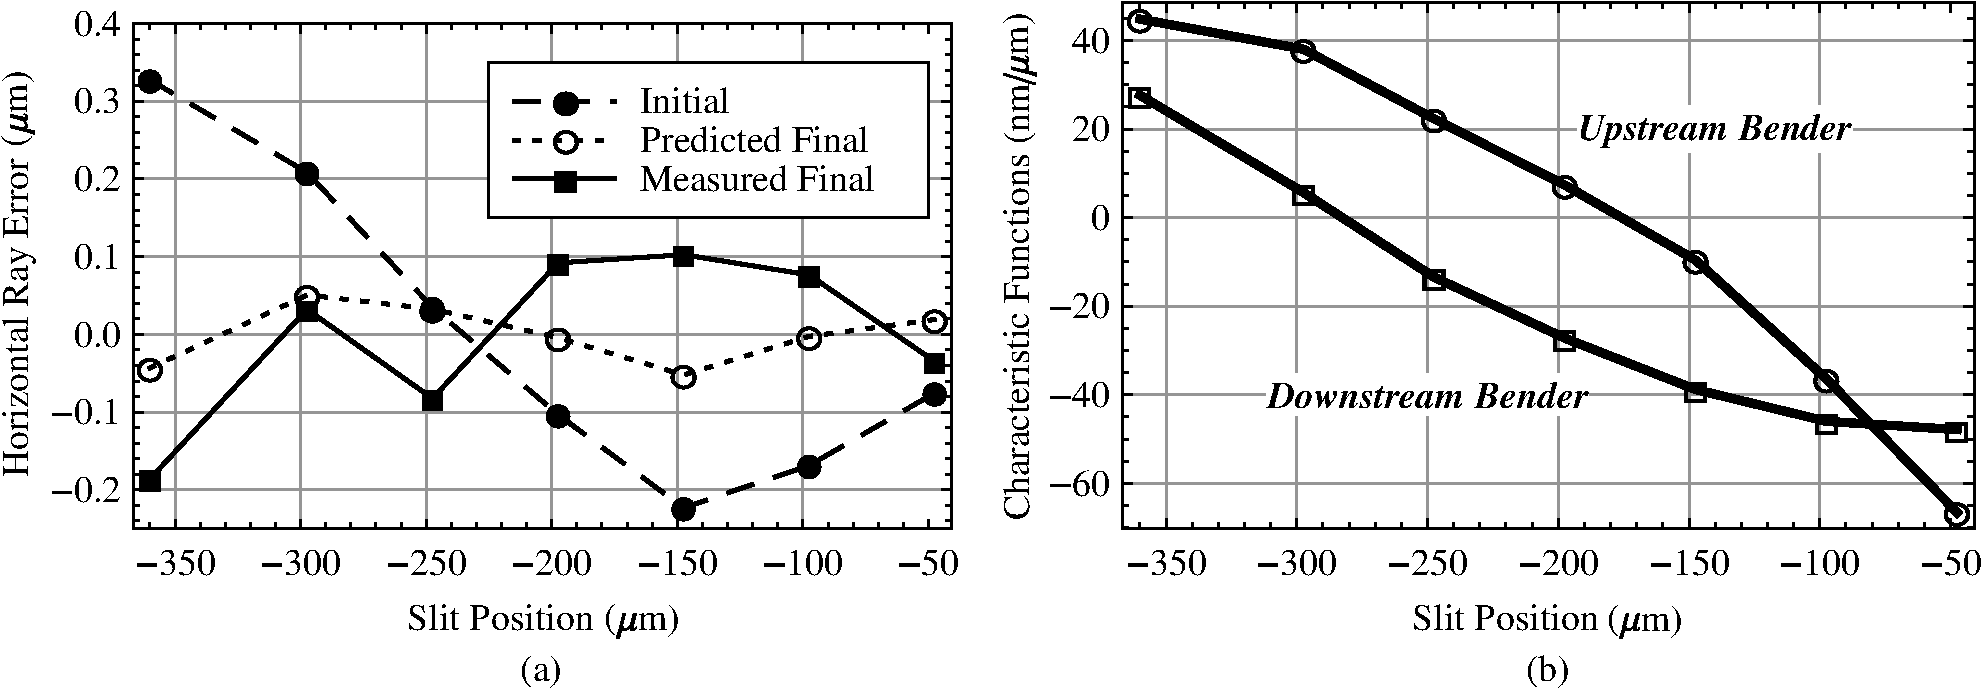 The characteristic functions of the two benders with respect to ray error are shown in Fig. 5(b). They are given by the point-by-point difference in ray error with respect to a unit change of the corresponding bender motor. We assume that the response of the ray error to changes of bender motors is approximately linear for a sufficiently small range of adjustment. Then linear regression18,24 predicts a final minimized ray error given by the dotted curve in Fig. 5(a), corresponding to a change of to the upstream bender motor and to the downstream bender motor. After applying these changes to the bender motors, we observed the final minimized ray error given by the solid curve in Fig. 5(a). The RMS variation of ray error in the initial measurement was 202 nm, while the RMS variation in the final measurement was 81 nm. This final value is at the level of the estimated uncertainty of the horizontal centroid, which was 80 nm, indicating that the benders have been set to the maximum precision allowed by this technique. With the horizontally focusing mirror well aligned and tuned for focusing, the vertically focusing mirror was also adjusted independently with the same procedure. This mirror was reinserted into the beam path, and a 4 µm diameter circular pinhole served as the object for 2-D focusing. First, the height and pitch alignment was performed for the vertically focusing mirror. Figure 6 shows the measured beam width as a function of mirror height. In the improved configuration the vertically focusing mirror produced a minimum vertical beam width of 4.9 µm. Fig. 6Vertical beam width versus vertical mirror height. There is a one-to-one correspondence between mirror height and pitch. The given values for mirror height are raw motor values. 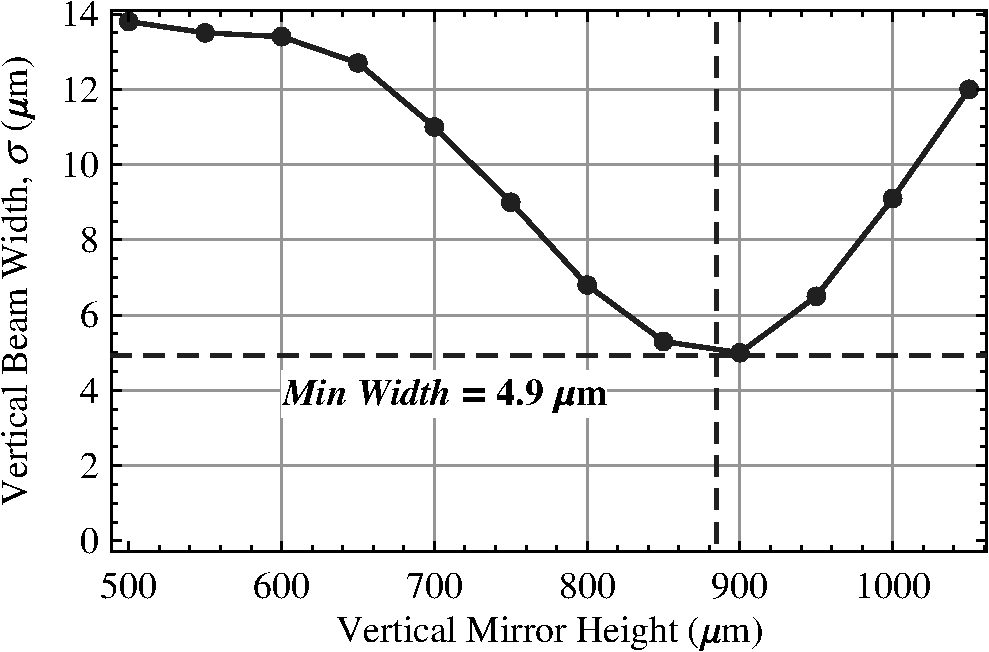 The benders of the vertically focusing mirror were optimally tuned in the same way as described for the horizontally focusing mirror. The horizontal upstream scanning slit was closed to a width of 100 µm to illuminate a section of the mirror. This was the minimum width that allowed sufficient illumination for clear observation of the reflected beam. To improve the measurement in the presence of low signal intensity, we doubled the density of sample points in the scan. The initially measured vertical ray error is shown as the dashed curve in Fig. 7(a). After measuring the characteristic functions of both benders, plotted in Fig. 7(b), we used linear regression to calculate and apply the optimal bender settings, resulting in the final minimized ray error, shown as the solid curve in Fig. 7(a). This is comparable to the predicted final ray error, shown as the dotted curve. Alignment reduced the RMS vertical ray error from 109 nm to 36 nm. This value is within the 50 nm uncertainty for the vertical beam centroid position, estimated from repeated identical measurements. Fig. 7(a) Initial (filled circles) and final (squares) measurements of vertical ray error. Predicted final values (open circles) are also shown. The optimization was performed using linear regression methods developed for tuning bendable mirrors. (b) Characteristic functions of the benders for the vertically focusing mirror, given in microns of ray error change per micron of motor adjustment.  4.Knife-Edge Measurement of Beam WaistWe quantitatively verified the focusing performance of this KB mirror system using the scanning Foucault knife-edge test. An opaque half-plane, or knife-edge, was passed transversely through the beam in steps across the beam foeus. At each step the total transmitted flux is recorded as a function of the position of the knife-edge. This test yields information about the intensity distribution across the focal plane. Because the result of this test is essentially the integral of the intensity profile along the scan direction, calculations of beam width are usually made indirectly. Sometimes the 10–90% or 20–80% widths are given, referring to the flux profile directly. This has the drawback that it does not relate to the intensity distribution in a rigorous way. Another evaluation of the intensity distribution is done by fitting the flux data to some assumed functional form, such as an error function (i.e., assuming a Gaussian profile15), and then taking the derivative, based on the fit. The downside of this approach is that the beam intensity distribution may not match the assumed form. Here we provide a general method for computing the statistical moments of the intensity profile directly from the flux data. The same approach is used in the horizontal and vertical directions independently. Let be the normalized intensity, with the flux being its integral , as a function of the horizontal or vertical distance . In practice, both of these functions are defined only within some measurable interval , such as the range of knife-edge positions covered by a scan of measurements. Then by definition, we have . The th order raw moment of the distribution function is defined as Integration by parts yields Using the equalities and , Eq. (5) can be reduced to Then, for the intensity profile of the beam, an unambiguous measure of width is the RMS, This relation provides a direct a way of estimating the width of the beam intensity profile from measurements of the transmitted flux as a function of knife-edge position. It is important that the knife-edge step size be small relative to the beam width, or to spatial fluctuations in the intensity, to ensure that the integrals are accurately estimated by interpolating functions between data points.We performed horizontal and vertical knife-edge scans using the downstream soft x-ray CCD camera as the detector because of its high sensitivity. To measure the horizontal width of the beam in the focal plane, we scanned the vertical knife-edge horizontally through the beam while measuring the total transmitted flux. The transmitted flux is measured by taking the sum of counts over all pixels in the full-beam footprint on the CCD camera, after suitable background subtraction. The measured flux as a function of the horizontal position of the knife-edge in the focal plane is presented in Fig. 8. The range of knife-edge positions spanned 3 μm, covered in 50 nm steps. Using Eq. (7) and generating the function from a cubic-spline interpolation between data points, the horizontal RMS width of the beam was found to be 290 nm. The dashed curve in Fig. 8 is the best fit error function, whose derivative has an RMS width of 220 nm. The discrepancy comes from the broader tails of the measured distribution, which are not well represented by the error function’s assumed Gaussian intensity profile. These broader tails are expected for a true Airy pattern, suggesting that the observed intensity profiles correspond to that of a nearly diffraction-limited focused beam. Fig. 8Transmitted flux as a function of horizontal position of knife-edge. The dashed curve shows the error function which best fits the data. 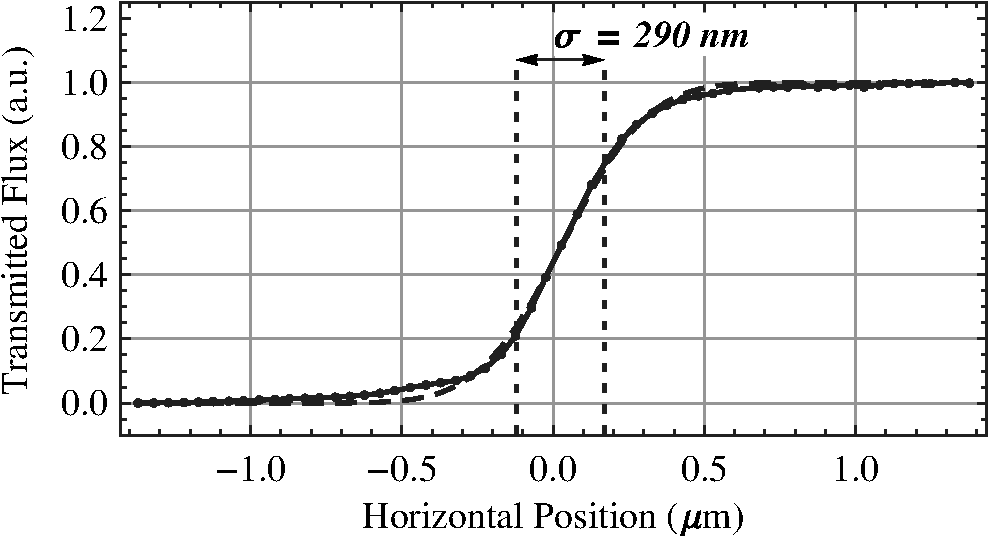 The vertical width of the beam at the focus was measured in the same way. The horizontal knife-edge was scanned vertically through the beam across the focal plane, in steps of 50 nm through a range of 2 µm. The observed transmitted flux as a function of vertical position of the knife-edge is shown in Fig. 9. Here the RMS vertical width of the beam profile is 130 nm. Fig. 9Transmitted flux as a function of vertical position of knife-edge. The dashed curve shows the error function which best fits the data. 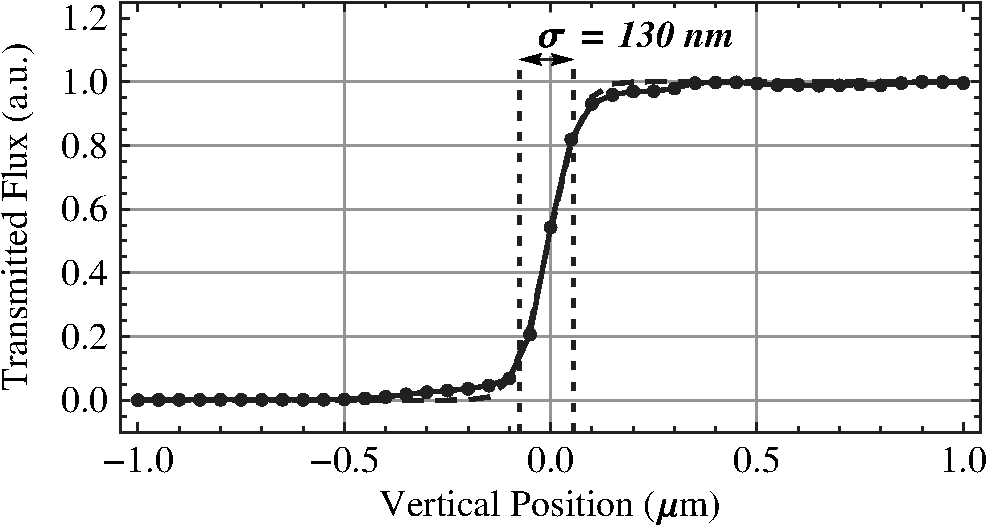 In summary, knife-edge measurements show a focused beam waist size of . This can be compared to the estimated diffraction-limited beam waist size of . 5.Shearing Interferometer for High-Sensitivity Wavefront FeedbackLateral shearing interferometry offers a more sensitive measurement of optical aberrations than the techniques described above. It can be much quicker than the scanning slit technique because only a single camera exposure is required, and a sensitive, direct detection soft x-ray CCD can be used. While the scanning slit method for alignment is ultimately 1-D, the lateral shearing interferometer provides complete 2-D information about the focusing system. Furthermore, the increased spatial resolution in the wavefront offered by shearing gives clearer insight into quality of the focused beam. The procedure we propose for this purpose is similar to that given above for setting the mirror benders, with the exception that instead of seeking minimal ray error, one seeks minimal wavefront error. This method was previously demonstrated in 1-D for the optimization of the same vertically focusing KB mirror.15 The lateral shearing interferometer is composed of a 2-D cross grating, at some distance downstream of the focal point, and a CCD camera placed in the beam some larger distance from the grating. Both the grating and the CCD are inclined to be normal to the central ray. Let be any integer, the period of the grating, and the wavelength of illumination. Then under the condition, the Talbot effect25 is observed; a magnified self-image of the grating forms on the CCD. If the beam is a perfect spherical wave, then the self-image, within the paraxial wave approximation, is perfect. Wavefront aberrations locally deform the self-image in proportion to the slope error. With the CCD camera placed 1.5 m downstream of focus, the first () Talbot plane (where the grating should be placed) is approximately . Using gratings with periods from 4 to 8 μm and soft x-rays of wavelength , we have .The self-image of the square wave transmission grating is formed on the CCD by the large number of overlapping diffracted orders emanating from the grating, rotated in succession by an angle . The dominant contributions to the observed intensity pattern across the CCD as a function of Cartesian coordinates and are given by the overlapping zeroth and first order beams, where is the wavefront displacement of the zeroth order beam, is the shear distance, and , , & are constants (or slowly varying terms in the presence of noise and inhomogeneous illumination). We applied well-known Fourier transform-based phase retrieval methods26–40 to obtain the directional derivatives of the wavefront, This approach assumes that the shear distance is much smaller than the characteristic length scales of wavefront aberrations across the CCD, and . It is easy to see that an equivalent restriction is , using the expression for shear distance provided above and the gradient operator . That is, the wavefront slope aberrations must be initially small, much less than 2 µrad in our case, in order to assume accurate wavefront reconstruction with the lateral shearing interferometer. Provided that the surface slope of the focusing mirrors is within 1 µrad of the desired elliptical figure, this criterion is easily met.The wavefront is obtained from its measured derivatives in the frequency domain. More detailed approaches41,42 can be taken to obtain the wavefront, using more accurate descriptions of the shearing measurement. However, we found the following simplified analysis to be sufficient for this work. Let the Fourier transform of the derivatives and be and , respectively, with conjugate variables . Then the Fourier transform of the function is, to within an arbitrary additive constant, If the CCD pixel density is above the Nyquist sampling rate for the wavefront function , then its Fourier transform coincides with the discrete Fourier transform of its uniformly spaced samples.43 We can therefore apply Eqs. (9) to (11) to obtain the wavefront from its derivatives, which are recovered from the observed interferogram. Based on a comparison of repeated wavefront measurements, the precision of the overall wavefront retrieval method with 1 nm illumination is on the level of 0.1 nm.When the KB mirror system was configured nearly optimally (but prior to applying the procedures of Sec. 3), a shearing interferometer measurement was made and is illustrated by Fig. 10. Figure 10(a) is the (intensity-inverted) self-image of a grating, as viewed on the downstream CCD camera. This grating, with a period of 6 µm, was placed a distance of downstream of the effective focus of the beam. To find the best position for self-imaging, we varied the grating distance by several mm about this value until the best contrast was observed. We applied the wavefront recovery approach described above to obtain the estimated wavefront, illustrated by the contour plot in Fig. 10(b). The grating was rotated by a small angle, but this can be accounted for in the wavefront reconstruction by an appropriate transformation of derivatives. Figure 10(c) shows the residual wavefront error after subtracting the best fitting sphere () from the recovered wavefront. The peak-to-valley magnitude of wavefront error is 2.1 nm, and the RMS value is 0.5 nm. Figure 10 indicates significant 0–90 deg astigmatism of the focused beam, which may be compensated by adjusting the benders of both mirrors. Fig. 10Wavefront measurements from lateral shearing interferometry. (a) The measured interference pattern, (b) the recovered wavefront of the zeroth order beam, and (c) the difference between this wavefront and a perfect sphere. 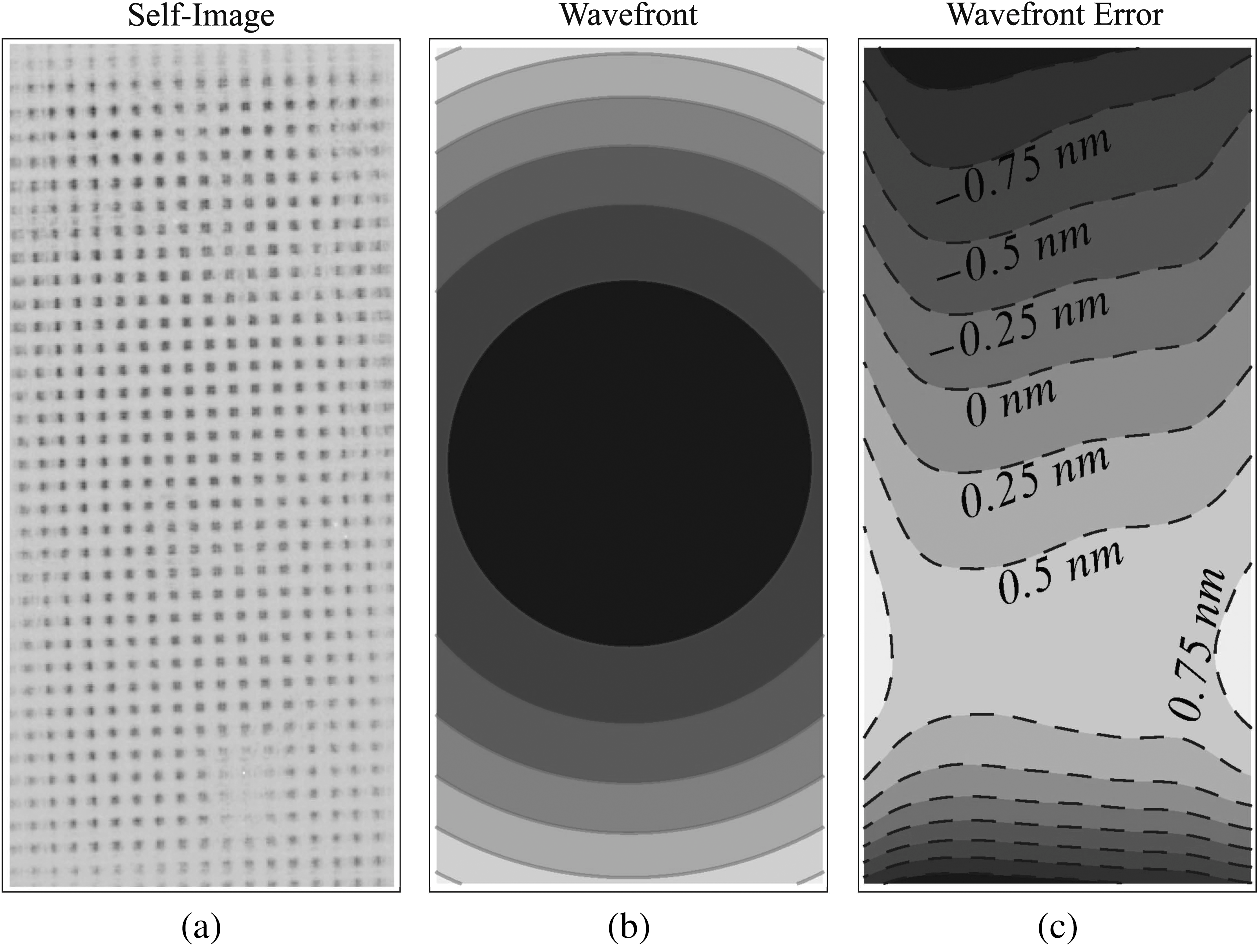 To perform fine alignment using shearing interferometry, we measured the characteristic functions of all four benders. Each bender is actuated in turn, and the normalized characteristic functions (per unit of actuation) are revealed in the wavefront differences. The contour plots in Fig. 11 illustrate the measured characteristic functions. Each bender produces similar results, with cylindrical defocus being the primary change. Yet the relative displacement of these shapes along the mirror surface reveals that third order wavefront shape changes are also controllable. Fig. 11Wavefront-based characteristic functions of the four mirror benders. From left to right: upstream and downstream benders of the horizontally (Horiz.) focusing mirror, and upstream and downstream benders of the vertically (Vert.) focusing mirror. Characteristic functions shown here are normalized to facilitate comparison. 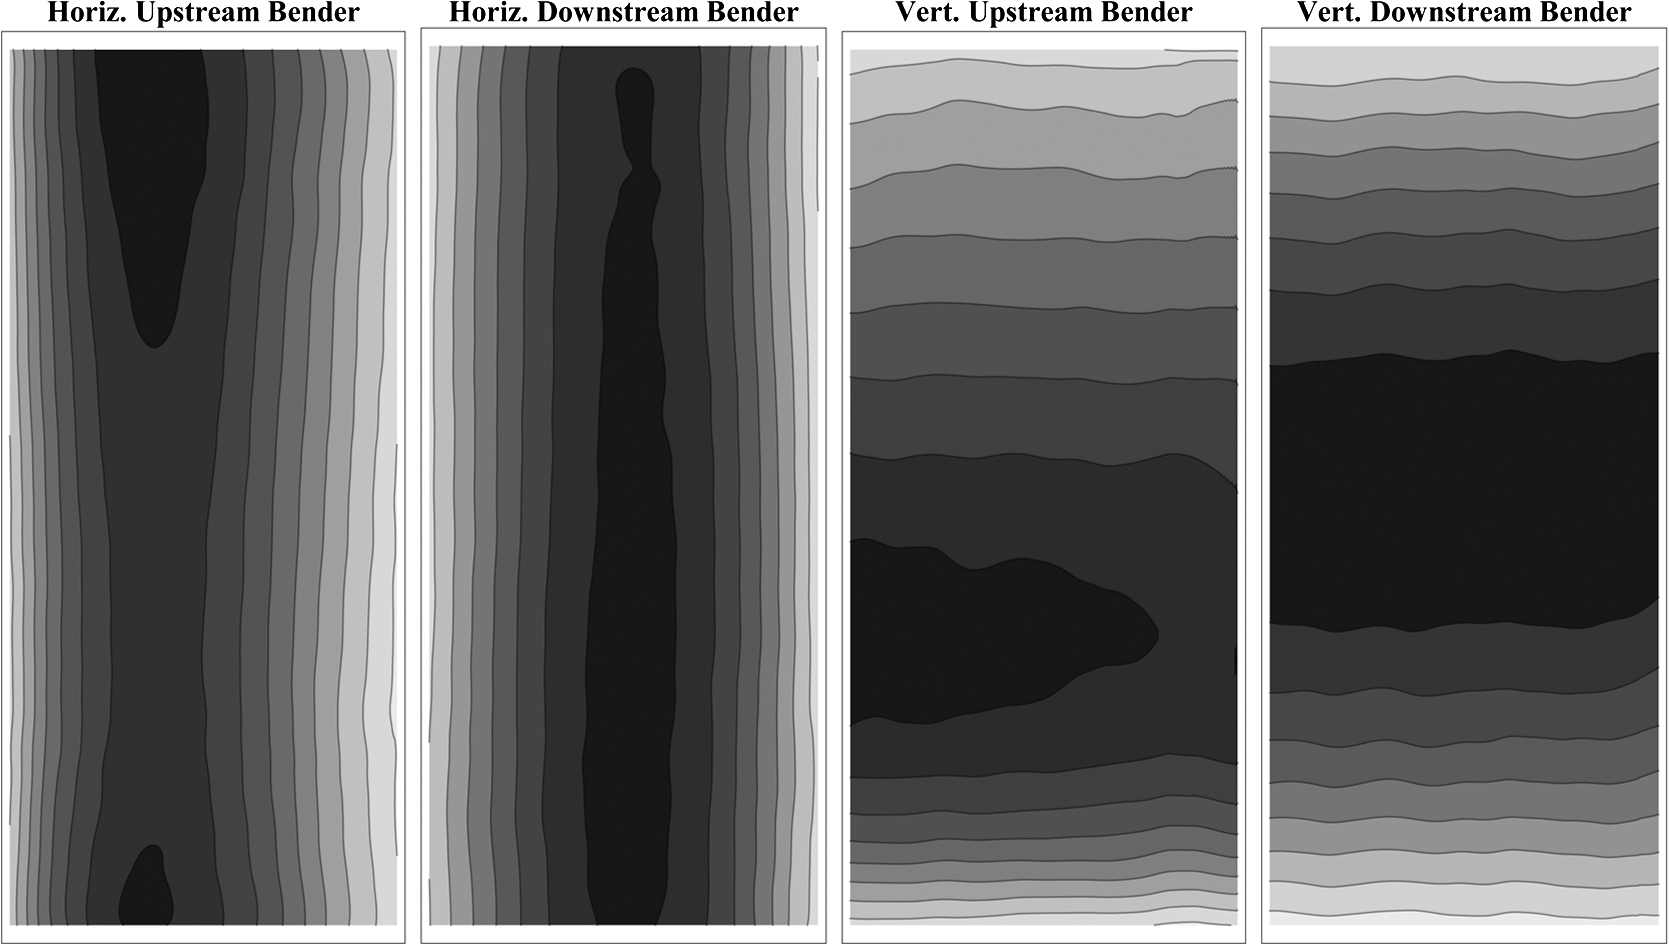 Taking advantage of the high sensitivity of the shearing interferometer, we also measured the effect of rolling one of the mirrors with respect to the other. The contour plot in Fig. 12 illustrates the observed change of recovered wavefront after a small change of the roll motor of the horizontally focusing mirror. Because of the grazing-incidence geometry of the KB mirrors, we expected that rolling the vertically focusing mirror in the opposite direction would have roughly the same effect. The result of this relative roll misalignment is the introduction of 0–90 deg astigmatism. Based on the mirror bender characteristic functions presented in Fig. 11, this aberration could be compensated, at least in part, by suitable adjustments to the benders. However, if the relative roll of the mirrors is allowed to vary in situ, this establishes a certain degree of indeterminacy in the solutions for the optimal bender settings found by linear regression analysis. It is for this reason that we recommend avoiding this difficulty by presetting the roll alignment of the mirrors to a high precision ex situ, and considering this parameter as fixed during in situ alignment. Fig. 12Normalized wave-front-based characteristic functions of the relative roll angle of the KB mirrors. 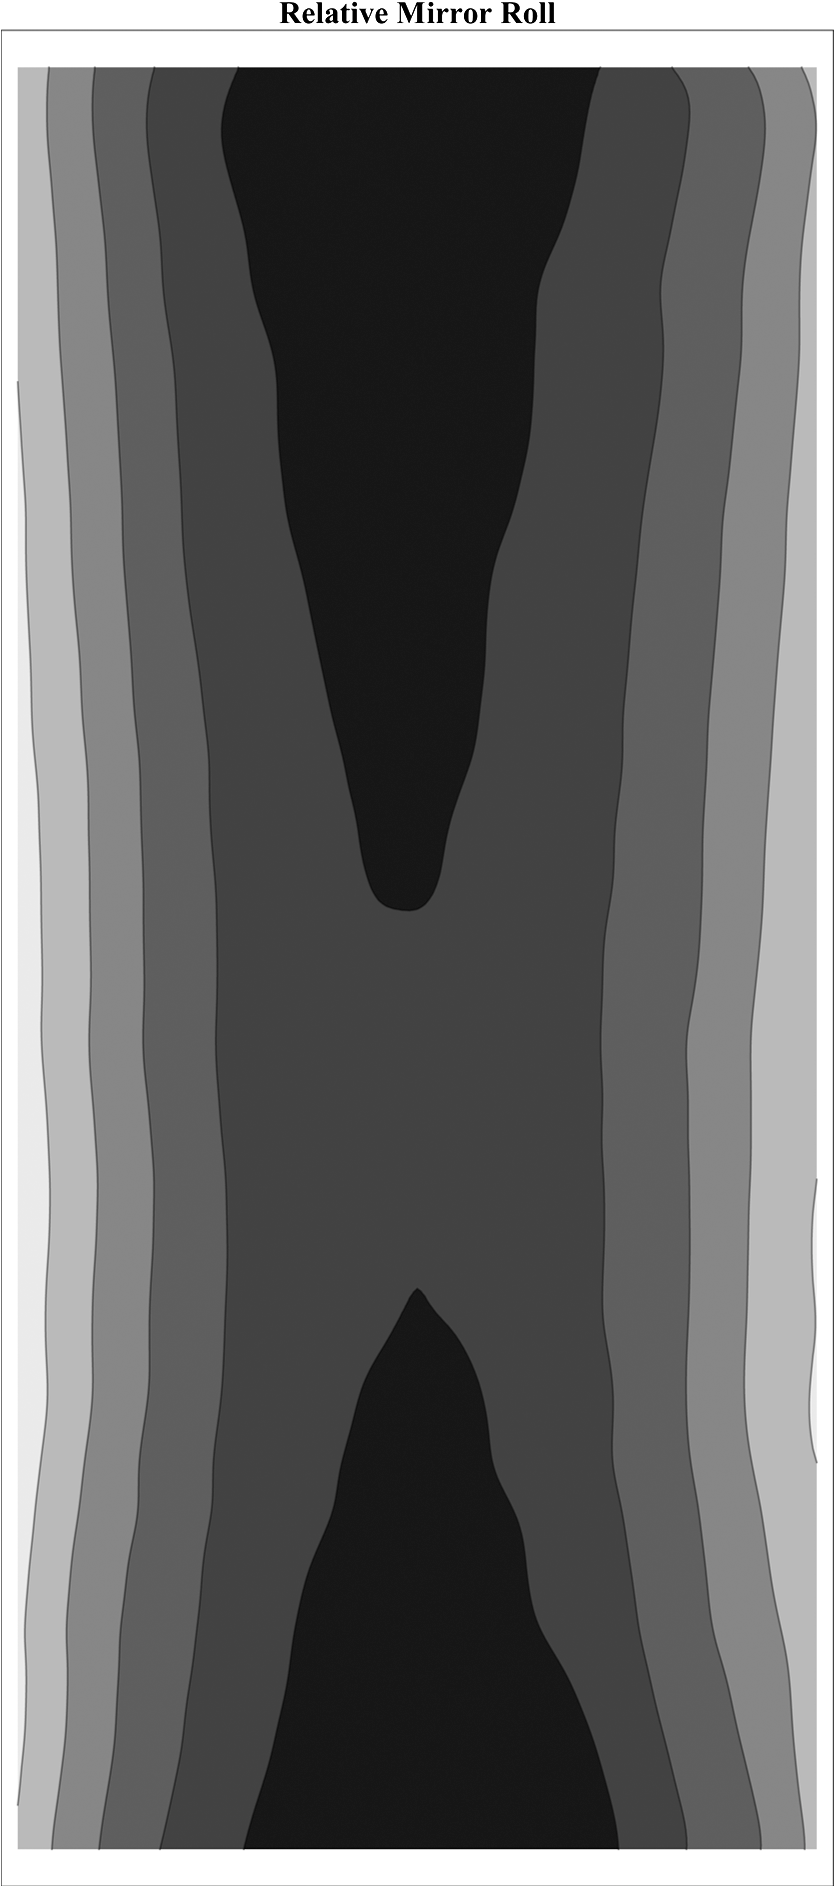 The 2-D at-wavelength metrology information revealed by the lateral shearing interferometer makes it a promising tool for the optimization of bendable focusing optics. Beam-time constraints limited our ability to fully realize the optimization with shearing interferometry, beyond the wavefront shown in Fig. 10. However, this route for further optimization may be beneficial to this and future adaptive optical systems. 6.ConclusionsAt the ALS, we are developing and demonstrating a variety of in situ at-wavelength metrology techniques for synchrotron beamlines and short wavelength optical systems. Building upon our previous work with 1-D focusing, we have established an effective methodology for ex situ and in situ alignment and tuning of a KB mirror pair, resulting in nearly diffraction-limited focusing of soft x-rays. This methodology incorporates accessible technologies and straightforward analyses and we believe it is broadly applicable to many existing synchrotron beamlines and those of next generation synchrotron light sources. Central to the success of the interferometric techniques is the creation of a high quality reference wavefront in the object plane. If the beam illuminating the focusing optics is not well conditioned to begin with, such as having a large beam size or low spatial coherence, then diffraction-limited focusing will never be possible, and the effectiveness of shearing tests will be limited. Such cases may be better served by Hartmann tests. Other essential factors were the incorporation of numerous degrees of freedom in the mirror mounts, with feedback, including the ability to tilt, roll, and bend the mirrors, and to position them into or out of the beam. As we expanded our mirror optimization and testing program from 1-D to 2-D focusing, the techniques remained similar, except for the challenging requirement that the two mirrors independently focus to the same plane. The methods we applied have relative strengths and weaknesses. The scanning slit method can be applied to large aberrations present during coarse alignment. It enables fine control of the ray error across the mirror surfaces, yet in practice its accuracy was limited by low flux and by the visible-light microscope used to image the beam. The knife-edge test provides unambiguous measurement of the beam width in the directions orthogonal to the edges. The drawback is the long time required for this measurement, allowing instrument drifts and other temporal instabilities to significantly affect results. Finally, shearing interferometry demonstrates high sensitivity and rapid measurement capabilities when the mirrors are close to their final alignment state. Small-scale demonstrations such as this serve as a model for how the techniques could be applied to existing and future applications where nearly diffraction-limited performance is required. These can include fourth-generation synchrotron and free-electron laser systems, where brightness and wavefront preservation is critical. Future work will include the exploration of the sensitivity limitations of these techniques, and their application at different beam energies and NA values, where material selection and nanofabrication may not be as straightforward. AcknowledgmentsThe ALS is supported by the Director, Office of Science, Office of Basic Energy Sciences, Material Science Division, of the U.S. Department of Energy under Contract No. DE-AC02-05CH11231 at Lawrence Berkeley National Laboratory. This work was supported by the Laboratory Directed Research and Development Program of Lawrence Berkeley National Laboratory. This document was prepared as an account of work sponsored by the United States Government. While this document is believed to contain correct information, neither the United States Government nor any agency thereof, nor The Regents of the University of California, nor any of their employees make any warranty, express or implied, or assume any legal responsibility for the accuracy, completeness, or usefulness of any information, apparatus, product, or process disclosed, or represent that its use would not infringe privately owned rights. Reference herein to any specific commercial product, process, or service by its trade name, trademark, manufacturer, or otherwise, does not necessarily constitute or imply its endorsement, recommendation, or favoring by the United States Government or any agency thereof, or The Regents of the University of California. The views and opinions of authors expressed herein do not necessarily state or reflect those of the United States Government or any agency thereof or The Regents of the University of California. ReferencesH. Mimuraet al.,
“Hard x-ray diffraction-limited nanofocusing with Kirkpatrick-Baez mirrors,”
Jpn. J. Appl. Phys., 44
(18), L539
–L542
(2005). http://dx.doi.org/10.1143/JJAP.44.L539 JJAPA5 0021-4922 Google Scholar
H. Yumotoet al.,
“At-wavelength figure metrology of hard x-ray focusing mirrors,”
Rev. Sci. Instr., 77
(6), 063712
(2006). http://dx.doi.org/10.1063/1.2216870 RSINAK 0034-6748 Google Scholar
H. Mimuraet al.,
“Efficient focusing of hard x-rays to 25 nm by a total reflection mirror,”
Appl. Phys. Lett., 90
(5), 051903
(2007). http://dx.doi.org/10.1063/1.2436469 APPLAB 0003-6951 Google Scholar
H. Mimuraet al.,
“Breaking the 10 nm barrier in hard-x-ray focusing,”
Nat. Phys., 6
(2), 122
–125
(2010). http://dx.doi.org/10.1038/nphys1457 NPAHAX 1745-2473 Google Scholar
K. Yamauchiet al.,
“Single-nanometer focusing of hard x-rays by Kirkpatrick-Baez mirrors,”
J. Phys. Condens. Matter, 23
(39), 394206
(2011). http://dx.doi.org/10.1088/0953-8984/23/39/394206 JCOMEL 0953-8984 Google Scholar
P. Mercèreet al.,
“Hartmann wave-front measurement at 13.4 nm with accuracy,”
Opt. Lett., 28
(17), 1534
–1536
(2003). http://dx.doi.org/10.1364/OL.28.001534 OPLEDP 0146-9592 Google Scholar
P. Mercèreet al.,
“Automatic alignment of a Kirkpatrick-Baez active optic by use of a soft-x-ray Hartmann wavefront sensor,”
Opt. Lett., 31
(2), 199
–201
(2006). http://dx.doi.org/10.1364/OL.31.000199 OPLEDP 0146-9592 Google Scholar
P. Mercèreet al.,
“Wavefront closed-loop correction for x-ray microfocusing active optics,”
AIP Conf. Proc., 879 722
–725
(2007). http://dx.doi.org/10.1063/1.2436164 APCPCS 0094-243X Google Scholar
C. M. Kewishet al.,
“Wave-optical simulation of hard x-ray nanofocusing by precisely figured elliptical mirrors.,”
Appl. Opt., 46
(11), 2010
–2021
(2007). http://dx.doi.org/10.1364/AO.46.002010 APOPAI 0003-6935 Google Scholar
C. M. Kewishet al.,
“Reconstruction of an astigmatic hard x-ray beam and alignment of K-B mirrors from ptychographic coherent diffraction data,”
Opt. Express, 18
(22), 23420
–23427
(2010). http://dx.doi.org/10.1364/OE.18.023420 OPEXFF 1094-4087 Google Scholar
P. KirkpatrickA. V. Baez,
“Formation of optical images by x-rays,”
J. Opt. Soc. Am., 38
(9), 766
–774
(1948). http://dx.doi.org/10.1364/JOSA.38.000766 JOSAAH 0030-3941 Google Scholar
S. Yuanet al.,
“At-wavelength optical metrology development at the ALS,”
Proc. SPIE, 7801 78010D
(2010). http://dx.doi.org/10.1117/12.859946 PSISDG 0277-786X Google Scholar
S. Yuanet al.,
“First experiment of x-ray at-wavelength metrology and mirror alignment at Beamline 5.3.1,”
Light Source Beamline (LSBL) Notes, LSBL-1018
(2010). Google Scholar
S. Yuanet al.,
“Development of in situ, at-wavelength metrology for soft x-ray nano-focusing,”
Nucl. Instrum. Meth. A, 649
(1), 160
–162
(2011). http://dx.doi.org/10.1016/j.nima.2010.10.134 NIMAER 0168-9002 Google Scholar
D. J. Mertheet al.,
“An experimental apparatus for diffraction-limited soft x-ray nano-focusing,”
Proc. SPIE, 8139 813907
(2011). http://dx.doi.org/10.1117/12.894116 PSISDG 0277-786X Google Scholar
W. R. McKinneyet al.,
“New procedures for the adjustment of elliptically bent mirrors with the long trace profiler,”
Proc. SPIE, 6704 67040G
(2007). http://dx.doi.org/10.1117/12.736860 PSISDG 0277-786X Google Scholar
J. L. Kirschmanet al.,
“Performance of the upgraded LTP-II at the ALS Optical Metrology Laboratory,”
Proc. SPIE, 7077 70770A
(2008). http://dx.doi.org/10.1117/12.796335 PSISDG 0277-786X Google Scholar
W. R. McKinneyet al.,
“Optimal tuning and calibration of bendable mirrors with slope-measuring profilers,”
Opt. Eng., 48
(8), 083601
(2009). http://dx.doi.org/10.1117/1.3204235 OPEGAR 0091-3286 Google Scholar
W. R. McKinneyet al.,
“Studies in optimal configuration of the LTP,”
Proc. SPIE, 7801 780106
(2010). http://dx.doi.org/10.1117/12.861401 PSISDG 0277-786X Google Scholar
W. R. McKinneyet al.,
“Design optimization of bendable x-ray mirrors,”
Proc. SPIE, 8141 81410K
(2011). http://dx.doi.org/10.1117/12.894175 PSISDG 0277-786X Google Scholar
S. Yuanet al.,
“Elliptically bent x-ray mirrors with active temperature stabilization,”
X-Ray Opt. Instrum., 2010 784732
(2010). http://dx.doi.org/10.1155/2010/784732 XOIRA2 1687-7632 Google Scholar
M. R. HowellsD. Lunt,
“Design considerations for adjustable-curvature, high-power, x-ray mirrors based on elastic bending,”
Opt. Eng., 32
(8), 1981
–1989
(1993). http://dx.doi.org/10.1117/12.146391 OPEGAR 0091-3286 Google Scholar
M. R. Howellset al.,
“Theory and practice of elliptically bent x-ray mirrors,”
Opt. Eng., 39
(10), 2748
–2762
(2000). http://dx.doi.org/10.1117/1.1289879 OPEGAR 0091-3286 Google Scholar
O. HignetteA. K. FreundE. Chinchio,
“Incoherent x-ray mirror surface metrology,”
Proc. SPIE, 3152 188
–199
(1997). http://dx.doi.org/10.1117/12.295559 PSISDG 0277-786X Google Scholar
H. F. Talbot,
“LXXVI. Facts relating to optical science. No. IV,”
Philosoph. Mag. Ser. 3, 9
(56), 401
–407
(1836). http://dx.doi.org/10.1080/14786443608649032 Google Scholar
V. Ronchi,
“Forty years of history of a grating interferometer,”
Appl. Opt., 3
(4), 437
–438
(1964). http://dx.doi.org/10.1364/AO.3.000437 APOPAI 0003-6935 Google Scholar
J. Schwider,
“Single sideband Ronchi test,”
Appl. Opt., 20
(15), 2635
–2642
(1981). http://dx.doi.org/10.1364/AO.20.002635 APOPAI 0003-6935 Google Scholar
D. J. BoneH.-A. BachorR. J. Sandeman,
“Fringe-pattern analysis using a 2-D Fourier transform,”
Appl. Opt., 25
(10), 1653
–1660
(1986). http://dx.doi.org/10.1364/AO.25.001653 APOPAI 0003-6935 Google Scholar
M. TakedaH. InaS. Kobayashi,
“Fourier-transform method of fringe-pattern analysis for computer-based topography and interferometry,”
J. Opt. Soc. Am., 72
(1), 156
–160
(1982). http://dx.doi.org/10.1364/JOSA.72.000156 JOSAAH 0030-3941 Google Scholar
C. RoddierF. Roddier,
“Interferogram analysis using Fourier transform techniques,”
Appl. Opt., 26
(9), 1668
–1673
(1987). http://dx.doi.org/10.1364/AO.26.001668 APOPAI 0003-6935 Google Scholar
K. OmuraT. Yatagai,
“Phase measuring Ronchi test,”
Appl. Opt., 27
(3), 523
–528
(1988). http://dx.doi.org/10.1364/AO.27.000523 APOPAI 0003-6935 Google Scholar
D. Malacara,
“Analysis of the interferometric Ronchi test,”
Appl. Opt., 29
(25), 3633
–3637
(1990). http://dx.doi.org/10.1364/AO.29.003633 APOPAI 0003-6935 Google Scholar
M. ServinD. MalacaraJ. L. Marroquin,
“Wave-front recovery from two othogonal sheared interferograms,”
Appl. Opt., 35
(22), 4343
–4348
(1996). http://dx.doi.org/10.1364/AO.35.004343 APOPAI 0003-6935 Google Scholar
K. Hibinoet al.,
“Dynamic range of Ronchi test with a phase-shifted sinusoidal grating,”
Appl. Opt., 36
(25), 6178
–6189
(1997). http://dx.doi.org/10.1364/AO.36.006178 APOPAI 0003-6935 Google Scholar
D. Malacara,
“Measuring the curvature of spherical wavefronts with Talbot interferometry,”
Opt. Eng., 36
(7), 2016
–2024
(1997). http://dx.doi.org/10.1117/1.601387 OPEGAR 0091-3286 Google Scholar
P. P. NaulleauK. A. GoldbergJ. Bokor,
“Extreme ultraviolet carrier-frequency shearing interferometry of a lithographic four-mirror optical system,”
J. Vac. Sci. Technol. B, 18
(6), 2939
–2943
(2000). http://dx.doi.org/10.1116/1.1321290 JVTBD9 0734-211X Google Scholar
K. A. GoldbergJ. Bokor,
“Fourier-transform method of phase-shift determination,”
Appl. Opt., 40
(17), 2886
–2894
(2001). http://dx.doi.org/10.1364/AO.40.002886 APOPAI 0003-6935 Google Scholar
S. VelgheJ. PrimotN. Guerineau,
“Wave-front reconstruction from multidirectional phase derivatives generated by multilateral shearing interferometers,”
Opt. Lett., 30
(3), 245
–247
(2005). http://dx.doi.org/10.1364/OL.30.000245 OPLEDP 0146-9592 Google Scholar
A. Cornejo-Rodriguez,
“Ronchi test,”
Optical Shop Testing, 354
–355 John Wiley & Sons, Hoboken, New Jersey
(1992). Google Scholar
F. J. Torcal-MillaL. M. Sanchez-BreaE. Bernabeu,
“Talbot effect with aberrated beams,”
Proc. SPIE, 7390 739013
(2009). http://dx.doi.org/10.1117/12.827539 PSISDG 0277-786X Google Scholar
K. R. FreischladC. L. Koliopoulos,
“Modal estimation of a wave front from difference measurements using the discrete Fourier transform,”
J. Opt. Soc. Am. A, 3
(11), 1852
–1861
(1986). http://dx.doi.org/10.1364/JOSAA.3.001852 JOAOD6 0740-3232 Google Scholar
A. TalmiE. N. Ribak,
“Wavefront reconstruction from its gradients,”
J. Opt. Soc. Am. A, 23
(2), 288
–297
(2006). http://dx.doi.org/10.1364/JOSAA.23.000288 JOAOD6 0740-3232 Google Scholar
C. E. Shannon,
“A mathematical theory of communication,”
The Bell Sys. Tech. J., 27
(3), 379623
–423656
(1948). BSTJAN 0005-8580 Google Scholar
Biography Daniel J. Merthe attended the University of San Francisco and received a BS in 2009 from the Department of Physics and Astronomy. As an undergraduate researcher, he conducted Doppler-free spectroscopy studies of atomic rubidium. From 2008 to 2010 he worked at Sandia National Laboratories performing spectroscopy of combustion reactions and helping to develop the chemical kinetic models which explain them. Most recently, he has participated in the ongoing development of the 100 nrad slope sensing Advanced Light Source Long Trace Profiler as well as in efforts to establish corresponding at-wavelength metrology techniques for x-ray optics.  Valeriy V. Yashchuk received his MS degree in experimental physics from St. Petersburg State University, Russia, in 1979, and his PhD degree from St. Petersburg Nuclear Physics Institute, Russia, in 1994. He is currently leading the Optical Metrology Laboratory at the Advanced Light Source, Lawrence Berkeley National Laboratory. He has authored and coauthored more than 140 scientific publications in the fields of atomic and molecular physics, nonlinear optics, electro–and magneto-optics, laser spectroscopy, experimental scientific methods and instrumentation, and optical metrology. In 1986 for the development of a method of reduction of phase space of an atomic beam he was awarded the Leningrad Komsomol Prize in physics. In 2007, he received R&D Magazine’s R&D 100 Award for development of Laser-Detected MRI. His current research interest is in x-ray optics, optical instrumentation and metrology for x-ray optics.  Kenneth A. Goldberg is the deputy director of Lawrence Berkeley National Laboratory’s Center for X-ray Optics. He specializes in the development of technologies for EUV and soft x-ray wavelengths, including lithography, mask inspection, and interferometry. He is the principal investigator of the SEMATECH Berkeley Actinic Inspection Tool (AIT), an EUV reticle-imaging microscope; and he is a co-creator of the SEMATECH Berkeley Micro-Exposure Tool (MET). He received an AB degree in physics and applied math, and a PhD in physics from the University of California, Berkeley. He has authored and co-authored over 160 publications, and has received 12 patents.  Martin Kunz received a degree in earth science from the University of Bern (Switzerland) in 1988, and his PhD in mineralogical crystallography in 1991 from the same university. He is currently beamline scientist at the Laue micro-diffraction beamline at the Advanced Light Source (ALS) at Lawrence Berkeley National Laboratory (LBNL). He has (co-)authored more than 150 publications in the fields of mineralogy, materials science, crystal chemistry, high-pressure physics, and scientific instrumentation. He received the European Mineralogical Union Medal for excellence in research in 2004; and he is a chief-editor of the American Mineralogist, one of the most important international journals in the field. His current research is in crystallography at nonstandard conditions, deformation of materials and development of experimental methods.  Nobumichi Tamura received his PhD in materials science from the Institut National Polytechnique de Grenoble, France in 1992. He has authored and coauthored more than 150 publications including book chapters, notably on the development of x-ray microfocus techniques at synchrotron facilities and on the study of the mechanical properties of materials by x-ray diffraction techniques. He is currently a staff scientist at the Advanced Light Source, Lawrence Berkeley National Laboratory, responsible for the development, support and operation of the ALS x-ray microdiffraction beamline.  Wayne R. McKinney received his PhD in physics and ultraviolet astronomy from The Johns Hopkins University, in 1974. Following a post-doctoral appointment in molecular biology in the Biology Department of Brookhaven National Laboratory he designed optical systems for the NSLS. In 1979, he joined the research staff of the Richardson Grating Lab in Rochester New York, becoming Manager of Diffraction Grating R&D in 1981. In 1987, he became a staff scientist in the Center for x-ray Optics at Lawrence Berkeley National Laboratory working on water cooled optical components and monochromator designs for the ALS. He won local and national Tech Transfer Awards, leading to fellow status in the OSA. He now works directly for the Advanced Light Source where he built the first infrared beamlines, and the first ALS spherical grating monochromator. Currently his responsibilities are in optical metrology, particularly the adjustment of bendable x-ray optics.  Nikolay A. Artemiev graduated from the department of Quantum Electronics of the Moscow Engineering-Physical Institute (National Research Nuclear University), in 1993. His PhD Thesis in physics “Study of diffractive-refractive x-ray optics,” was accomplished at the Charles University in Prague, Czech Republic, in 2003. He has worked in the RRC KurchatovInsitute in Moscow; Sincrotrone Trieste in Italy; The Institute of Physics, Academy of Sciences of the Czech Republic; BESSY-II in Berlin, Germany; The Laboratory of Applied Optics, ENSTA, EcolePolytechnique, and Synchrotron Soleil, in France; He currently holds the position of Senior Scientific Engineering Associate at Lawrence Berkeley National Laboratory. His main scientific interests are connected with x-ray optics for Synchrotron Radiation and ultrafast x-ray science. He currently works in the field of optical metrology of x-ray optics for Synchrotron Radiation sources and Free Electron Lasers.  Richard S. Celestre is a senior scientific engineering associate within the Experimental Systems Group at the Advanced Light Source. He has been at the Lawrence Berkeley Lab, since 1991. He is part of the team that has developed and built over ten beamlines at the ALS. He currently is involved in developing novel instrumentation for ALS beamlines and also is the beamline scientist for the Optics Testing and Instrumentation Development Beamline at the ALS.  Gregory Y. Morrison is a senior mechanical engineering associate. He has been at the Lawrence Berkley Lab, since 1980. He was part of the mechanical engineering team that built the ALS and associated beamlines. For the past 10 years, he has provided engineering expertise to the ALS Experimental Systems Group for both prototyping and implementing novel synchrotron instrumentation and optical systems.  Erik H. Anderson attended the Massachusetts Institute of Technology in Cambridge, Massachusetts and received BS in 1981, MS in 1984, and PhD in 1988 all in the Department of Electrical Engineering and Computer Science. He joined Lawrence Berkeley National Laboratory in 1988 and worked as a visiting scientist at the IBM T. J. Watson Research Laboratory in Yorktown Heights, New York developing zone plate optics for x-ray microscopy. In 1993, he moved to Berkeley to build and managed the Nanofabrication facility, within the Center for x-ray Optics. Between 2001 and 2004, he served as the director of the Center for X-ray Optics. He is currently involved in EUV and soft x-ray optics development, characterization, Nanofabrication, and x-ray microscopy.  Brian V. Smith received his BS degree in electrical engineering and computer science from The University of California at Berkeley, in 1980. He has worked in the control and data acquisition field at the Lawrence Berkeley National Laboratory since 1977, first in the Environmental Energy Technologies Division, and for the past 9 years at the Advanced Light Source, as part of the Beamline Controls Section in the ALS Controls Group, working mainly on controls and data acquisition for the beamlines, endstations and measurement systems in the Optical Metrology Laboratory. He has co-authored 28 publications.  Edward E. Domning is the beamline controls section leader at the Advanced Light Source where he has been providing data acquisition and control systems for science experiments, since 2000. Before that he worked in the areas of laser alignment, process control, robotics and automation, pulsed power and, of course, data acquisition and control while working for the Engineering Department at Lawrence Livermore National Laboratory. He received his MS in electrical engineering from U.C. Davis in 1992 and BS in electrical engineering from U.C. Davis, in 1984.  Senajith B. Rekawa is the head of Engineering and Project Management for the Center for X-ray Optics at Lawrence Berkeley National Lab. He received his BS degree in mechanical engineering from the University of Wisconsin at Madison, in 1994. He joined LBNL in 1991 as a summer intern building the Advanced Light Source’s storage ring and beamlines. While going to school, he worked at the Synchrotron Radiation Center in Stoughton Wisconsin designing and fabricating beamline optical systems and mechanical components. He then in 1996 joined CXRO as a staff mechanical engineer primarily working on the EUV lithography program. After leading the efforts of building the first EUV Mask Inspection system and the Micro Exposure tool, he then became the lead engineer for CXRO. He is credited with a Klaus Halbach Award for innovative instrumentation at ALS, and two R&D 100 awards including the editor’s award for most innovative project.  Howard A. Padmore is division deputy for Experimental Systems at the Advanced Light Source, a 3rd generation synchrotron radiation x-ray source at Lawrence Berkeley National Laboratory. He has worked in a large number of areas in synchrotron radiation science and instrumentation, including the design and implementation of optical systems from the soft to the hard x-ray regime and their application to problems in materials science. His current work centers around the development of high efficiency photocathodes for FELs, nano-optics and plasmonics, and optical elements for ultrahigh energy resolution soft x-ray spectroscopy. He has published around 150 papers in the literature and is a fellow of the Optical Society of America. |


