|
|
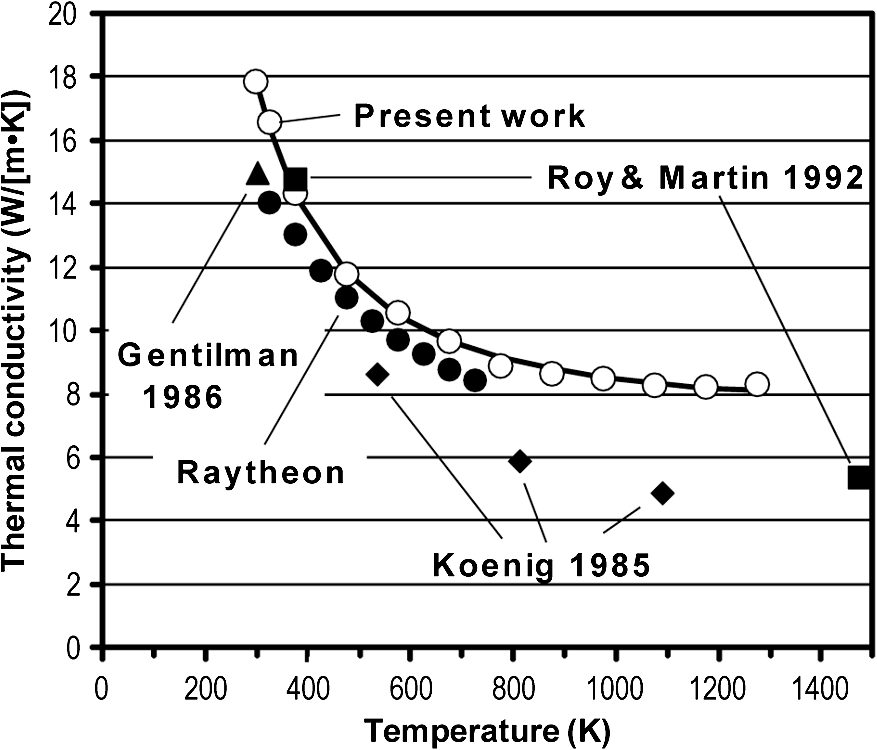
1.IntroductionSapphire, spinel, and aluminum oxynitride (ALON) are the most durable, commercially available midwave infrared (3 to 5 μm) window materials that are candidates for applications requiring environmental durability, such as sand and rain erosion resistance or the ability to operate at elevated temperature.1 All three materials transmit from about 5 μm in the infrared to at least as far as 0.3 μm in the ultraviolet. Wickersham and LaFever2 observed as early as 1960 that spinel has superior transmittance to that of sapphire near 5 μm. Figure 1 compares infrared transmittance of these materials, with the region 4 to 5 μm highlighted. The long wavelength cutoff between 5 and 6 μm increases in the order . Fig. 1Midwave infrared transmittance spectra of ALON (2.86 mm thick polycrystalline material from Surmet, Burlington, MA), spinel (3.01 mm thick polycrystalline material from TA&T, Annapolis, MD), and sapphire (3.02 mm thick single crystal material from GT Advanced Technologies, formerly Crystal Systems, Salem, MA). 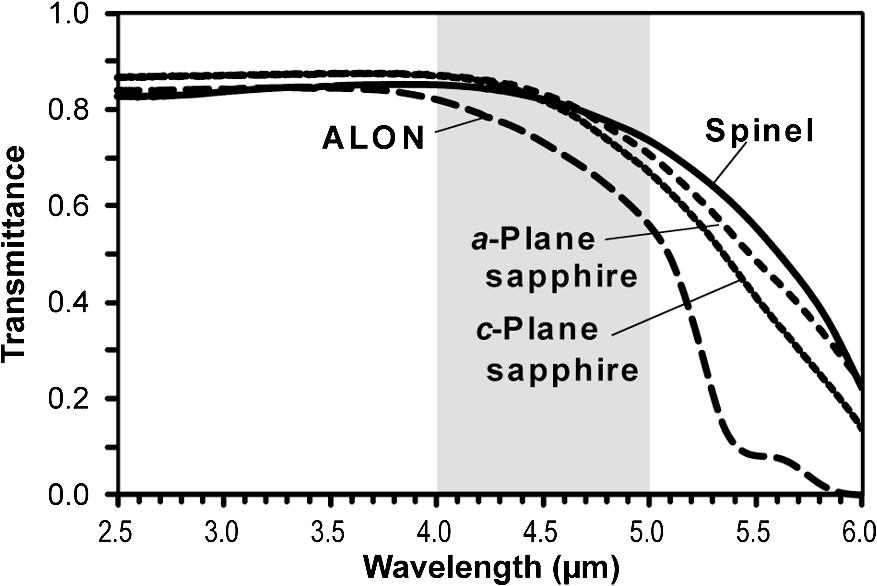 For applications requiring maximum transmittance or minimum optical emittance in the 4 to 5 μm region, it appears from Fig. 1 that spinel would be the best choice if it is the same thickness as sapphire and has sufficient mechanical strength. Sapphire is mechanically stronger than spinel,1 so a thinner sapphire window might be optically superior to a thicker spinel window and still meet mechanical requirements. Of the two commonly available crystal orientations of sapphire, -plane material has less absorption than -plane material.3 However, -plane sapphire has a refractive index anisotropy of 0.001 in the plane of the window, whereas -plane sapphire has an isotropic refractive index in the plane of the window. Optical anisotropy might be an issue for some applications.4 -Plane sapphire is currently available in larger sizes than -plane material, so the choice of crystal plane can be dictated by the required window size. Careful transmittance measurements5,6 of these materials in the 1980s provided input to a computer code called OPTIMATR®, which was available in the 1990s,7,8 but is no longer commercially available. This computer code implements a multioscillator, multiphonon model for the complex refractive index of each material over a range of wavelengths and temperatures.9 The code was used to generate the optical constants and that are listed for ALON,10 spinel,11 and sapphire3 in Palik’s Handbook of Optical Constants of Solids. The code is validated in the region of intrinsic absorption by these materials, but is not meaningful in the transparent window region where absorption can be governed by impurities and defects. We are interested in the relative merits of spinel and sapphire for large sensor windows with lateral dimensions that need high transmittance in the 4 to 5 μm region and must also withstand external pressure. We measured the absorption of some of the highest optical quality currently available spinel and sapphire near 5 μm by laser calorimetry to compare with absorption coefficients measured in the 1980s. Spinel was taken from large area blanks that could be used to make large windows. This paper presents the results of laser calorimetry, as well as new measurements of spectral transmittance, specific heat capacity, refractive index, thermal expansion, thermal conductivity, Young’s modulus, and Poisson’s ratio of spinel. The result is a revision to the OPTIMATR absorption coefficient of spinel in the 4 to 5 μm region. We discuss window design trade between optical absorption and mechanical reliability. 2.ExperimentalPolycrystalline spinel with a grain size of several hundred microns was provided by TA&T (Annapolis, MD) in the form of two polished blocks stated to represent high-optical-quality material. This material is representative of the quality and grain size commercially available today for large area windows with high optical quality. The blocks were cut from plates made by hot pressing followed by hot isostatic pressing. One polished block with a finished thickness of 5.98 mm was cut from a blank with a thickness of 7.4 mm. Another polished block with a finished thickness of 12.76 mm was cut from a blank with a thickness of 14.7 mm. Thermal, mechanical, and optical properties reported in this paper come from the TA&T material. For careful measurements of infrared transmittance, additional samples of polished spinel were provided by TA&T and by MER Corp. (Tucson, AZ). -Plane () and -plane () sapphire were provided by GT Advanced Technology (Salem, MA) (formerly Crystal Systems) from their highest-quality, strain-free, single-crystal material grown by the heat-exchanger method. Boules were grown from aluminum oxide melt stock with a stated purity of 99.996%. Disks for calorimetry were machined and polished to a 10-5 scratch-dig surface finish by Crystal Systems. Specific heat capacity () at constant pressure () is the heat () required to raise the temperature of 1 g of substance by 1 K. Sapphire is a reference material for this measurement (ASTM E1269).12 Duplicate samples of spinel were measured by differential scanning calorimetry at the Thermophysical Properties Research Laboratory (TPRL), West Lafayette, Indiana. Two small compartments were heated electrically at while temperature and electrical heat input were monitored. Samples were disks with a diameter of 5.8 mm and thickness of 1.5 mm with one smooth ground face for thermal contact. Spinel or a sapphire standard was placed in one compartment, while the reference compartment was empty. The differential power required to heat the sample or standard at the same rate as the blank reference pan was determined. From the mass of the standard or sample, the differential power required to heat each item, and the known specific heat capacity of the sapphire standard, the specific heat capacity of the sample was computed. Samples were measured in a PerkinElmer DSC 4 differential scanning calorimeter from 23 to 500°C under Ar and then in a Netzsch DSC 404 from 23 to 1000°C under Ar. Results from two samples, which had an average difference of 0.3 to 1% at each temperature, were averaged to obtain the specific heat capacity. Thermal expansion of spinel was measured at the TRPL by ASTM standard testing procedure E228 with a dual push-rod dilatometer (Theta Dilatronics II). Test specimens were parallelepipeds with flat, parallel, ground ends. The differential expansion between a test specimen and a reference material was measured at 10-deg intervals from 20 to 1000°C during warming and then from 1000 to 200°C during cooling. Expansion of the test specimen was computed from this differential expansion and the known expansion of the standard. Six standards from the National Institute of Standards and Technology (NIST) included materials with low, moderate, and large expansions. For calibration and checkout, one standard was measured against another standard. Thermal diffusivity of spinel was measured at the TRPL by the laser flash method (ASTM E1461). In this method, the front face of a disk is subjected to a short laser burst and the rear face temperature rise is recorded and analyzed. Ceramic disk samples with parallel, fine ground faces had a diameter of 12.7 mm and thickness of 2.54 mm. The apparatus consists of a Korad K2 1.064 μm Nd:YAG laser, a high-vacuum system including a bell jar with windows for viewing the sample, a tantalum or stainless steel tube heater surrounding a sample holding assembly, a thermocouple or infrared detector, and a digital data acquisition system capable of taking data at . Both surfaces of spinel were coated with a thin layer of black stove paint to absorb the laser energy. Young’s modulus and Poisson’s ratio were measured at the University of Dayton Research Institute (Dayton, OH) at 21°C by impulse excitation of vibration (ASTM C 1259) with duplicate disks. Disk faces were optically polished and edges were ground. Measurements were made with a GrindoSonic Model MK3s (J. W. Lemmens, Leuven, Belgium) fitted with a microphone. Specimens supported on packing foam were excited by a steel ball bearing on a polymer rod. The flexural frequency was measured at the circumference of the disk after impact at the center. The torsional frequency was found by impacting the nodal circle whose diameter was 0.681 times the specimen diameter and measuring the vibration 90 deg away on the nodal circle. Testing was complete when five consecutive readings agreed within 1%. Young’s modulus () and Poisson’s ratio () were calculated using the EMOD software supplied with the GrindoSonic. Transmittance from 1.5 to 8 μm was measured with a nitrogen-purged PerkinElmer Spectrum GX Fourier transform infrared (FTIR) spectrophotometer at the Naval Air Warfare Center. The instrument uses a 1350 K wire coil source, a deuterated triglycine sulfate detector, and a KBr beamsplitter. Each spectrum is an average of 32 scans with resolution at a wavelength of 2.5 μm. Photometric accuracy is . The 100% transmittance was measured before each sample scan. A new background was collected if the 100% transmittance changed by more than . Transmittance from 0.25 to 2.5 μm was measured with a 150-mm diameter integrating sphere on a PerkinElmer Lambda 950 UV-Vis-NIR spectrophotometer with a photometric accuracy of . The FTIR values matched the integrating sphere values to better than in the wavelength region of 1.5 to 2.5 μm where the two instruments overlap. Total integrated infrared optical scatter in the forward and reverse hemispheres was measured at the Naval Air Warfare Center with a Coblentz sphere that captured light scattered between 2.5 and 70 deg from the direction of the incident laser beam.13 The light source was an optical parametric oscillator laser from JP Innovations (Monroe, WA) tunable from 3.46 to 4.41 μm. The idler output is . A 4-mm thick Ge window at the laser output blocks both the pump and signal radiation. Total integrated forward and back scatter of spinel from TA&T and MER were each in the range of 0.1 to 0.4% at 3.5 μm for samples with a thickness of 7 to 13 mm. Refractive index of one TA&T spinel prism was measured at the Air Force Research Laboratory by the method of minimum deviation.14,15 The prism had a base and rectangular faces. The apex angle was , where the uncertainty is the standard deviation of 10 measurements made with an autocollimator. Five measurements of the angle of minimum deviation were made on a Moller-Wedel divided circle spectrometer at each wavelength and the average was used to calculate the refractive index. For thermo-optic coefficient measurements, the advantage of the method is that it allows for direct measurement of (change in refractive index with respect to temperature ) without having to subtract the contribution of the thermal expansion coefficient from the overall change in optical path, which is measured interferometrically.16,17 Refractive indices of standards were within 0.0001 of NIST measurements.18,19 The estimated error in the refractive index is and the error in the thermo-optic coefficients, , is . Laser calorimetry was conducted at the University of Central Florida College of Optics and Photonics.20 The experiment consists of thermally equilibrating a suspended test sample in the calorimeter, then exposing it to a laser while measuring the temperature rise of the specimen, and then continuing to monitor sample temperature after halting the laser exposure. Prior to calorimetry, specimens were cleaned with acetone and a cotton bud, washed with methanol, and wiped with lens paper. An insulated box enclosed the experiment to thermally isolate the sample at ambient temperature () in the air. Laser light entered and exited the box through holes surrounded by insulating material to reduce convective heat transfer to the atmosphere. Calorimetry samples were optically polished disks with a diameter of 10 mm and nominal thicknesses of 1.0, 2.0, and 3.0 mm. One edge was ground flat over a length of 2 to 3 mm for gluing a monofilament nylon fishing line to suspend the specimen in the path of the laser beam. The fishing line was attached to a thermally isolated frame mounted with 3 degrees of translational and rotational movement. A precision temperature measurement system by GEC Instruments (model S4TC) allowed the simultaneous reading of four temperatures with precision better than 10 mK over a broad range. Three 0.2-mm diameter thermocouples were glued to the edge of each sample. Care was taken to prevent scattered laser light from striking the temperature sensors. The sensitivity of the calorimeter was . Lasers emitting at 1.064 μm (Nd:YAG, output), 2.94 μm (Er:YAG, ), (cascade diode laser from Maxion Technologies, College Park, MD, ), and (cascade diode laser from Maxion, ) were used to irradiate the samples in the calorimeter via beam-directing mirrors. Laser power was measured as it entered the calorimeter using two calibrated power meters to check for consistency. If a laser beam was too large in diameter, or was divergent, a lens was used to focus the beam to . Power was measured after the lens. The 4.85-μm laser radiated over the range of 4.79 to 4.94 μm, with half of the intensity on either side of 4.85 μm. Finite element analysis was carried out at the Naval Air Warfare Center with NX 7.5 finite element analysis software (Seimens PLM Software, Munich, Germany). A rectangular window was divided into 8-node cubic elements, with 51,300 elements in one plane and five planes through the thickness of the window. A static load of 13.79 kPa () was applied to the upper surface of the window. The analysis identifies in-plane stresses on the upper and lower surfaces of the window and computes the maximum principal stress in each surface element. For a simply supported window, nodes along both lower long edges and one of the lower short edges were fixed in the vertical () direction, but were free to rotate and to move in the and directions. The row of nodes on the other short, lower edge of the window was constrained in all six degrees of freedom. The model therefore has one edge restrained and three simply supported. Tensile stress adjacent to the constrained edge on the tensile face was neglected in computing the probability of survival of the window, so as to approximate a fully simply supported window. The one condition that was modeled was a window with dimensions of , with the length of each finite element being 0.254 cm. For other pressures and window thicknesses, stresses were scaled in proportion to , where is the uniform pressure on the upper surface of the window and is the thickness of the window. For example, if the applied pressure was doubled, stresses were doubled. If the window thickness was doubled, stresses were decreased by a factor of 4. 3.Thermal and Elastic Properties of Spinel3.1.Specific Heat CapacityThe specific heat capacity of spinel was fit by the equation with , , , , and . The residual standard deviation in is . Extrapolating the measured curve by 1 K gave a value of at 295 K, which is 2% below the value of reported by Klemme and Ahrens.21 For sapphire at 295 K, .123.2.Thermal ExpansionThermal expansion of spinel was fit to the polynomial where is the initial length at and is the increase in length at temperature (K). The constants are , , , and . The residual standard deviation in is . Our values of are generally within 2% of the values reported by Koenig,22 whose data are fit by a cubic polynomial with , , , and for to 1900 K. The differential coefficient of thermal expansion (CTE) derived from Eq. (2) is3.3.DensityThe density of spinel () at 293 K was calculated from the cubic unit cell lattice dimension of 0.8085 nm and eight formula masses () per unit cell.21,23 At elevated temperature , the density decreases from thermal expansion. where is the density at , and is computed with Eq. (2).3.4.Thermal ConductivityThermal diffusivity () is a measure of the rate at which temperature diffuses through a substance when there is a spatial gradient of temperature. Thermal conductivity, , is computed from the measured diffusivity by the equation where is the density in Eq. (4), is the specific heat capacity in Eq. (1), and is the thermal diffusivity. Our data in Fig. 2 are fit by the equation where , , , and to 1273 K, and the residual standard deviation of the curve fit is . Figure 2 also shows previously reported values of the thermal conductivity of spinel.22,24,253.5.Elastic Moduli and Poisson’s RatioYoung’s modulus () and Poisson’s ratio () measured from vibrational frequencies of test specimens were used to compute the shear modulus () and bulk modulus (). Results are , , , and for . Our value of Young’s modulus can be compared with values of 277,26 275,27 266 to 270,28 268,29 and 25830,31 GPa in previous reports. 4.Laser Calorimetry4.1.Treatment of Laser Calorimetry DataLaser calorimetry is recommended for measuring the low absorptance of optical components and window materials.32–35 In this technique, a small disk is irradiated with a laser while the temperature of the disk is measured by thermocouples attached to the edge. After irradiation, the temperature falls back to ambient in an exponential manner. The graph of temperature versus time in Fig. 3 can be used to extract the absorptance () of the material, which is the fraction of incident radiant power () absorbed. Knowing the mass of the sample and its specific heat capacity, we can calculate how much energy was absorbed from the laser to create the observed temperature rise.Fig. 3Temperature rise of 2-mm-thick disks of -plane sapphire (0.628 g sample, 73 mW laser power), -plane sapphire (0.634 g, 70 mW), and spinel (0.527 g, 61 mW) in laser calorimetry at 4.85 μm. The sample is exposed to the laser from time to time . A linear temperature correction for baseline drift was applied to the data prior to display. 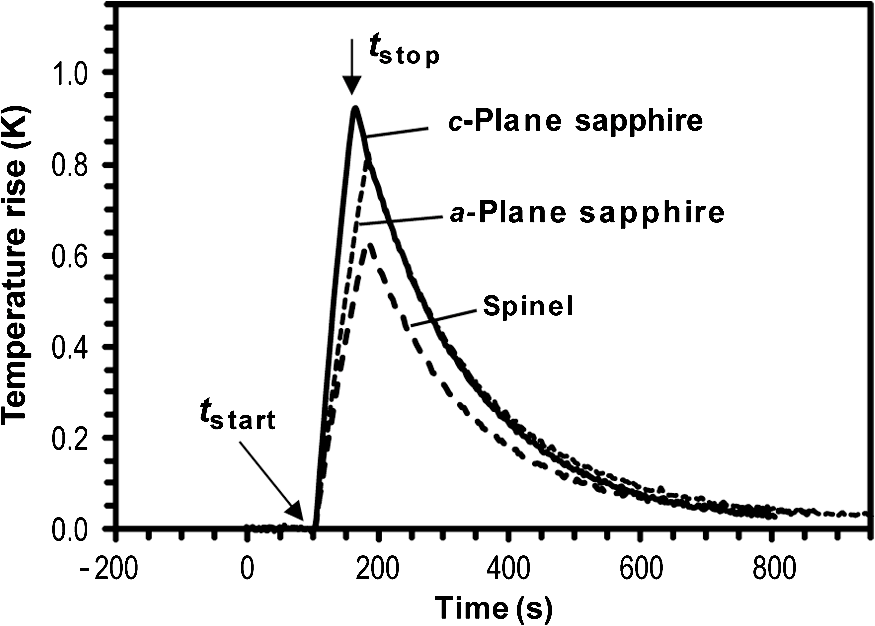 Advantages of laser calorimetry include the simplicity of the apparatus and ease of absolute calibration. Surface and bulk absorptance can be distinguished by studying samples with different thicknesses. If the surfaces are identical, then a plot of measured absorptance versus sample thickness extrapolated to zero thickness reveals the surface absorptance. The slope of the graph gives the bulk absorptance. If the laser calorimetry test specimen were not losing heat during laser irradiation, and if the thermal conductivity of the sample is high enough that its temperature () is uniform, the rate at which its temperature would rise is equal to the power absorbed divided by the thermal mass () of the disk. where is time and is the mass of the sample. The numerator on the right side of Eq. (8) is the power absorbed by the sample. The denominator is the energy required to raise the sample temperature by 1 K. In the absence of heating, the rate at which the sample cools is proportional to the difference in temperature between the sample and its surroundings (). where is an empirical heat loss coefficient accounting for radiative and conductive heat losses.At any time during the calorimetry experiment, the rate of change of temperature is the sum of Eqs. (8) and (9). Integration of Eq. (10) gives the temperature rise of the sample versus time. where is the time at which the sample is exposed to the laser and is the time at which exposure ends (Fig. 3). Absorptance () and heat loss coefficient () can be extracted from the temperature versus time data in Fig. 3 by least-squares curve fitting.Internal transmittance is the fraction of radiant power that has entered a specimen, which reaches the opposite side after traversing a path length through the specimen. The relation between internal transmittance and absorption coefficient () is Internal transmittance is independent of surface losses by reflection, absorption, and scatter.For perpendicular incidence of a laser beam on a sample with parallel surfaces, negligible optical scatter, and negligible surface absorption, the absorption coefficient is related to absorptance by Eq. (14),35 which is derived in the appendix. where is the single-surface Fresnel transmittance and is the single-surface Fresnel reflectance. (We use for transmittance to avoid confusing transmittance with temperature, .) If there is negligible absorption and scatter at the surface, then . In the absence of strong absorption, the single-surface Fresnel reflectance and transmittance depend only on the real part () of the refractive index of the disk. where the refractive index of air is 1. For specimens and wavelengths used in the present study, scatter and absorption are low enough for Eqs. (15) and (16) to be good approximations.When the product of the absorption coefficient and the sample thickness is small (), a first-order expansion of Eq. (14) gives If there is surface absorption, a term accounting for both surfaces can be added to Eq. (17). In the present work, surface absorption was negligible relative to the precision of the measurement of bulk absorption. Equation (17) is typically accurate enough for laser calorimetry measurements of weakly absorbing specimens. However, Eq. (14) was required for sapphire and spinel at 4.85 μm, where there is significant absorption. 4.2.Laser Calorimetry ResultsFigures 4 and 5 show the absorptance of sapphire and spinel at 4.85 μm and the absorptance of spinel at 3.41, 2.94, and 1.064 μm. Error bars on the data points are estimated standard deviations from several measurements. Straight lines through the origin were drawn through the spinel data for 3.41, 2.94, and 1.064 μm in Fig. 5. The slope is the absorption coefficient in Eq. (17). Fig. 4Absorptance of -plane sapphire (circles) and -plane sapphire (triangles) at 4.85 μm measured by laser calorimetry as a function of sample thickness. Curves are least-squares fit of Eq. (14) to the data with absorption coefficient as the one unknown parameter. 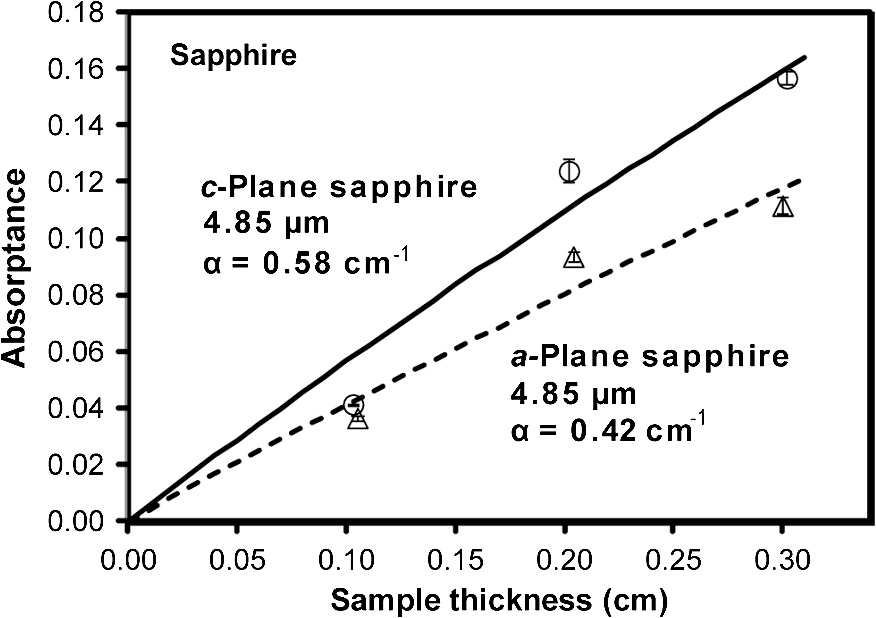 Fig. 5Absorptance of spinel measured by laser calorimetry as a function of sample thickness. Data at 4.85 μm are fit to Eq. (14) using the method of least squares. Straight lines through the origin, Eq. (17), were fit to the points for 1.064, 2.94, and 3.41 μm. 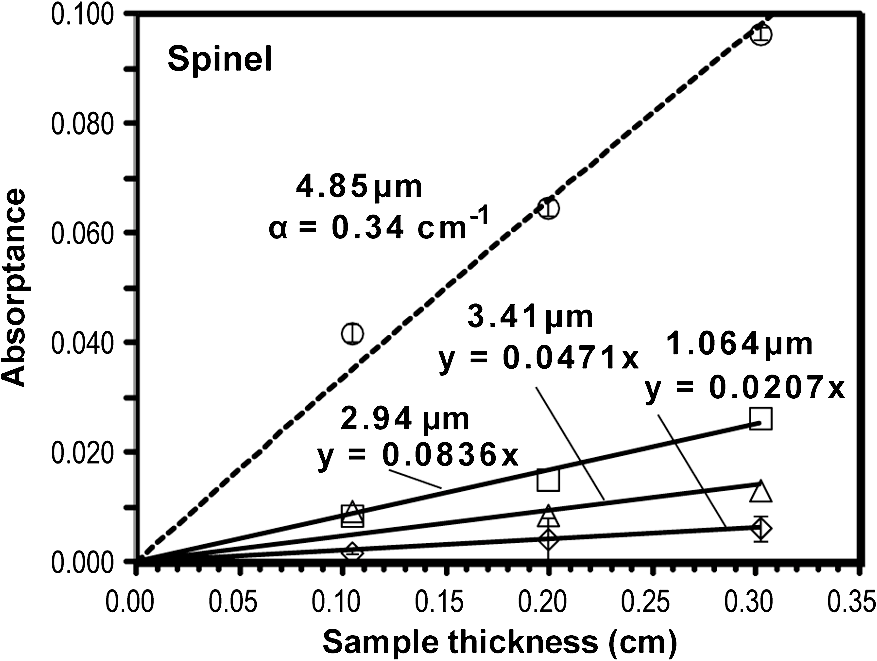 The absorptance of spinel and sapphire at 4.85 μm is too high to use Eq. (17), which produces values of absorption coefficient that are 3 to 9% low. Therefore, absorptance was fit to Eq. (14), with the single-surface Fresnel reflectance and transmittance calculated from the literature refractive index36–38 with Eqs. (15) and (16). The only adjustable parameter in the curve fit is absorptance. Curve fitting was done with Microsoft Excel Solver® as described by Harris.39 The standard uncertainty in absorptance from the curve fit was computed with Billo’s Excel macro Solvstat.40 The 95% confidence interval for absorptance was obtained by multiplying the standard uncertainty by Student’s for degrees of freedom, where is the number of data points on each curve and is the number of adjustable parameters. Resulting absorption coefficients are listed in Table 1, where comparison is made with previously reported laser calorimetry measurements at several shorter wavelengths.41–44 The absorption coefficients of sapphire and spinel at 4.85 μm are thought to represent intrinsic properties of the materials. Absorption coefficients at 1.064, 2.94, and 3.41 μm are thought to arise from extrinsic factors such as OH impurities. It is noteworthy that the spinel we measured has times as much absorption as sapphire at 1.064 μm, and substantial absorption in the OH stretching region at 2.94 and 3.41 μm. Table 1Absorption coefficients measured by laser calorimetry.
Note: Uncertainty is 95% confidence interval. The absorption coefficient for sapphire at 2.94 and 3.41 μm was too small to measure with the laser power available. Figure 6 superimposes our results from laser calorimetry with previous optical transmittance measurements made with laser diodes at discrete wavelengths or by FTIR spectrometry.5,6,45 Our calorimetry results are represented by three large open symbols at 4.85 μm. Dashed lines are from OPTIMATR. Solid circles are reported points for -plane sapphire. Solid squares are reported points for -plane sapphire. Solid triangles are reported points for spinel. Two superimposed open symbols near the origin at 3.8 μm are laser calorimetry points for -plane sapphire from the literature listed in Table 1.42,43 Fig. 6Comparison of laser calorimetry (open symbols at 4.85 μm) to OPTIMATR absorption coefficient (dashed curves) and previously reported discrete values for absorption coefficient of -plane sapphire (solid circles), -plane sapphire (solid squares), and spinel (solid triangles). The solid curve is the absorption coefficient of spinel derived from transmittance of two thicknesses of spinel in the present work. 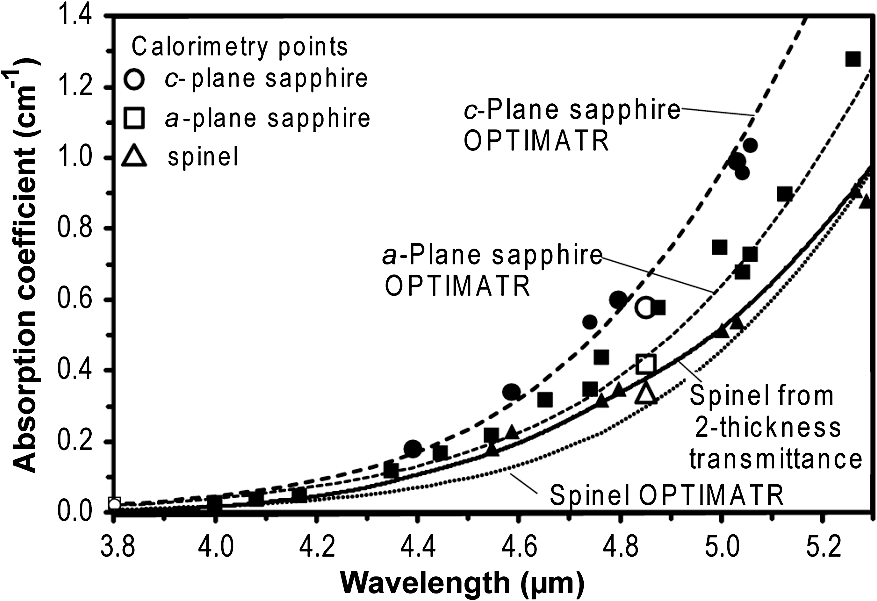 We obtained the solid curve in Fig. 6 by measuring the transmittance of spinel with thicknesses of 0.598 and 1.276 cm. If surface absorption and surface scatter from the two specimens are the same, the bulk extinction coefficient (), arising from bulk absorption plus bulk scatter, is given by where is the transmittance of each sample and is the thickness. Equation (19) ignores multiple reflections within the sample. Total integrated optical scatter provides an estimate of bulk scatter in spinel. The sum of the forward and reverse scatter averaged from measurements at 3.5, 4.0, and 4.4 μm is 0.346% for a 0.598-cm thick specimen and 0.418% for a 1.276-cm thick specimen. (The total integrated scatter from the two samples of spinel did not vary with wavelength in the interval of 3.5 to 4.4 μm.) If surface scatter of both specimens is equal, the difference in bulk scatter is for a thickness difference of . The bulk scatter coefficient is therefore . This negligible scatter coefficient was subtracted from the extinction coefficient in Eq. (19) to obtain the absorption coefficient shown by the solid line in Fig. 6.5.Revised Spectral Absorption Coefficient of SpinelIn Fig. 6, experimental data points for the absorption coefficient of spinel (solid triangles) and our measurement from two thicknesses of spinel [solid line computed with Eq. (19)] are superimposed, but do not agree with the dotted line for spinel computed with OPTIMATR. By contrast, experimental data points for -plane sapphire (solid circles) and -plane sapphire (solid squares) are in good agreement with the dashed curves computed by OPTIMATR. Our laser calorimetry measurement for -plane sapphire at 4.85 μm (open square) lies on the OPTIMATR curve. Our laser calorimetry measurement for -plane sapphire (open circle) lies 12% below the OPTIMATR curve, but within the estimated uncertainty of the calorimetry measurement. For spinel, our laser calorimetry measurement (open triangle) lies between the dashed and solid curves for spinel, but within experimental uncertainty of both. In summary, experimental data points are in good agreement with the OPTIMATR curves for sapphire, but experimental points for spinel do not lie on the OPTIMATR curve in the region from 4.2 to 5.2 μm. OPTIMATR underestimates the absorptance of spinel in the 4.2 to 5.2 μm region. We therefore made spectroscopic measurements of the absorption coefficient of additional samples of spinel to see if the solid curve in Fig. 6 is reproducible. Figure 7 shows that spectroscopic data from new samples of spinel from TA&T and from MER Corp. lie near the solid curve from Fig. 6 and not near the OPTIMATR curve. Table 2 lists the average absorption coefficient of spinel from measurements of three pairs of thick and thin specimens. We found other spinel samples that gave higher extinction coefficients than those shown in Table 2. We assume that these materials had higher optical scatter and deliberately used samples that gave the lowest extinction coefficients so as not to overestimate the absorption of spinel. Fig. 7Absorption coefficients of spinel manufactured by four companies three decades apart all lie above the OPTIMATR curve (solid line) in the region of 4.2 to 5.2 μm. Dashed lines are obtained from two pairs of TA&T spinel plates and one pair of MER spinel plate made in the 2010 to 2012 period. Small corrections for bulk scatter at 3.5 μm have been subtracted from the bulk extinction coefficient. Open circles were measured by diode laser absorption of Raytheon spinel in the 1980s.5 Open triangles were measured by diode laser absorption of Coors spinel in the 1980s.5 Open square is laser calorimetry value from the present work.  Table 2Mean absorption coefficient of spinel from transmittance of three pairs of thin and thick specimens.
Note: A polynomial fitting absorption coefficient as a function of wave number (ν˜, cm−1) from 2600 to 1875 cm−1 is α (cm−1)=5.51852179 × 10⁻¹⁸ν˜6 − 8.88520838 × 10⁻¹⁴ν˜5 + 5.85969325 ×10⁻¹⁰ν˜4−2.03475841×10⁻⁶ν˜3+3.93709258×10⁻³ν˜2−4.03652837ν˜+1717.85263. Full nine-digit coefficients are required to reproduce α with three decimal precision. The pair of spinel samples that gave the lowest absorption coefficient in the 4 to 5 μm region was used to calculate the extinction coefficient at shorter wavelengths. Figure 8 shows two weak absorption features near 1.8 and 2.8 μm, which are evident in all samples of spinel that are thick enough to see the absorption. Note that the absorption coefficients from laser calorimetry for spinel in Table 1 are roughly twice as great as the values in Fig. 8. The values in Fig. 8 could therefore be an underestimate. Fig. 8Extinction coefficient of MER spinel showing absorptions in the 1.5 to 3.2 μm region seen in MER and TA&T spinel. No correction for bulk optical scatter has been applied to the data. 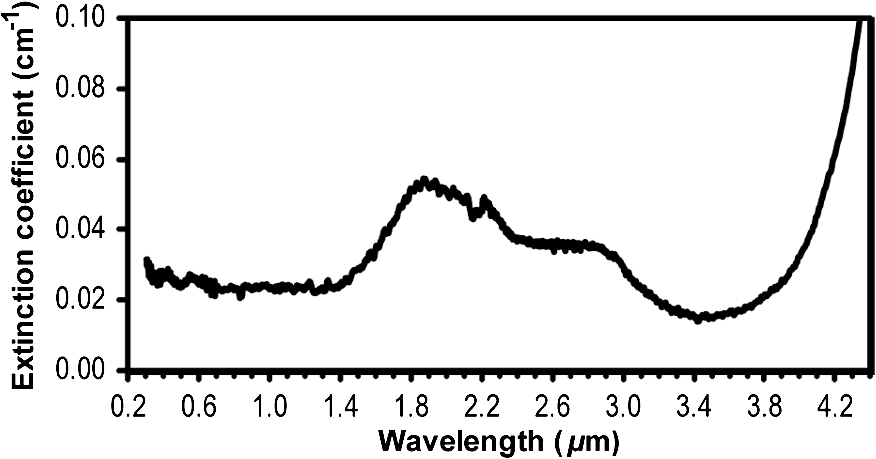 For comparison of the absorption of sapphire and spinel in Sec. 7 of this paper, we calculated the absorptance () of a 1-cm-thick slab of each material from the absorption coefficient by using Eq. (14), where is the single-surface transmittance. We then computed the average absorptance over the wave number range (3.8 to 5.0 μm) with Eq. (20). Results are shown in Table 3, which also includes the average absorptance for the range 3.0 to 5.0 μm using the absorption coefficient for spinel from Fig. 8. The average absorptance of spinel (0.134) in the 3.8 to 5.0 μm region is 92% as great as that of -plane sapphire (0.145) and 71% as great as that of -plane sapphire (0.189). OPTIMATR predicts significantly lower average absorptance for spinel (0.094). The average absorptance of spinel (0.073) in the wider range of 3.0 to 5.0 μm is slightly greater than that of -plane sapphire (0.071) because spinel has absorption in the 3.0 to 3.8 μm region (Fig. 8) and sapphire does not. OPTIMATR does not model any spinel absorption below 3.8 μm. Table 3Average absorptance of spinel and sapphire.
6.Refractive Index of SpinelPublished2,46,47 and unpublished measurements of the refractive index () of spinel at room temperature from 0.35 to 5.5 μm were summarized in 1995 by the Sellmeier equation. 38 where wavelength () is expressed in μm. Spinel samples included natural minerals and synthetic material from the 1980s and earlier.We measured the refractive index of a single prism of commercial polycrystalline spinel manufactured in 2010. Measurements near 295 K were made at 60 wavelengths between 0.4 and 5.0 μm. An additional 93 measurements were made near 350, 400, and 450 K at selected wavelengths. The entire data set was fit to the following Sellmeier equation by the Levenberg-Marquart algorithm with the Excel macro Optimiz.48 where is the wavelength in the range of 0.4 to 5 μm, is the temperature in the range of 295 to 450 K, , and the least-squares parameters are , , , , , and . The root-mean-square error in fitting the refractive index is 0.00014. The root-mean-square difference between Eqs. (21) and (22) at 295 K is 0.0009, with the value of from Eq. (22) being higher than the value from Eq. (21). A 2 mol% increase in the ratio would increase the refractive index by 0.0009.The refractive index increases linearly in the range of 25 to 175°C, with a slope . For comparison, Lang and Duncan49 found () at 0.633 μm in the range of 25 to 525°C. The average slope of this function from 25 to 175°C is . Vadem et al.47 reported at 0.589 μm for the range of 25 to 700°C. 7.Trading Optical Absorption and Mechanical StrengthThe question that motivated our study of sapphire and spinel is which of these infrared window materials can provide the least midwave infrared absorption while meeting the mechanical requirements for a window? From Fig. 1, the long held conventional wisdom has been that increased infrared transmittance in the 4 to 5 μm range is provided in the order . However, careful measurements in Fig. 6 show that the absorption coefficients of spinel and -plane sapphire are almost equal in the range of 3.8 to 4.8 μm and diverge only at longer wavelengths. Sapphire is mechanically stronger than spinel, so a thin sapphire window could possibly be used instead of a thicker spinel window, resulting in lower absorption by the thin sapphire than by the thicker spinel. Our goal is to make quantitative comparisons to select the material that has the least infrared absorption, while meeting mechanical requirements. One way to design a window plus its frame employs finite element analysis to calculate the stress distribution in the window under a given load and to use Weibull statistics to estimate the probability of survival of the window. If the desired probability of survival cannot be achieved with a practical thickness of material, a proof test on a finished window could be used to demonstrate that a particular window survives required loads. Another approach to window design is to measure slow crack growth rate of the window material (ASTM C1368) and then design the window to last for a chosen lifetime under operational stresses.29,50 Consider a simply supported rectangular window subjected to a uniform pressure on one face. Maximum tensile stress () on the tensile face of the window is proportional to the applied pressure () and decreases as the inverse square of window thickness ().51 Stress also depends on Poisson’s ratio, which is the same (0.27) for sapphire and spinel.To compare strengths of materials, we employ the characteristic strength () defined by Klein as the effective mean strength of a area under tension in a mechanical test.52–54 The strength of an optical ceramic is a highly variable, extrinsic property that depends on flaws such as scratches, subsurface damage, weak grain boundaries, large grains, inclusions, pore nests, and voids. The distribution of flaw sizes determines the distribution of strength, which is characterized by the Weibull modulus, . The smaller the Weibull modulus, the broader is the distribution of strength. For window design consideration, we choose the parameters and in columns 2 and 3 of Table 4, which approximately represent particular lots of real specimens. Three sets of Weibull parameters for spinel in Table 4 encompass the behavior of large-grain, commercial material for which we have data. Weibull parameters for sapphire are roughly representative of several widely varying reports.52,55–57 Sapphire and spinel could have widely different characteristics from those listed in the table. For example, experimental coupons of spinel with a grain size of 2 μm had a characteristic strength of and a Weibull modulus of 6.9.58 In our experience, Table 4 approximately represents the range of strength and Weibull modulus of high optical quality spinel that can be currently purchased in the form of large windows with lateral dimensions . The characteristic strength of sapphire in Table 4 might appear high in comparison to strengths listed in some manufacturer’s bulletins. The reason is that the characteristic strength applies to area under load. When scaled for area with a Weibull modulus of 4, the strength of sapphire would look more familiar. For example, for an area of instead of , the strength of -plane sapphire is predicted to be Table 4Applied pressure and window thickness that give Ps=0.999 for spinel and sapphire windows with different strength distributions.
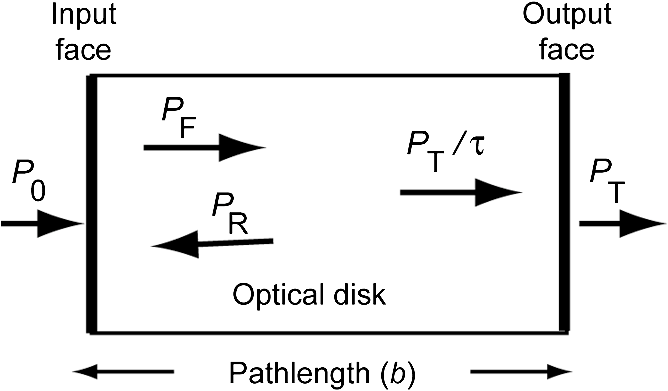
Note: Simply supported window (48.26×68.58×b cm thick) with pressure p applied to one surface. For each element of area on the tensile surface of a window in a finite element model, the probability of survival () is given by the Weibull distribution, which we choose to write as suggested by Klein.52–54 where is the surface area of the finite element, , is the gamma function of the argument (), and is the maximum principal tensile stress in the finite element. The overall probability of survival of the window is the product of for all the elements of the tensile surface. The probability of failure for the window is .Finite element analysis was conducted for a simply supported rectangular window with dimensions with a uniform pressure applied to one face. The thickness () of the window was varied to produce a probability of survival of 0.999 for each set of Weibull parameters. In Table 4, for spinel 1 with and , a thickness of and applied pressure give a probability of survival of 0.999. The maximum stress at the center of the tensile face is 21.0 MPa. For -plane sapphire with and , the same applied pressure of 39.5 kPa yields a probability of survival of 0.999 if the thickness is 1.02 cm. The stress at the center of the tensile face is 32.4 MPa. Three cases for spinel and two cases for sapphire are listed in Table 4. From the thickness of the window required to produce a survival probability of 0.999, the mean absorptance for the wavelength range of 3.8 to 5.0 μm was computed by solving Eq. (14) for absorptance at each wavenumber and then integrating Eq. (20). Absorptance is shown in the next-to-last column of Table 4 and relative absorptance is shown in the last column. We find that -plane sapphire has equivalent absorptance to spinel 2 whose characteristic strength is 150 MPa and whose Weibull modulus is 6. Spinel 1 with a higher Weibull modulus and spinel 3 with a higher strength have slightly less absorptance than -plane sapphire. The absorptance of -plane sapphire is 9 to 23% greater than that of the three types of spinel. The conclusion of this analysis is that spinel and -plane sapphire have similar mean absorptance in the 3.8 to 5.0 μm region. When designed to bear the same load, either material could be better than the other, depending on their Weibull parameters. This conclusion contradicts the common belief that a spinel window will have less midwave infrared absorptance than a sapphire window. Spinel does have less absorptance than -plane sapphire, but does not have a clear advantage over -plane sapphire. 8.ConclusionCareful measurements of infrared absorption of high-quality, commercial, polycrystalline spinel show that the absorptance is 43% greater in the range of 3.8 to 5.0 μm than the value predicted by the computer code OPTIMATR®, which has been used for window and dome design for more than 20 years. The average absorptance of spinel in the wavelength range of 3.8 to 5.0 μm is 92% as great as that of -plane sapphire and 71% as great as that of -plane sapphire. Spinel also exhibits weak absorptance in the range of 1.4 to 3.4 μm. As a result, the average absorptance of spinel in the range of 3.0 to 5.0 μm is 103% as great as that of -plane sapphire and 79% as great as that of -plane sapphire. The spinel that we examined has times as much optical absorption as sapphire at 1.064 μm. Specific heat capacity, thermal expansion, thermal conductivity, elastic constants, and refractive index of spinel are also reported. We examined the relative infrared absorptance of sapphire and spinel windows designed to provide the same probability of survival under an applied load. The conclusion is that spinel and -plane sapphire have similar mean absorptance in the 3.8 to 5.0 μm region. The absorptance of -plane sapphire is greater than that of spinel. AcknowledgmentsWe thank Larry Fehrenbacher of TA&T and Juan Sepulveda of MER Corp. for providing spinel and sharing data on spinel. We are grateful to GT Advanced Technologies (formerly Crystal Systems) for providing sapphire. Raytheon thermal conductivity data were kindly provided by Howard Poisl. AppendicesAppendix:Derivation of Eq. (14) Relating Absorption Coefficient to AbsorptanceAbsorptance can occur in the bulk material and at both surfaces. Following the derivation of Orchard et al.,35 we assume that surface absorption is negligible compared with bulk absorption. The derived formula therefore places an upper limit on bulk absorption. In Fig. 9, radiant power is incident on the first surface of the optical disk at the left. If the single-surface transmittance is , and if there is negligible surface absorption and scatter, then the power that enters the first surface is . When the forward ray reaches the right-hand surface, some is transmitted to the right and some is reflected back to the left. When the reflected beam reaches the left-hand surface, some is transmitted to the left and some is reflected back to the right. There are an infinite number of progressively smaller internal reflections. The total radiant power traveling in the forward direction (to the right) inside the sample is designated in Fig. 9. This power is the sum of the power that entered the sample and the infinite number of reflections from the left-hand surface. Similarly, the total radiant power traveling in the reverse direction (to the left) inside the sample is designated . At the output face, the total transmitted power is , so the total power incident on the output face from inside the sample must be because the transmittance of the output face is . The total power propagating from left to right inside the sample is . It is attenuated over a path length by a material with a bulk absorption coefficient . We say35 that power reaching the output face is a result of power being attenuated by a factor . If the single-surface reflection coefficient is , and total power reaches the output face, then the total reflected power propagating to the left inside the sample is The total power absorbed inside the sample is a result of powers and each being attenuated over path length . where is the absorptance. Equation (27) can be rearranged toThe total transmitted power ( in Fig. 9) results from the incident power being transmitted through two surfaces and suffering an infinite number of partial reflections between those two surfaces. The following equation accounts for all losses: The parentheses contain an infinite geometric series of the form , where . For , the sum converges to , so Substituting the expression at the right of Eq. (30) for the infinite series into Eq. (29) gives Finally, we substitute the expression for from Eq. (31) into Eq. (28). Solving Eq. (32) for gives which is Eq. (14).Equation (14) relates the absorption coefficient () to the measured absorptance (). The single-surface Fresnel reflectance () is given by Eq. (15) and the Fresnel transmittance () is given by Eq. (16). If we know the refractive index of the material at the laser wavelength, Eq. (14) allows us to calculate the absorption coefficient from the measured absorptance. ReferencesD. C. Harris, Materials for Infrared Windows and Domes, SPIE Press, Bellingham, WA
(1999). Google Scholar
K. A. WickersheimR. A. LaFever,
“Optical properties of synthetic spinel,”
J. Opt. Soc. Am., 50
(8), 831
–832
(1960). http://dx.doi.org/10.1364/JOSA.50.0831_1 JOSAAH 0030-3941 Google Scholar
M. E. ThomasW. J. Tropf,
“Aluminum oxide () revisited,”
Handbook of Optical Constants of Solids III, 653
–682 Academic Press, San Diego
(1998). Google Scholar
D. W. Ricks,
“Polarization analysis of sapphire domes,”
Proc. SPIE, 891 172
–178
(1988). http://dx.doi.org/10.1117/12.944304 PSISDG 0277-786X Google Scholar
M. E. ThomasR. I. JosephW. J. Tropf,
“Infrared transmission properties of sapphire, spinel, yttria, and ALON as a function of temperature and frequency,”
Appl. Opt., 27
(2), 239
–245
(1988). http://dx.doi.org/10.1364/AO.27.000239 APOPAI 0003-6935 Google Scholar
M. E. Thomas,
“Infrared properties of the extraordinary ray multiphonon process in sapphire,”
Appl. Opt., 28
(16), 3277
–3278
(1989). http://dx.doi.org/10.1364/AO.28.003277 APOPAI 0003-6935 Google Scholar
M. E. Thomas,
“A computer code for modeling optical properties of window materials,”
Proc. SPIE, 1112 260
–267
(1989). http://dx.doi.org/10.1117/12.960785 PSISDG 0277-786X Google Scholar
S. G. KaplanM. E. Thomas,
“Measurement of the o-ray and e-ray infrared refractive index and absorption coefficient of sapphire from 10 K to 295 K,”
Proc. SPIE, 4822 41
–50
(2002). http://dx.doi.org/10.1117/12.451770 PSISDG 0277-786X Google Scholar
W. J. TropfM. E. Thomas,
“Aluminum oxynitride (ALON) spinel,”
Handbook of Optical Constants of Solids II, 777
–787 Academic Press, Boston
(1991). Google Scholar
W. J. TropfM. E. Thomas,
“Magnesium aluminum spinel (),”
Handbook of Optical Constants of Solids II, 883
–897 Academic Press, Boston
(1991). Google Scholar
D. G. Archer,
“Thermodynamic properties of synthetic sapphire () standard reference material 720 and the effect of temperature-scale differences on thermodynamic properties,”
J. Phys. Chem. Ref. Data, 22
(6), 1441
–1453
(1993). http://dx.doi.org/10.1063/1.555931 JPCRBU 0047-2689 Google Scholar
P. C. ArchibaldH. E. Bennett,
“Scattering from infrared missile domes,”
Opt. Eng., 17
(6), 647
–651
(1978). http://dx.doi.org/10.1117/12.7972298 OPEGAR 0091-3286 Google Scholar
M. BornE. WolfA. B. Bhatia, Principles of Optics, 191
–192 7th ed.Cambridge University Press, New York
(1999). Google Scholar
A. Joshiet al.,
“Impurity concentration and temperature dependence of the refractive indices of -doped ceramic ,”
Opt. Express, 20
(4), 4428
–4435
(2012). http://dx.doi.org/10.1364/OE.20.004428 OPEXFF 1094-4087 Google Scholar
Y. SatoT. Taira,
“Thermo-optical and mechanical parameters of and ,”
in Quantum Electronics and Laser Science Conference, 2007,
(2007). Google Scholar
R. Weil,
“Interference of 10.6 m coherent radiation in a 5-cm long gallium arsenide parallelepiped,”
J. Appl. Phys., 40
(7), 2857
–2859
(1969). http://dx.doi.org/10.1063/1.1658088 JAPIAU 0021-8979 Google Scholar
I. Malitson,
“Revisiting the optical properties of calcium fluoride,”
Appl. Opt., 2
(11), 1103
–1107
(1963). http://dx.doi.org/10.1364/AO.2.001103 APOPAI 0003-6935 Google Scholar
A. Feldmanet al.,
(1978). Google Scholar
G. Turriet al.,
“Optical absorption, depolarization, and scatter of epitaxial single-crystal chemical-vapor-deposited diamond at 1.064 μm,”
Opt. Eng., 46
(6), 064002
(2007). http://dx.doi.org/10.1117/1.2748044 OPEGAR 0091-3286 Google Scholar
S. KlemmeM. Ahrens,
“Low-temperature heat capacities of and spinels of the solid solution,”
Phys. Chem. Minerals, 34
(2), 59
–72
(2007). http://dx.doi.org/10.1007/s00269-006-0128-4 PCMIDU 0342-1791 Google Scholar
J. R. Koenig,
“Thermostructural evaluation of four infrared seeker dome materials,”
(1985). Google Scholar
S.-Y. Jinget al.,
“Investigation on lattice constants of Mg-Al spinels,”
J. Mater. Sci. Lett., 19
(3), 225
–227
(2000). http://dx.doi.org/10.1023/A:1006774318019 JMSLD5 0261-8028 Google Scholar
R. L. Gentilman,
“Current and emerging materials for 3–5 micron IR transmission,”
Proc. SPIE, 683 2
–11
(1986). http://dx.doi.org/10.1117/12.936409 PSISDG 0277-786X Google Scholar
D. W. RoyC. G. Martin Jr.,
“Advances in spinel optical quality, size and shape capability and applications,”
Proc. SPIE, 1760 2
–13
(1992). http://dx.doi.org/10.1117/12.130781 PSISDG 0277-786X Google Scholar
J. J. Swabet al.,
“Fracture analysis of transparent armor ceramics,”
Fractography of Glasses and Ceramics IV, Ceramic Transactions, 489
–508 American Ceramic Society, Westerville, OH
(2001). Google Scholar
K. W. WhiteG. P. Kelkar,
“Fracture mechanisms of a coarse-grained, transparent at elevated temperatures,”
J. Am. Ceram. Soc., 75
(12), 3440
–3444
(1992). http://dx.doi.org/10.1111/jace.1992.75.issue-12 JACTAW 0002-7820 Google Scholar
J. A. Salem,
“Transparent armor ceramics as spacecraft windows,”
J. Am. Ceram. Soc., 96
(1), 281
–289
(2013). http://dx.doi.org/10.1111/jace.12089 JACTAW 0002-7820 Google Scholar
D. F. PorterJ. S. ReedD. Lewis,
“Elastic moduli of refractory spinels,”
J. Am. Ceram. Soc., 60
(7–8), 345
–349
(1977). http://dx.doi.org/10.1111/jace.1977.60.issue-7-8 JACTAW 0002-7820 Google Scholar
R. L. StewartR. C. Bradt,
“Fracture of polycrystalline ,”
J. Am. Ceram. Soc., 63
(11–12), 619
–623
(1980). http://dx.doi.org/10.1111/jace.1980.63.issue-11-12 JACTAW 0002-7820 Google Scholar
C. BaudinR. MartinezP. Pena,
“High-temperature mechanical behavior of stoichiometric magnesium spinel,”
J. Am. Ceram. Soc., 78
(7), 1857
–1862
(1995). http://dx.doi.org/10.1111/jace.1995.78.issue-7 JACTAW 0002-7820 Google Scholar
“Test method for absorptance of optical laser components,”
Geneva
(1995). Google Scholar
U. WillamowskiD. RistauE. Welsch,
“Measuring the absolute absorptance of optical laser components,”
Appl. Opt., 37
(36), 8362
–8370
(1998). http://dx.doi.org/10.1364/AO.37.008362 APOPAI 0003-6935 Google Scholar
U. Willamowskiet al.,
“Calorimetric measurement of optical absorption at 532 nm and 1064 nm according to ISO/DIS 11551,”
Proc. SPIE, 2870 483
–494
(1996). http://dx.doi.org/10.1117/12.259934 PSISDG 0277-786X Google Scholar
D. A. Orchardet al.,
“Laser calorimetry as a tool for the optimisation of midIR OPO materials,”
Proc. SPIE, 5273 379
–387
(2003). http://dx.doi.org/10.1117/12.523316 PSISDG 0277-786X Google Scholar
M. J. Dodge,
“Refractive index,”
CRC Handbook of Laser Science and Technology, 30 CRC Press, Boca Raton, Florida
(1986). Google Scholar
I. H. MalitsonM. Dodge,
“Refractive index and birefringence of synthetic sapphire,”
J. Opt. Soc. Am., 62
(11), 1405
(1972). JOSAAH 0030-3941 Google Scholar
W. J. TropfM. E. ThomasT. J. Harris,
“Properties of crystals and glasses,”
Handbook of Optics, McGraw-Hill, New York
(1995). Google Scholar
D. C. Harris,
“Nonlinear least squares curve fitting with Microsoft Excel Solver,”
J. Chem. Ed., 75
(1), 119
–121
(1998). http://dx.doi.org/10.1021/ed075p119 JCEDA8 0021-9584 Google Scholar
E. J. Billo, Excel for Chemists, 2nd ed.Wiley-VCH, New York
(2001). Google Scholar
N. C. Ferneliuset al.,
“Multwavelength laser rate calorimetry on various infrared window materials,”
Proc. SPIE, 297 137
–142
(1981). http://dx.doi.org/10.1117/12.932495 PSISDG 0277-786X Google Scholar
J. A. HarringtonD. A. GregoryW. F. Otto,
“Infrared absorption in chemical laser window materials,”
Appl. Opt., 15
(8), 1953
–1959
(1976). http://dx.doi.org/10.1364/AO.15.001953 APOPAI 0003-6935 Google Scholar
J. A. Detrioet al.,
“Optical characterization of IR transmitting and laser window materials,”
Google Scholar
N. C. FerneliusG. A. GravesW. L. Knecht,
“Characterization of candidate laser window materials,”
Proc. SPIE, 297 188
–195
(1981). http://dx.doi.org/10.1117/12.932500 PSISDG 0277-786X Google Scholar
M. E. Innocenziet al.,
“Room-temperature optical absorption in undoped ,”
J. Appl. Phys., 67
(12), 7542
–7546
(1990). http://dx.doi.org/10.1063/1.345817 JAPIAU 0021-8979 Google Scholar
P. S. Waylandet al.,
“Multiphonon extraordinary-ray absorption coefficient for sapphire,”
Infrared Phys. Tech., 41
(5), 307
–312
(2000). http://dx.doi.org/10.1016/S1350-4495(00)00044-X IPTEEY 1350-4495 Google Scholar
K. Schlossmacher,
“Absorption and refraction of the red, blue, and violet spinels of Ceylon,”
Z. Kristallogr., 72 447
(1930). Google Scholar
K. VademJ. L. KirkB. N. N. Achar,
“Piezo- and thermo-optic behavior of spinel (),”
J. Solid State Chem., 12
(3–4), 213
–218
(1975). http://dx.doi.org/10.1016/0022-4596(75)90308-4 JSSCBI 0022-4596 Google Scholar
L. Volpi,
“Excel macro Optimiz.xla,”
(2013) http://digilander.libero.it/foxes/SoftwareDownload.htm , Paper JWA87 ( August ). 2013). Google Scholar
C. H. LangeD. D. Duncan,
“Temperature coefficient of refractive index for candidate optical windows,”
Proc. SPIE, 1326 71
–78
(1990). http://dx.doi.org/10.1117/12.22483 PSISDG 0277-786X Google Scholar
J. A. Salem,
“Slow crack growth and fracture toughness of sapphire for the international space station fluids and combustion facility,”
(2006). Google Scholar
W. C. YoungR. G. Budynas, Roark’s Formulas for Stress and Strain, 7th Ed.McGraw-Hill, New York
(2002). Google Scholar
C. KleinR. P. MillerR. L. Gentilman,
“Characteristic strength and Weibull modulus of selected infrared-transmitting materials,”
Opt. Eng., 41
(9), 3151
–3160
(2002). http://dx.doi.org/10.1117/1.1497398 OPEGAR 0091-3286 Google Scholar
C. KleinR. P. Miller,
“How to do a Weibull statistical analysis of flexural strength data,”
Proc. SPIE, 4375 241
–257
(2001). http://dx.doi.org/10.1117/12.439181 PSISDG 0277-786X Google Scholar
C. A. Klein,
“Flexural strength of infrared-transmitting window materials: bimodal Weibull statistical analysis,”
Opt. Eng., 50
(2), 023402
(2011). http://dx.doi.org/10.1117/1.3541804 OPEGAR 0091-3286 Google Scholar
F. SchmidD. C. Harris,
“Effect of crystal orientation and temperature on the strength of sapphire,”
J. Am. Ceram. Soc., 81
(4), 885
–893
(1998). http://dx.doi.org/10.1111/j.1151-2916.1998.tb02423.x JACTAW 0002-7820 Google Scholar
T. M. Reganet al.,
“Neutron irradiation for sapphire compressive strengthening. II. Physical property changes,”
J. Nucl. Mater., 300
(1), 47
–56
(2002). http://dx.doi.org/10.1016/S0022-3115(01)00708-5 JNUMAM 0022-3115 Google Scholar
C. KleinF. Schmid,
“Weibull statistical analysis of sapphire strength improvement through chemomechanical polishing,”
Proc. SPIE, 5786 175
–187
(2005). http://dx.doi.org/10.1117/12.603271 PSISDG 0277-786X Google Scholar
S. M. Sweeneyet al.,
“High strength transparent spinel with fine, uni-modal grain size,”
Proc. SPIE, 7302 73020G
(2009). http://dx.doi.org/10.1117/12.821193 PSISDG 0277-786X Google Scholar
Biography Daniel C. Harris is a senior scientist and esteemed fellow at the Naval Air Systems Command, China Lake, California, where he is responsible for infrared window materials research and development programs. He has degrees in chemistry from Massachusetts Institute of Technology in 1968 and California Institute of Technology in 1973. He is the author of Materials for Infrared Windows and Domes and a series of widely used textbooks in analytical chemistry. Robert Seaver received a BS in physics from the University of California, Los Angeles, in 2005. Since 2006, he has worked at the Naval Air Warfare Center Weapons Division, China Lake. His efforts focus on infrared optical metrology, including measurement of reflectance, scatter, absorption, and laser damage threshold.  Giorgio Turri graduated in 2001 at the Universita’ degli Studi di Milano and obtained his PhD in 2001 from the Politecnico di Milano. He began his research in experimental atomic and molecular physics, working at the Elettra Synchrotron in Trieste, Italy, and at the Advanced Light Source of the Lawrence Berkeley National Laboratory in California. His current interests are in optics and photonics, including laser calorimetry and characterization of lasing elements for solid-state lasers. He focuses on spectroscopic properties of rare-earth-doped crystals and glasses.  Michael Bass received a BS in physics from Carnegie-Mellon University and a PhD in physics from the University of Michigan in 1964. He has been active in quantum electronics research since his thesis work on optical rectification. He was among the first to demonstrate homogeneous broadening in dye lasers. He was responsible for the use of the statistical approach to understand laser-induced damage leading to the recognition of electron avalanche breakdown as the intrinsic cause of this phenomenon. He is the coinventor of the YAlO3 laser host and the use of fiber optics and lasers for the treatment of internal bleeding and tumors. He pioneered the use of laser calorimetry for the first absolute measurements of two-photon absorption. His current research centers on the design of improved solid-state lasers, materials with potential for use in upconversion lasers and displays, gain-guided index anti-guided fiber lasers, beam combining using volume Bragg gratings, and novel ceramic crystal optical materials. He is a fellow of OSA and a life fellow of IEEE. |
||||||||||||||||||||||||||||||||||||||||||||||||||||||||||||||||||||||||||||||||||||||||||||||||||||||||||||||||||||||||||||||||||||||||||||||||||||||||||||||||||||||||||||||||||||||||||||||||