|
|
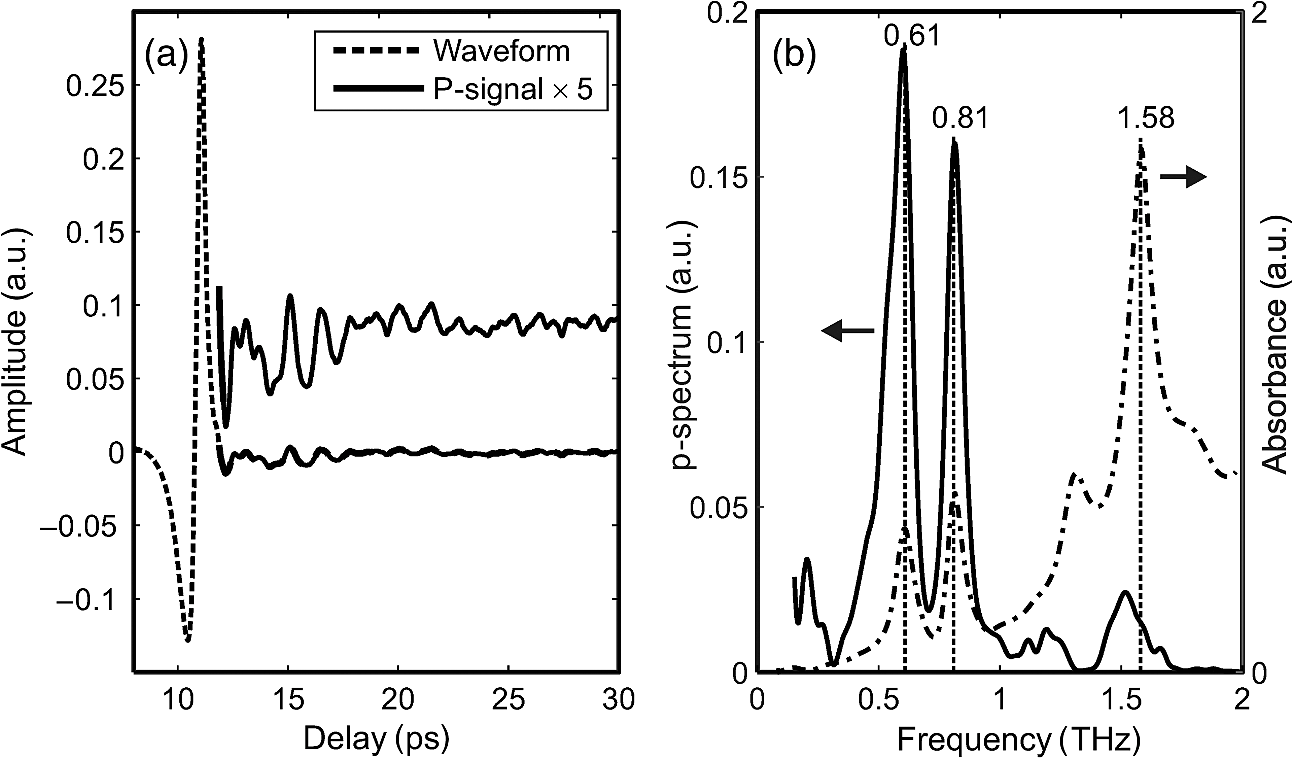
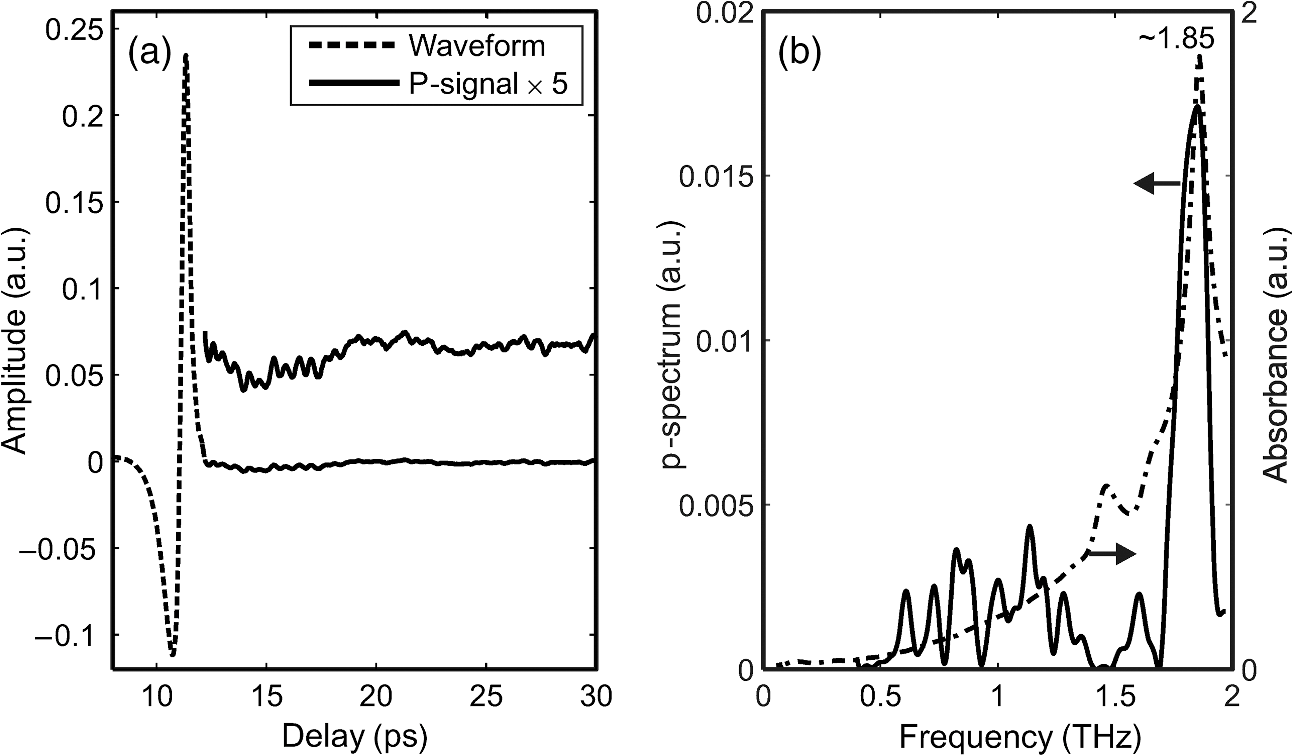
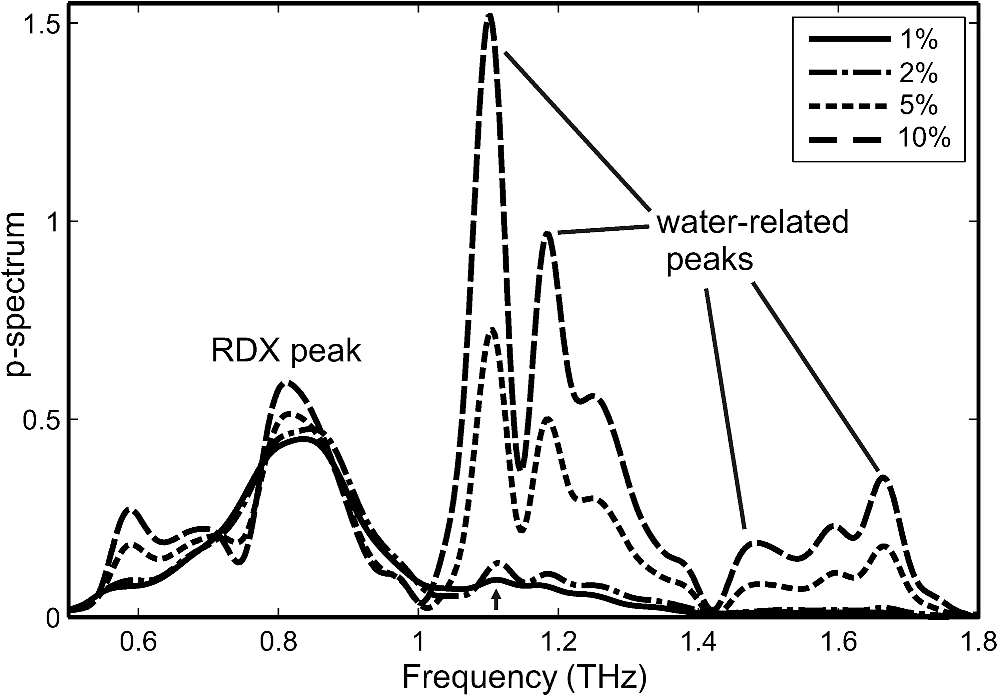
1.IntroductionTerahertz (THz) radiation in the range of 0.3 to 3.0 THz has a strong potential for use in identification of covered explosive materials because of two key factors. Some commonly used explosive materials, such as hexogen (RDX), octogen (HMX), and penthryte (PETN) possess distinctive transmission1,2 and reflection3,4 spectral features (called “fingerprints”) in the THz regime. Also, most commonly used nonpolar dielectric covering materials, such as cotton, polyester, paper, and plastic materials, show low absorption of THz waves. Since the attenuation properties of most explosive materials are relatively high,2 the transmission configuration seems to be more applicable to samples that are a few millimeters thick, e.g., for use in mail scanners. In contrast, the reflection configuration is safer for inspection applications and is more suitable for performing detection on people and inside envelopes or bags. However, the reflection configuration is more complicated owing to the small reflectance from pure explosive materials,4 the strong attenuation properties of water vapor, the scattering effects related to the morphology of the sample5,6 as well as to the attenuation properties of the covering layers.4,7 Therefore, many advanced techniques and signal processing algorithms that are mainly based on time-domain spectroscopy (TDS)1–4 have been proposed for the detection of dangerous materials in the reflection configuration. The first THz post scanner, T-cognition 1.0, which used a chemometric method along with principal component analysis,8 is now commercially available. Michalopoulou et al.9 applied a modified least-squares approach and multilayer perceptrons to increase the probability of detection of RDX. The cepstrum method was studied to recover the spectral features of rough dielectric materials from diffuse THz scattering.10 Liu et al. used the Kramers–Kronig transform to obtain the absorption spectrum from the measured reflection spectrum and were able to identify RDX even when the sample was covered with optically opaque materials.11 An identification technique based on the second derivative of the phase of the signal with respect to frequency was proposed for certain materials (including RDX).12 Trofimov et al.13 applied the spectral dynamics analysis method for identification of explosives in the reflection regime. In this article, we propose a new signal processing method to reveal characteristic THz fingerprints of materials covered with semitransparent layers such as a sheet of polyethylene or paper in the range of about 0.5 to 1.8 THz. The method takes into account the only part of the signal reflected from the covered sample that is then analyzed in the frequency domain with the Fourier transform. The obtained spectrum has very distinctive peaks that correspond to the main peaks measured in the transmission configuration, and this obtained spectrum is what in turn makes reliable identification possible. 2.Conventional TDS of MaterialsTDS (Refs. 1–4) is a mature and commonly used technique in the THz range to measure various spectra of materials. We used a commercially available spectrometer TPS 3000 from TeraView with transmission and reflection units [Fig. 1(a)] in order to generate and detect an approximately 1-ps-long pulse of electromagnetic radiation. The main parameters of the systems are as follows: a spectral range of 0.1 to 3.0 THz with a resolution of 0.06 THz, a dynamic range of 70 dB, and a signal-to-noise ratio of , where the rapid scan mode was used with a rate of . The spectrometer is purged with dry air to decrease the humidity to , thus eliminating the influence of water vapor. Fig. 1Simplified layout of the reflection setup (a) and a graph of the reference pulse (b). The inset shows the power spectrum of the reference pulse. 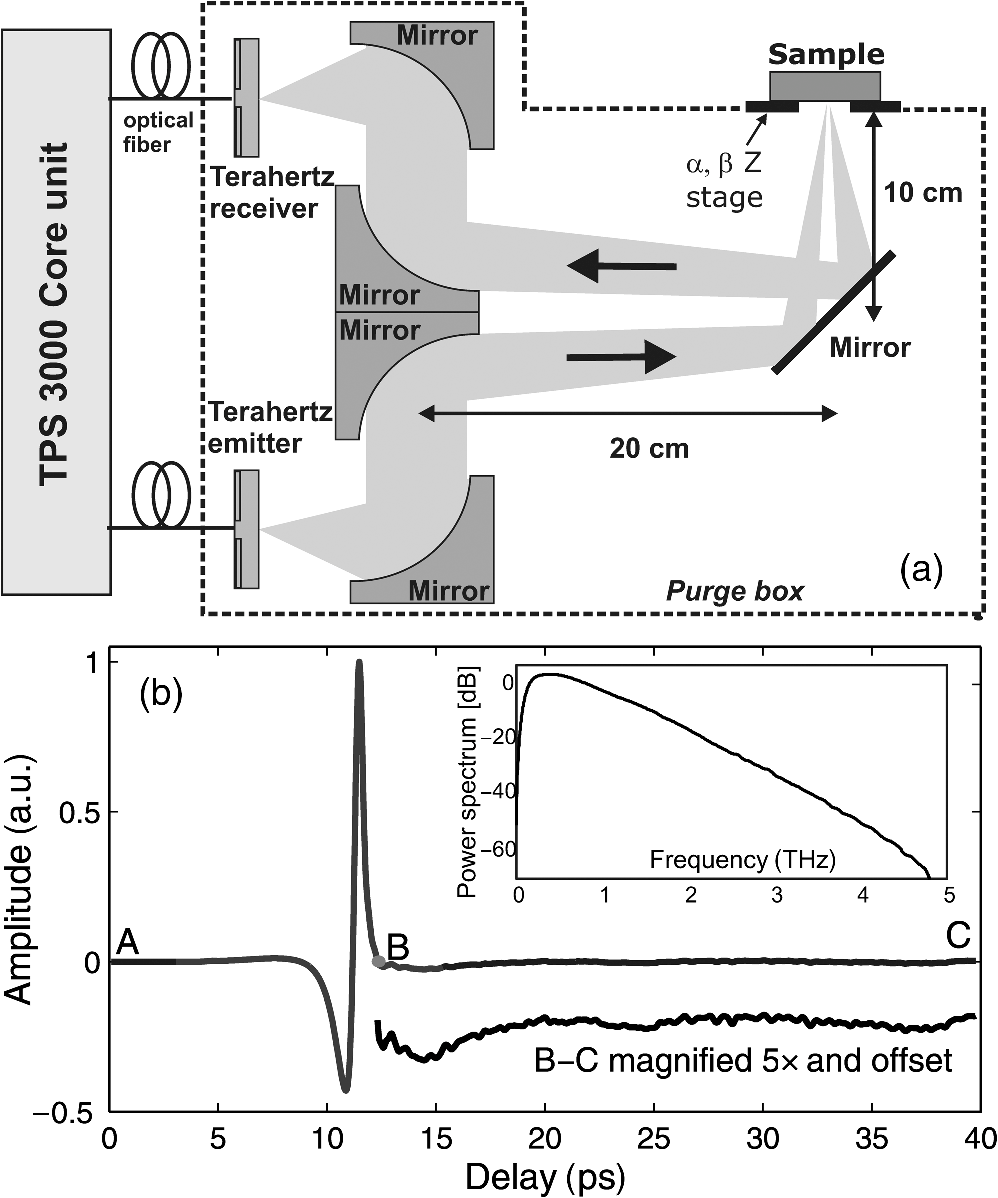 In the transmission configuration, a pulse traveling through a sample carries spectral information about the sample material. The following materials were examined: RDX, lactose monohydrate, sucrose, 4-aminobenzoic acid (PABA), and l-tartaric acid. Each material’s complex refractive index can be determined by means of the commonly known procedure described in Refs. 2 and 4. The reflection measurements were carried out in an external free-standing module with a fiber-fed emitter and detector [Fig. 1(a)] connected to the core unit of the Spectra 3000. The electromagnetic pulse [Fig. 1(b)] was focused on a sample and, after specular reflection, was collected and focused onto the detector. The incident angle was 7 deg. For investigation of reflections, pellets, each with a 30-mm diameter and a thickness of about 5 mm, were manufactured by means of a hydraulic press, which ensured the surface’s physical flatness and smoothness. Fine powders of the above-mentioned substances were mixed with a few percent of a plasticizing material to mechanically stabilize the pellets. The samples and a gold reference mirror were placed on a horizontal motorized stage with vertical (), pitch (), and yaw () adjustments that each provided optimal conditions for the specular reflection. The reflectance spectrum was experimentally determined by dividing a power spectrum of the sample by a power spectrum of the gold mirror reference, measured in an otherwise identical fashion. The obtained transmission characteristics are presented in Figs. 2Fig. 3Fig. 4Fig. 5–6, on a logarithmic scale, using the absorbance. The positions of the peaks in the absorbance agree well with results obtained by other groups.1–4,14 Some minor differences are probably associated with the use of different materials and setups. The peaks in the absorbance profiles are associated with features (slopes) in the reflectance spectrum [Fig. 2(c)] that can be explained using dispersion at a resonance in the Lorentzian harmonic oscillator model. Fig. 2The p-spectrum concept for RDX: the reflected pulse and the p-signal (magnified and offset for clarity) (a), the calculated p-spectra (b), the measured absorbance and the reflectance (c). 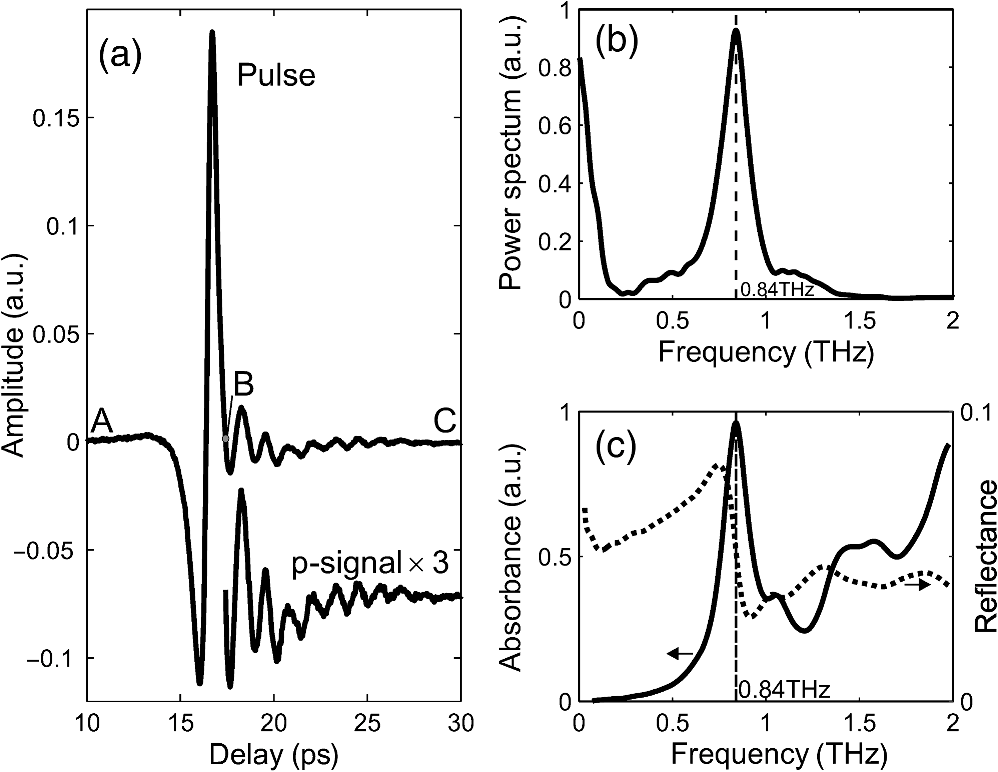 Fig. 3RDX: the reflected waveform with the p-signal (also magnified and offset for clarity) (a) as well as the p-spectrum (b). 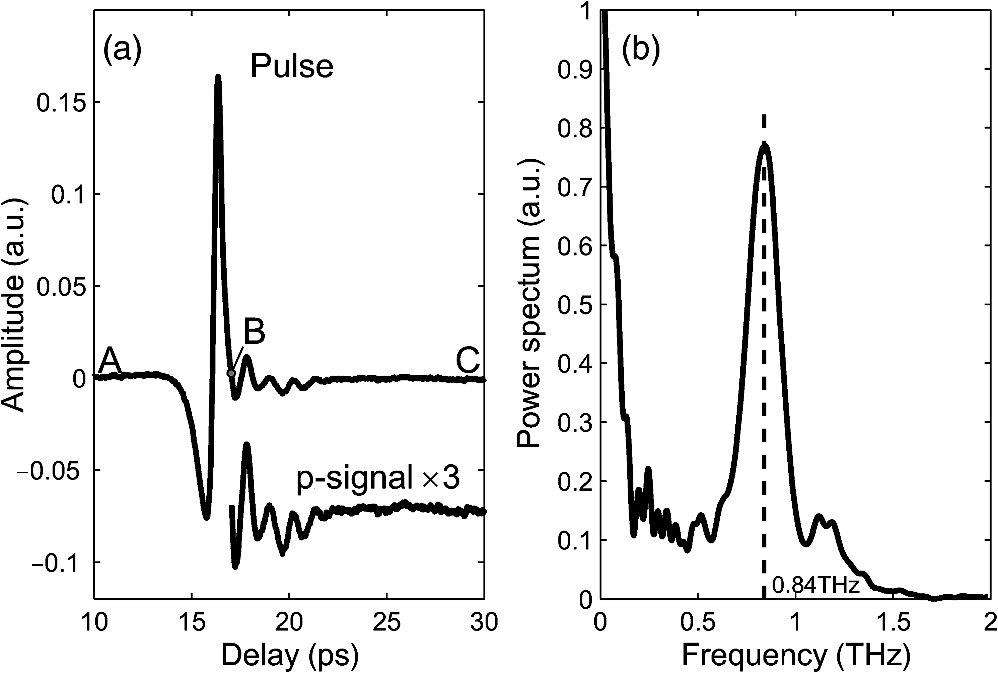 Fig. 4Lactose monohydrate: the reflected waveform with the p-signal (also magnified and offset for clarity) (a), as well as the p-spectrum and the absorbance (b). 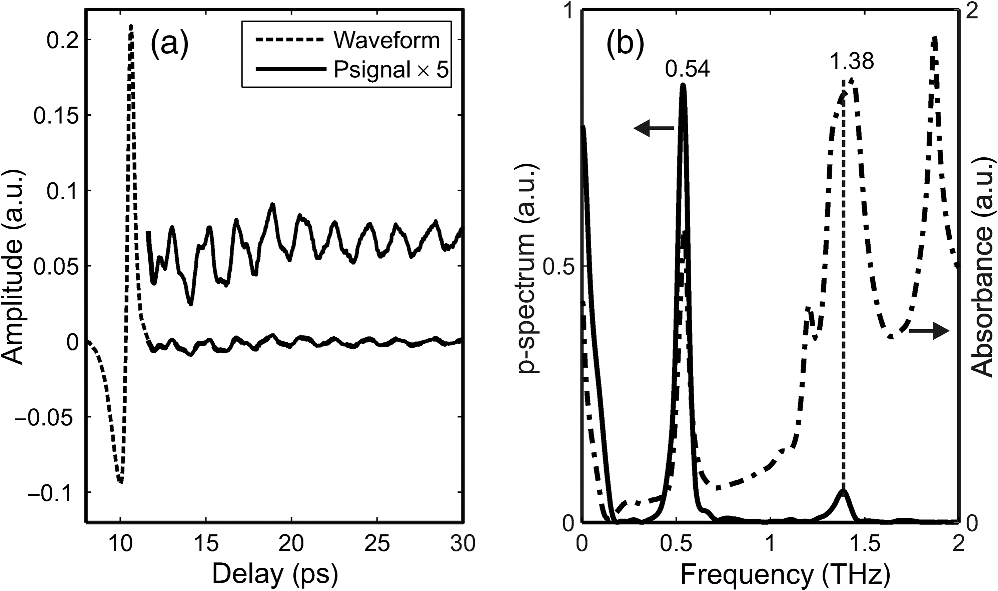 3.p-Spectrum MethodThe primary fingerprints of the materials for the range of up to about 2 THz can also be determined in another way. The proposed technique takes into account only part of the reflected pulse (called a p-signal) and is called a p-spectrum method. For simplicity, let us assume a flat and smooth pellet of RDX with the complex refractive index , which is illuminated normally with the electromagnetic pulse presented in Fig. 1(b). One can obtain the formula for the reflected pulse as where is the inverse numerical Fourier transform and is the complex amplitude reflection coefficient:Figure 2(a) presents the pulse reflected from the sample of RDX, calculated by means of Eqs. (1) and (2). This signal can be divided into the main pulse between points A and B and the p-signal between points B and C. The change of this initially flat part of the incident signal results from interaction of the radiation with molecules of the material (RDX) owing to intramolecular and intermolecular vibrational modes.2 The first zero value after the main pulse (point B) was arbitrarily selected as the point at which the reflected pulse waveform was split into these two signals. The p-signal is apodized with the Hamming window from the right side to smooth the discontinuities at the end of the sampled time record. The second step in the method is to calculate the power spectrum of the p-signal by means of the Fourier transform. One may observe in Fig. 2(b) that this spectral characteristic (called the p-spectrum) has a very distinctive peak at 0.84 THz, which corresponds to the maximum of the absorbance of RDX [Fig. 2(c)], measured in the transmission configuration. Unfortunately, most of the weak absorption features of RDX in the range of 1 to 2 THz cannot be identified. Simultaneously, the reflectance determined from the entire pulse in the manner described in Sec. 2 in the setup presented in Fig. 1(a) reveals the “classic” slope at 0.84 THz and the remaining small features [Fig. 2(c)]. Figure 3(a) presents the signal reflected from the sample of RDX measured in the setup presented in Fig. 1(a) as well as the corresponding p-signal, which begins at the first zero value after the main peak. The experimentally determined p-spectrum (the power spectrum of the p-signal) shown in Fig. 3(b) agrees well with the calculated characteristic, taking into account the positions and shapes of the peaks. The differences are associated with the scattering that occurs at the sample’s surface. The shape of the incident pulse is crucial for this method. An optimal pulse should consist of only one period of electromagnetic field between points A and B [as in Fig. 1(b)], and its p-signal should be flat and equal to 0 between points B and C. Any additional “waves” after the main pulse will add some spectral features to the p-spectrum, which can distort the material-related features. The strong signal at low frequencies in Figs. 2(b) and 3(b) results from the fact that the incident pulse is not completely flat between points B and C [Fig. 1(b)]. Figures 4–7 show waveforms with p-signals reflected from the samples of lactose monohydrate, PABA, l-tartaric acid, and sucrose, as well as a comparison of the p-spectrum and the absorbance results. The agreement of the peak positions is very good for all samples; only small discrepancies of about 10 to 20 GHz are observed. The method is limited to about a maximum frequency of 1.8 THz because its sensitivity is associated with the spectrum of the incident pulse [the inset in Fig. 1(b)]: the higher the frequency, the lower the signal, which explains the strong noise in the case of sucrose [Fig. 7(b)]. For the same reason, the p-spectrum peaks at lower frequencies show larger amplitudes in comparison to those of peaks at higher frequencies [e.g., Fig. 5(b)]. 4.Application of the p-Spectrum Method to Covered SamplesIt is commonly known that THz radiation can be used to identify materials hidden inside a paper or plastic envelope, owing to the fact that these barrier layers are quite transparent in the frequency range .7 If a TDS pulse is incident on a sample covered with a barrier layer, then in this arrangement, the reflected waveform consists of a series of pulses reflected from all interfaces. Therefore, analysis of the waveform reflected from the covered sample depends on the distance(s) between the sample and the covering layer(s). Generally, if the distance between the covering materials and the sample is , reflected pulses from the covering layer(s) can be separated based on the time delay of the pulse reflected from the sample. The pulse reflected from the sample is, in the general case, only attenuated, and its spectrum is not distorted. Therefore, one can determine both the reflectance and the p-spectrum in the manner described in Sec. 3, and the characteristic “fingerprints” are clearly visible in both spectra. The reflected pulses associated with the sample and the covering layer cannot be separated if the distance between them is less than about 1 mm. Such reflections are usually adjacent to each other or even partially superimposed, and this arrangement is depicted in Fig. 8(a) for the RDX pellet covered with a sheet of ordinary paper with an areal weight distribution of . Based on the entire waveform, the reflectance consists of periodic oscillations that are associated with the amplitudes and positions of the main pulses, and therefore, features related with the sample are difficult or impossible to observe [Fig. 8(b)]. Fig. 8The RDX sample covered with a sheet of paper: the waveform with the p-signals (magnified and offset for clarity) (a), the reflectance (b), and the p-spectra (c).  In contrast, we can easily use the p-spectrum method to identify spectral features in the p-signal. In this case, the splitting point is arbitrarily determined as the first zero value after the last high pulse [“first p-signal” in Fig. 8(a)], which is related to the sample surface. The related p-spectrum characteristic of the covered RDX is presented in Fig. 8(c). It can be observed that the characteristic shape remains almost the same in comparison to the uncovered sample of RDX [Fig. 8(b)]. The peak at 0.84 THz is shifted to 0.82 THz but remains clearly visible. The amplitude of this peak is expectedly smaller owing to the attenuation properties of the paper. Figure 8 also shows the p-signals and the related p-spectra calculated for the second and third zero values after the last high pulse. The amplitude of the peaks decreases for higher zero values, but the corresponding frequency does not change. To check the accuracy of this method, other RDX-based samples were also prepared: a plastic mixture of powdered PETN, RDX, and PE (40%, 40%, 20%), which is similar to Semtex H; a plastic mixture of powdered RDX and PE (80%, 20%), which is similar to C4; and powdered pure RDX. Figure 9 shows the results of the p-spectrum analysis for the following conditions: RDX (pellet), C4, and PETN+RDX+PE covered with a thin polyethylene sheet and a sheet of paper, as well as powder RDX covered with a thin polyethylene sheet. All samples were flat to provide optimal conditions for the specular reflection. As can be observed, for all three samples the characteristic RDX peak remains almost at the same frequency in comparison to the uncovered sample of RDX [Fig. 3(b)] and is clearly visible. The amplitudes of this peak are expectedly smaller due to the attenuation of the paper and the sheet, as well as due to the smaller amount of RDX material in the PETN+RDX+PE sample. Fig. 9The p-spectrum characteristics for the covered samples of lactose monohydrate, PABA, l-tartaric acid, and sucrose. 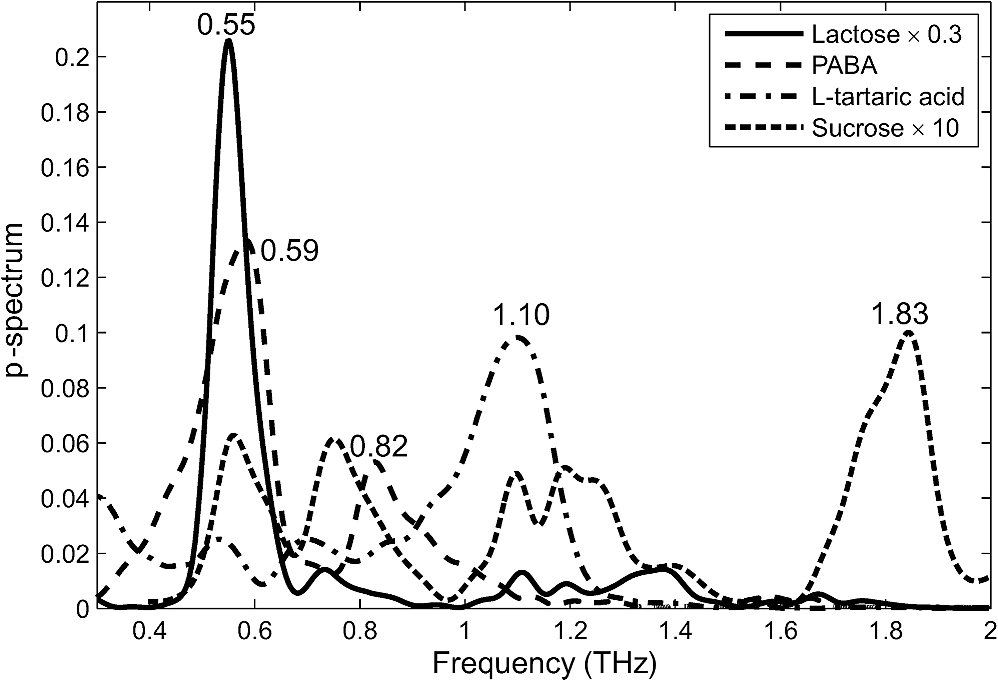 Figure 10 shows the results of the p-spectrum analysis for pellets made of lactose monohydrate, PABA, and l-tartaric acid (covered with a thin polyethylene sheet and a sheet of paper) and sucrose (covered only with the polyethylene sheet). Waveforms with a few pulses associated with reflections from the covering layers are observed, but the p-spectrum analysis reveals the characteristic features of the investigated samples. Owing to influences introduced by the covering layers, which add some destructive inputs to the p-signal, the peak positions in the p-spectrum are shifted insignificantly () in comparison to those of the uncovered samples (Figs. 3–7). The amplitudes of the peaks decrease with the frequency not only due to the descending spectrum of the incident pulse but also owing to the fact that the attenuation properties of the covering materials, especially paper, increase with frequency. These factors explain the strong noise and low peak amplitude in the case of sucrose. Fig. 10The p-spectrum characteristics for the covered samples of lactose monohydrate, PABA, l-tartaric acid, and sucrose.  All described observations were carried out in the purged chamber to eliminate the influence of the water vapor. Figure 11 presents p-spectra of the RDX pellet covered with the polyethylene sheet and the sheet of paper for various humidity levels from 1% up to 10%. Humidity manifests itself as an increase of the level of the waves in the p-signal and results in additional water-related peaks, which increase with the humidity level and suppress the appearance of sample-related features in the measured profiles. Moreover, the more humid the environment is, the more shifted toward 0.8 THz the RDX peak is. The total length of the THz beam in the chamber is about 1 m, and such a long interaction distance explains the fact that the water-related peak at about 1.1 THz is visible even for 1% humidity. It can also be concluded that the small water features are emphasized by the p-spectrum method. 5.ConclusionsIn conclusion, we have proposed a new TDS-based method for extracting spectral fingerprints from materials, based on the frequency analysis of the reflected signal from the sample. The obtained spectrum has very distinctive peaks that correspond to peaks measured in the transmission configuration. The most important advantage of the p-spectrum method is that it can be used for the identification of uncovered materials as well as for the identification of substances covered with a few layers of commonly used packaging materials such as plastic sheets and paper, which are all semitransparent in the THz range. We showed results obtained for the covered samples of RDX-based materials, lactose monohydrate, PABA, l-tartaric acid, and sucrose and obtained similar results for other materials that have fingerprints in this spectral region, such as glucose and salicylic acid. Owing to the low signal level at higher frequencies [see the inset in Fig. 1(b)], the applied technique is restricted to frequencies of about 1.8 THz. Additionally, explosive materials with characteristic features (PETN and HMX) are difficult to analyze with our setup. A setup with a higher signal level, in the range of 1.5 to 2.5 THz, could probably cope with this limitation. On the other hand, the attenuation properties of most materials (such as paper and plastics) increase sharply at higher frequencies, and this issue seems to be the most important constraint in detecting covered PETN and HMX. The proposed method is reference free and is based only on the analysis of the signal reflected from the sample, which considerably simplifies the measurements. This technique is sensitive to atmospheric water vapor. Humidity manifests as an increase in the level of waves in the p-signal and thus results in additional water-related peaks, which suppress and deteriorate the appearance of sample-related features in the measured profiles. Therefore, a water vapor elimination algorithm must be developed to enable proper operation under conditions where purging is not possible. Covering materials can shift peak frequencies by , which can hamper the identification of the material in real security applications, where one is only interested in distinguishing between dangerous and safe materials. Although the spectral feature of RDX-based explosives at 0.84 THz is quite unique, a small frequency shift in combination with deterioration of the p-spectrum shape can increase the number of false alarms raised by a p-spectrum-based sensor. However, we believe that this technique can be useful in combination with other methods to identify concealed compounds. AcknowledgmentsWe acknowledge financial support from Polish Ministry of Science and Education under the Project O R00 0034 12. ReferencesM. C. Kempet al.,
“Security applications of terahertz technology,”
Proc. SPIE, 5070 44
–52
(2003). http://dx.doi.org/10.1117/12.500491 PSISDG 0277-786X Google Scholar
J. Chenet al.,
“Absorption coefficients of selected explosives and related compounds in the range of 0.1–2.8 THz,”
Opt. Express, 15
(19), 12060
(2007). http://dx.doi.org/10.1364/OE.15.012060 OPEXFF 1094-4087 Google Scholar
Y. C. Shenet al.,
“Detection and identification of explosives using terahertz pulsed spectroscopic imaging,”
Appl. Phys. Lett., 86
(24), 241116
(2005). http://dx.doi.org/10.1063/1.1946192 APPLAB 0003-6951 Google Scholar
C. Bakeret al.,
“People screening using terahertz technology,”
Proc. SPIE, 5790 1
–10
(2005). http://dx.doi.org/10.1117/12.602976 PSISDG 0277-786X Google Scholar
M. Ortolaniet al.,
“Surface roughness effects on the terahertz reflectance of pure explosive materials,”
Appl. Phys. Lett., 93
(8), 081906
(2008). http://dx.doi.org/10.1063/1.2973403 APPLAB 0003-6951 Google Scholar
L. M. Zurket al.,
“Scattering effects in terahertz reflection spectroscopy,”
Proc. SPIE, 6949 646807
(2008). http://dx.doi.org/10.1117/12.784222 PSISDG 0277-786X Google Scholar
A. J. Gatesmanet al.,
“Terahertz behaviour of optical components and common materials,”
Proc. SPIE, 6212 62120E
(2006). http://dx.doi.org/10.1117/12.668384 PSISDG 0277-786X Google Scholar
F. Ellrichet al.,
“Chemometric tools for analyzing terahertz fingerprints in a postscanner,”
in 37th Int. Conf. Infrared, Millimeter and Terahertz Waves,
(2012). Google Scholar
Z. Michalopoulouet al.,
“RDX detection with THz spectroscopy,”
J. Infrared Millimeter THz, 31
(10), 1171
–1181
(2010). http://dx.doi.org/10.1007/s10762-010-9693-1 1866-6892 Google Scholar
S. Schecklmanet al.,
“Terahertz material detection from diffuse surface scattering,”
J. Appl. Phys., 109
(9), 094902
(2011). http://dx.doi.org/10.1063/1.3561806 JAPIAU 0021-8979 Google Scholar
H.-B. Liuet al.,
“Detection and identification of explosive RDX by THz diffuse reflection spectroscopy,”
Opt. Express, 14
(1), 415
–423
(2006). http://dx.doi.org/10.1364/OPEX.14.000415 OPEXFF 1094-4087 Google Scholar
H. Zhonget al.,
“A phase feature extraction technique for terahertz reflection spectroscopy,”
Appl. Phys. Lett., 92
(22), 221106
(2008). http://dx.doi.org/10.1063/1.2938055 APPLAB 0003-6951 Google Scholar
V. A. Trofimovet al.,
“Efficiency of the detection of explosive using the spectral dynamics analysis of reflected signal,”
Proc. SPIE, 8189 81890I
(2011). http://dx.doi.org/10.1117/12.897900 PSISDG 0277-786X Google Scholar
W. R. Tribeet al.,
“Hidden object detection: security applications of terahertz technology,”
Proc. SPIE, 5354 168
–176
(2004). http://dx.doi.org/10.1117/12.543049 PSISDG 0277-786X Google Scholar
Biography Norbert Palka received an MSc degree in physics (with a focus in fiber optics technology) and a PhD degree in optoelectronics, both from the Military University of Technology, Warsaw, Poland, in 1999 and 2003, respectively. In 1999, he joined the Military University of Technology as a researcher at the Institute of Optoelectronics. Since 1999, his scientific interests have been in various sensors and systems for security: fiber optics, CCTV, and thermal cameras. Since 2008, he has focused on terahertz technology: detection of explosives, body scanners, and nondestructive evaluation of composite materials. |