|
|
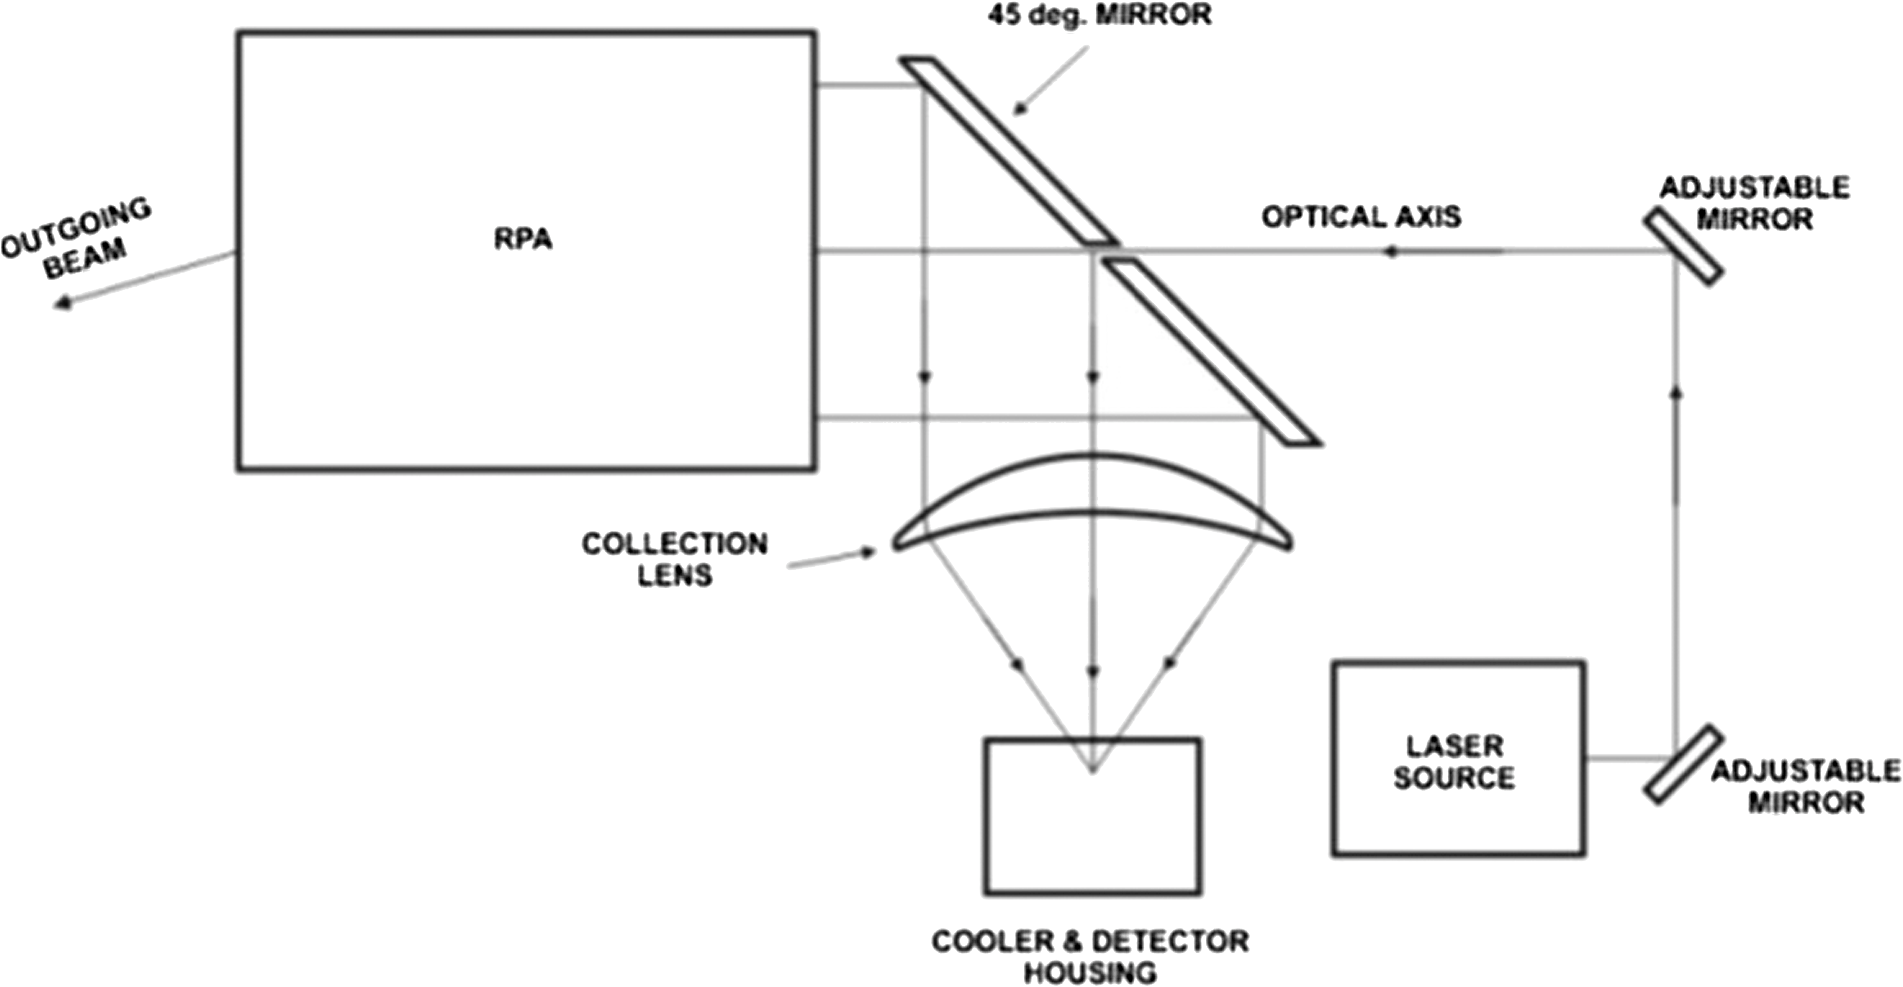
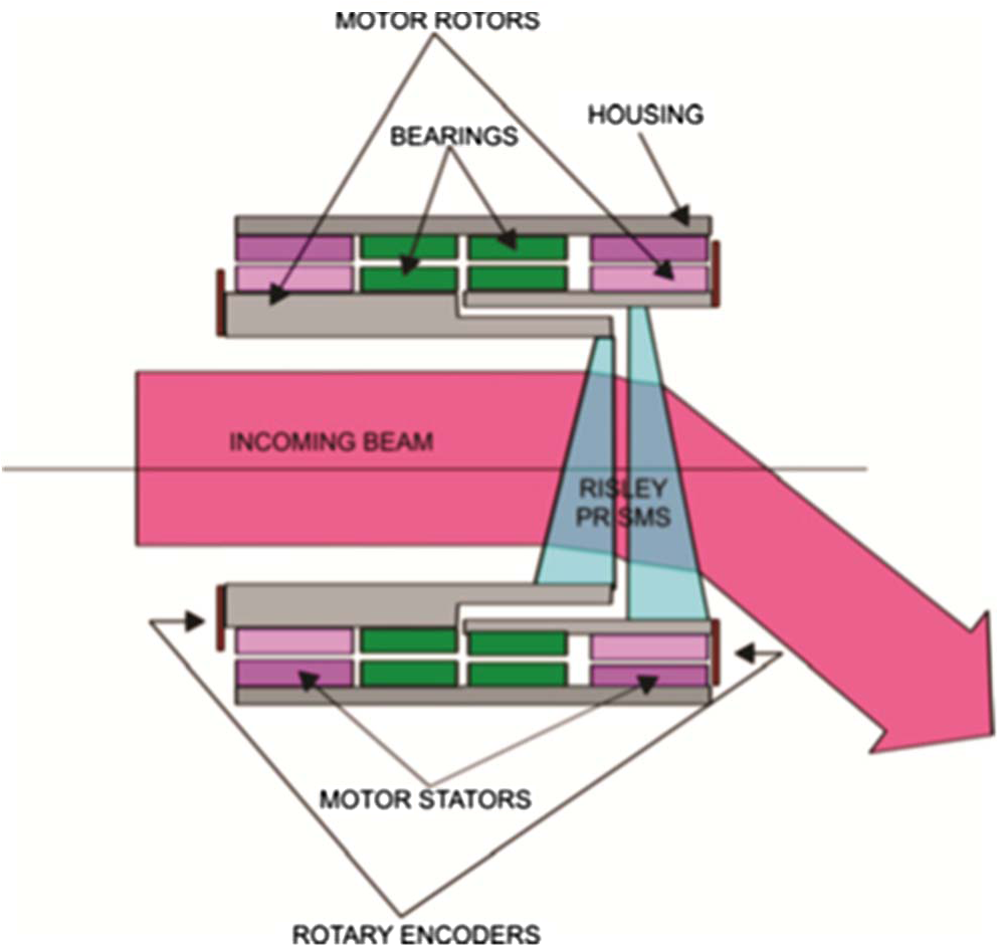
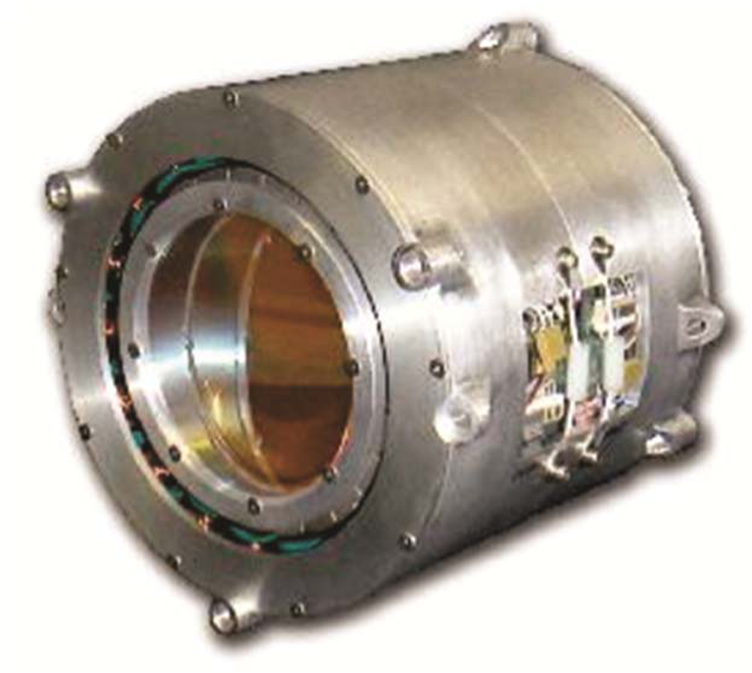
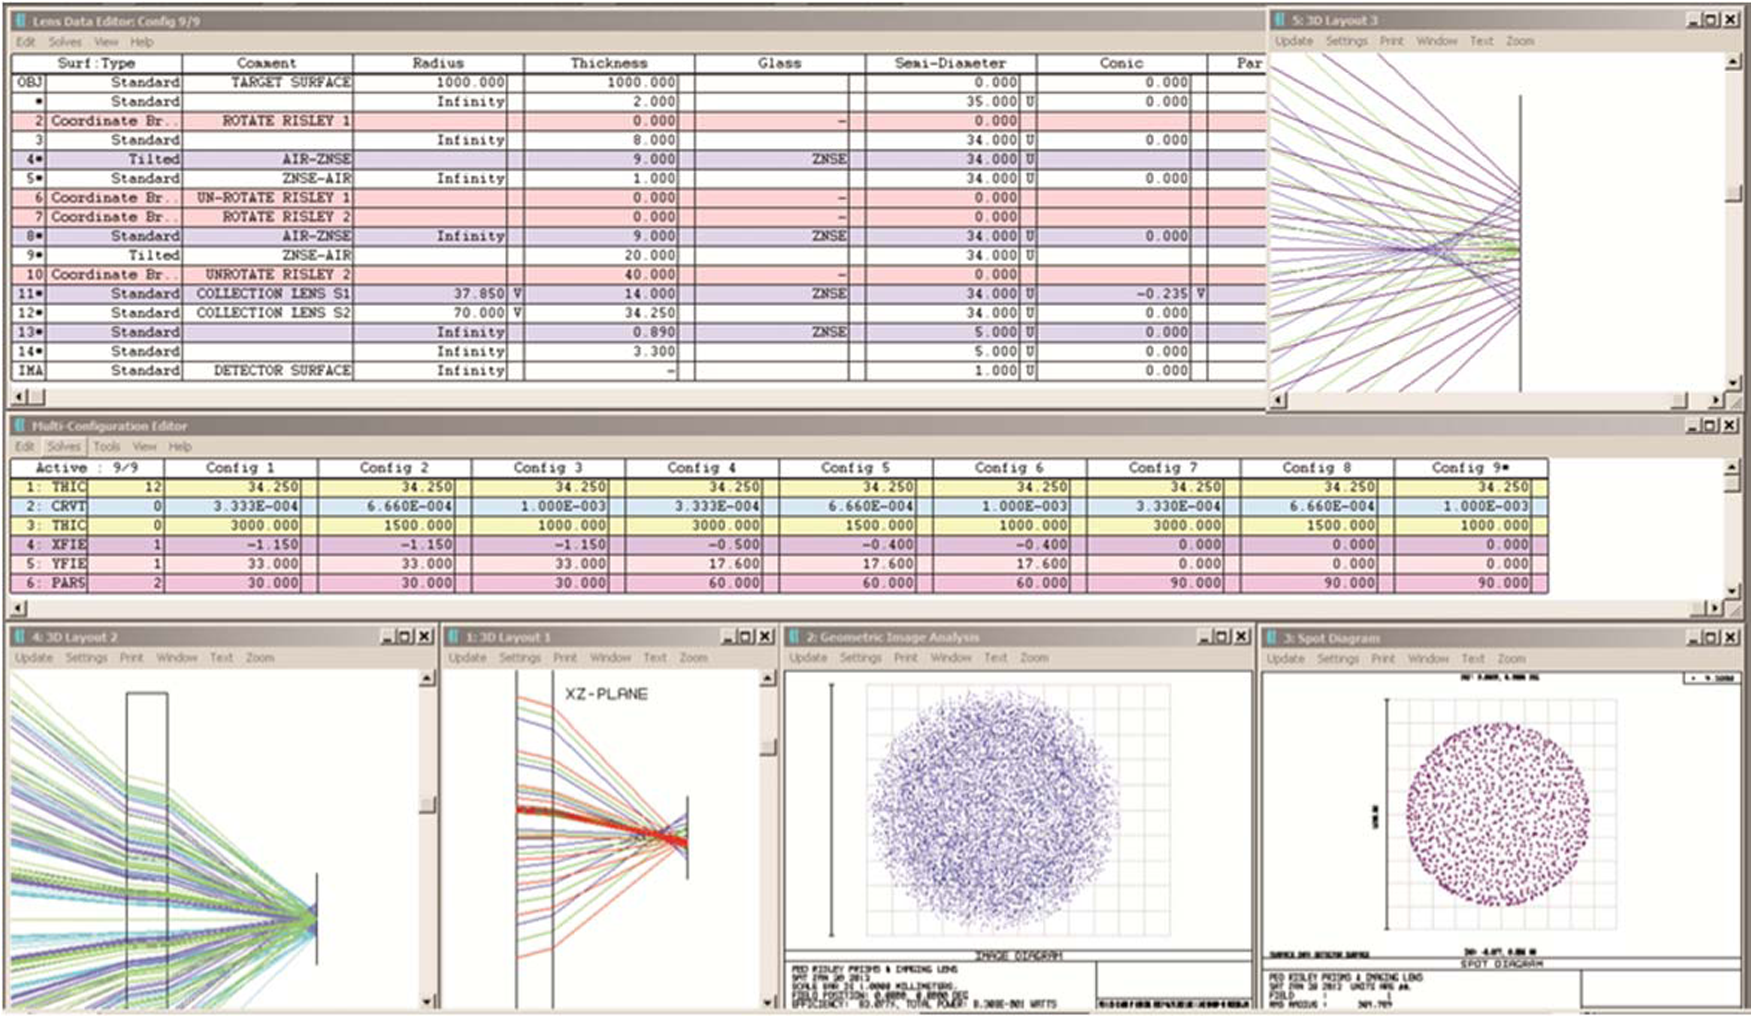
1.IntroductionThe detection and identification of explosive materials are important issues in modern society. The need exists for sensitive, compact, and low-cost standoff systems that can support applications in military and civilian environments in order to counter improvised explosives devices and homemade explosives. Optical techniques operating in the long-wave infrared (LWIR) provide an effective solution owing to the availability of a rich level of vibrational spectroscopic information that can distinctly and uniquely describe the materials comprising the explosive compounds. Recently, the development of room-temperature and modest power quantum cascade lasers1 spanning the LWIR has enabled the development of active standoff explosive detection systems.2 Original methods pursued trace-level explosive detection in the gas phase.3 However, the lower vapor pressures of the materials of interest and the ability to further attenuate with simple masking methods made trace detection difficult at meaningful standoff distances.4 Instead, current active source methods leverage detection in the solid phase using Raman techniques,5 laser-induced breakdown spectroscopy (LIBS),6,7 laser-induced fluorescence,8 diffuse reflectance spectroscopy (DRS),9 photoacoustic spectroscopy,10 and photothermal spectroscopy (PTS).11 In all cases, a laser beam is directed toward the item of interest in order to elicit a signal of interest, which is then collected back at the source for evaluation. The process is similar to Lidar, and the combination of small amounts of material at trace concentrations and the effective isotropic scattering that plagues all Lidar processes leads to extremely low efficiencies, e.g., less than or one photon of interest for every billion photons sent out. As a result, systems are typically based on cooled detector technology, and assuming detector-limited noise performance, the accessible standoff range ultimately becomes equivalently represented by the size of the aperture used to collect the returning light. In the context of realizing a compact, mobile, and low-cost solution, this throughput limit essentially limits practical aperture sizes to no more than a few inches maximum. In order to be effective, standoff explosive detection systems need to be able to provide coverage over a reasonable lateral spatial extent such as the doorway of a building entrance, the side of a car at a checkpoint, or the ground in front of a vehicle in transit, which can be accomplished through the use of a laser-pointing device. The field-of-view necessary for monitoring buildings entrances, checkpoints, and roads is typically in the vicinity of 45 deg. Further benefit is achieved with a laser-beam director that can quickly scan the field of regard (FOR) to search for and then identify potential areas of interest and then rapidly point to a suspected location and confirm the existence of an explosive using spectroscopic information. Potential laser-scanning devices include gimbal type mirrors, galvo scanners, fast steering mirrors, and Risley prism scanners. However, as gimbal mirrors can easily meet hemispherical fields of view, they are quite large and generally too slow for efficient collection. Similarly, the cantilevered design of a two-axis galvo scanner can also result in a large package for the required aperture and FOR. Fast steering mirrors can provide the necessary response time and aperture, but they are generally limited to fields of view on the order of a few degrees. Alternatively, a Risley Prism Scanner (RPS) can provide a modest clear aperture, large FOR, and fast response time and scan speeds in a small package requiring low-operating power. In the following sections, a schematic for the layout of a scan-based approach is first provided along with the general requirements. This is followed by an overview of an RPS design. The optical design is presented for a DRS standoff explosive detection. A prototype system incorporating a commercial-off-the-shelf tunable laser and cooled HgCdTe (MCT) detector was fabricated and tested against trace levels of simulant 2,4-dinitrotoluene (DNT) and actual explosive materials 2,4,6-trinitrotoluene (TNT), cyclotrimethylene trinitramine (RDX), and pentaerythritol tetranitrate (PETN), and the results are presented. Finally, conclusions are summarized at the end of the article. 2.System Layout and RequirementsFigure 1 shows the layout for a field scanning standoff explosive detection system. The laser is aligned to the system’s optical axis with a pair of small fold mirrors and then passed through a hole in the fold mirror. The RPS then steers the radiation to a point in the field, where the energy interacts with the target to generate the desired signal, e.g., heat, sound, fluorescence, which, in this case, is diffusely reflected light. A portion of the scattered light is collected by the Risley and steered back onto the fold mirror, where it is directed to the collection lens and then focused onto the cooled single-element detector. Optically, the goal is to steer light over a wide spectral range to the same location in the field and then image that location onto the detector with high efficiency over a modest standoff range. 3.Risley Prism Scanner AssemblyAlthough the use of a pair of prisms to steer and align a laser beam is well known, recently Risley prism systems have seen renewed interest for the application of fast steering of a laser beam over modest to wide, e.g., 30 to 120 deg, FOR.12,13 By combining the prism with a brushless rotary motor, compact steering systems can be realized that provide fast response in an inline design that requires minimal power and makes them attractive for mobile applications on small, unmanned autonomous vehicles such as remotely piloted aircraft and ground-based robots. At the heart of a Risley prism system is a pair of matched glass wedges in series. Based on the simple principle of refraction that results in the bending of light as it passes from one media to another, a glass wedge bends the incident light beam in air at an amount proportional to the wedge angle. As shown in Fig. 2, the pair of wedges can be used to bend the incident light at an amount that is proportional to the rotation angle between the apexes of the two wedges. In Fig. 2(a), the apexes are aligned (0-deg rotation angle), and the input beam is deflected at an amount twice the deflection of a single wedge. In Fig. 2(c), the apexes are opposed (180-deg rotation angle), and the deflection of the beam by the first wedge is exactly cancelled by the second wedge, and the input beam is not deflected. For any other rotation angle, the input beam will be deflected at an angle somewhere between the two extremes of cases of Figs. 2(a) and 2(c). Once the rotation angle between the two prisms is set, the pair can be rotated together to trace out a circle of a given deflection of the input beam. Conceptually, the input beam can be steered to any point within a cone with a half-angle given by twice the deflection of a single wedge by adjusting the rotation angle between the wedges to achieve the desired deflection and then rotating the pair to achieve the desired direction. This process provides the ability for the prism system to point the laser beam throughout the FOR. Additionally, continuously rotating the prisms at different speeds provides the ability to scan the laser beam throughout the field in a repeatable manner.14 Fig. 2Risley prism concept of operations. (a) Aligned prisms achieve maximum deviation of the input light; (b) prisms deviate the light proportional to the rotational angle between the pair; and (c) opposed prisms result in no net deviation of the light. 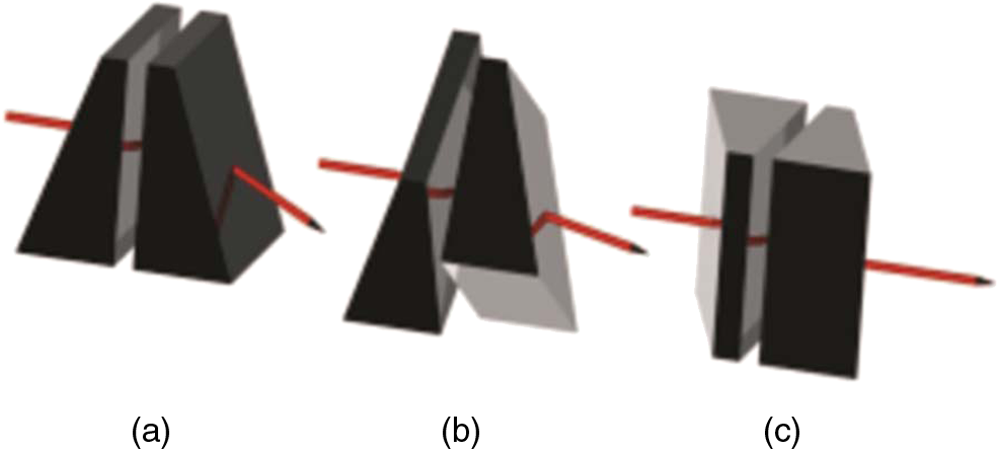 The deflection, , of a single wedge is given by the material refractive index, , and the wedge angle, , as using a first-order approximation of Snell’s law. The maximum deflection is simply twice the prism deflection angle with the resulting FOR given byIn the LWIR, a number of material options for the prisms exist including zinc selenide, zinc sulfide, silicon, and germanium. As an example, a 45-deg FOR in the LWIR can easily be realized with a pair of 8-deg ZnSe wedges. From a fabrication perspective, it is important to match the wedge angles within an acceptable error in order to minimize the region about the optic axis that a steered beam cannot reach. This so-called nadir error, , puts a tolerance, , on the wedge angle, given by the allowed error and refractive index of the material as A nadir error requirement of less than 250 μrad for a ZnSe prism system requires a wedge angle tolerance of 0.25 arc-min, which is readily achieved with standard optical fabrication processes. Due to the refractive nature of the RPS, material dispersion will steer different wavelengths of light in different directions, and it is important to consider the amount of lateral displacement of the beam at the target and to insure that it stays within the spatial extent of the target. Differentiating Eq. (1) and adding a factor of two to account for the prism pair provides the relationship for the worst case lateral color as Based on the dispersion of ZnSe in the LWIR, that results in maximum lateral color at the edge of the FOR of 3 mrad across a 2-μm wavelength range. At a standoff distance of 10 ft, this corresponds to a displacement of 0.3 in., which is about one fifth the size of a typical adult fingerprint. Note that this error is not constant and decreases to zero as the beam is steered along the optical axis.The opto-mechanical layout of a RPS is shown in Fig. 3. The prisms are placed inside a hollow shaft that is mounted to the rotor of the brushless motor, resulting in a low moment of inertia and a small power requirement to accelerate and move the prism. A duplex bearing set minimizes axial and radial runout to provide high-pointing accuracy and repeatability. The rotational angle of the shaft is monitored with a standard optical rotary encoder, which allows the beam to be pointed with high fidelity throughout the FOR. Figure 4 shows a completed RPS system (OPTRA, Inc., Topsfield, Massachusetts, RP-50S) used in this study and incorporates a pair of 12.3-deg ZnSe wedges that provides a 90-deg FOR. 4.Collection OpticsFor a given amount of laser power and system throughput, the maximum standoff range is ultimately limited by the system noise equivalent power (NEP), which can be no better than the detector NEP for a cooled system operating in the LWIR. Thus, achieving the highest possible normalized detectivity () essentially equates to working with the smallest possible detector area. A single collection lens operating at a fixed focus is the ideal solution, as it is the most compact, robust (no moving parts), and the most cost efficient solution. The requirements for the design are to achieve a target image size smaller than the detector size over all measurement ranges from 1 to 3 meters, to support the RPS entrance pupil diameter, and to minimize reflection losses with a fixed focus design to minimize system size, cost, and complexity. These requirements were achieved with a 71.5-mm ZnSe f/0.7 meniscus lens (, ) with a slight aspheric correction on the first surface (). The optimum focus is the location that maximizes the energy collected for all ranges. The fill factor of the detector, , with respect to the image is given by the area of the detector divided by the area of the image of the laser spot on the target at the detector. The size and shape of the image of the laser beam at the target surface for different focus settings and target ranges can be found by ray tracing. The shape is generally elliptical with diameters and . The fill factor divided by the square of the target range provides a radiometric figure of merit and maximizing this ratio over all ranges provides the best collection efficiency. In Table 1, the values of are calculated for detector diameters of 0.5 and 1.0 mm and are then divided by to generate factors that are proportional to the detector signal levels to be expected for different ranges, focal settings, beam-steering angles, and detector sizes. The results show that setting the focus at 1.5 m results in an image size less than a 1-mm detector size for all ranges. As can be seen in the table, this distance balances the amount of defocus at the extremes of the standoff-operating range. Figure 5 shows a ray trace for the collection optics set for a fixed focus at 1.5 m. The inset image at the upper right shows that a sharp image is formed for an object at 1.5 m and equally out-of-focus images for objects at 1.0 and 3.0 m. The scale bar for the spot diagram and geometric image analysis in the lower right is 1.0 mm, and both cases show that the focused energy from the target is efficiently collected with a 1-mm detector. Note that the geometric image is slightly larger than the spot diagram, as it includes the laser-beam divergence. Table 1Collection efficiency for different focus settings and detector sizes.
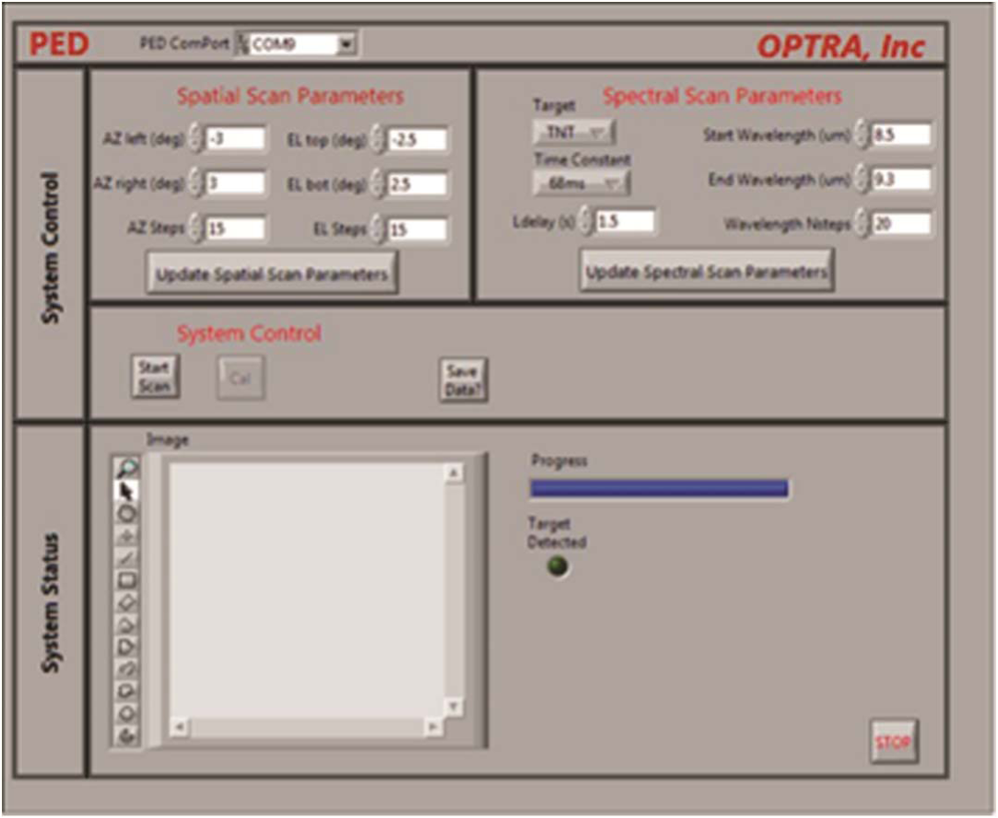
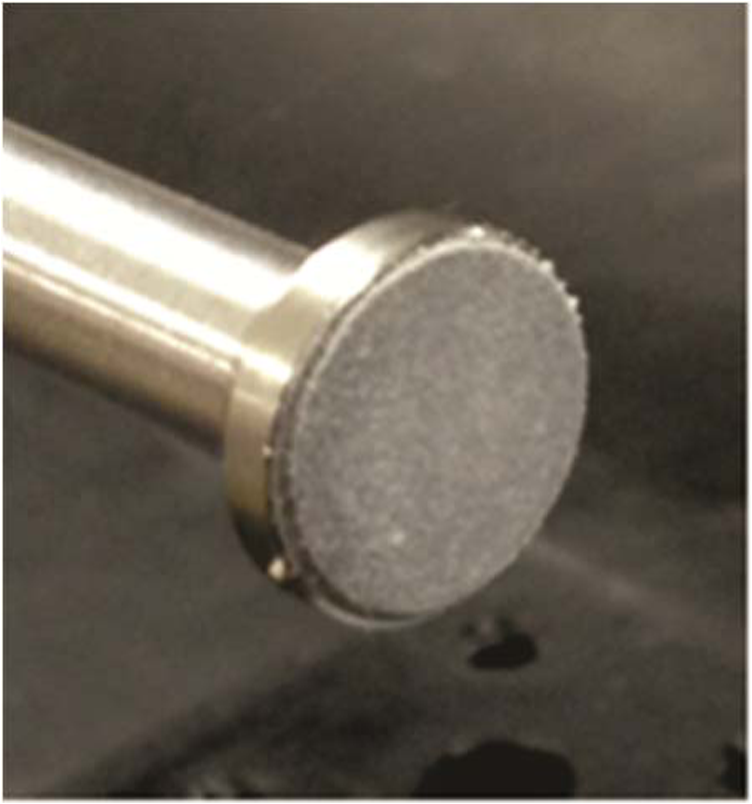
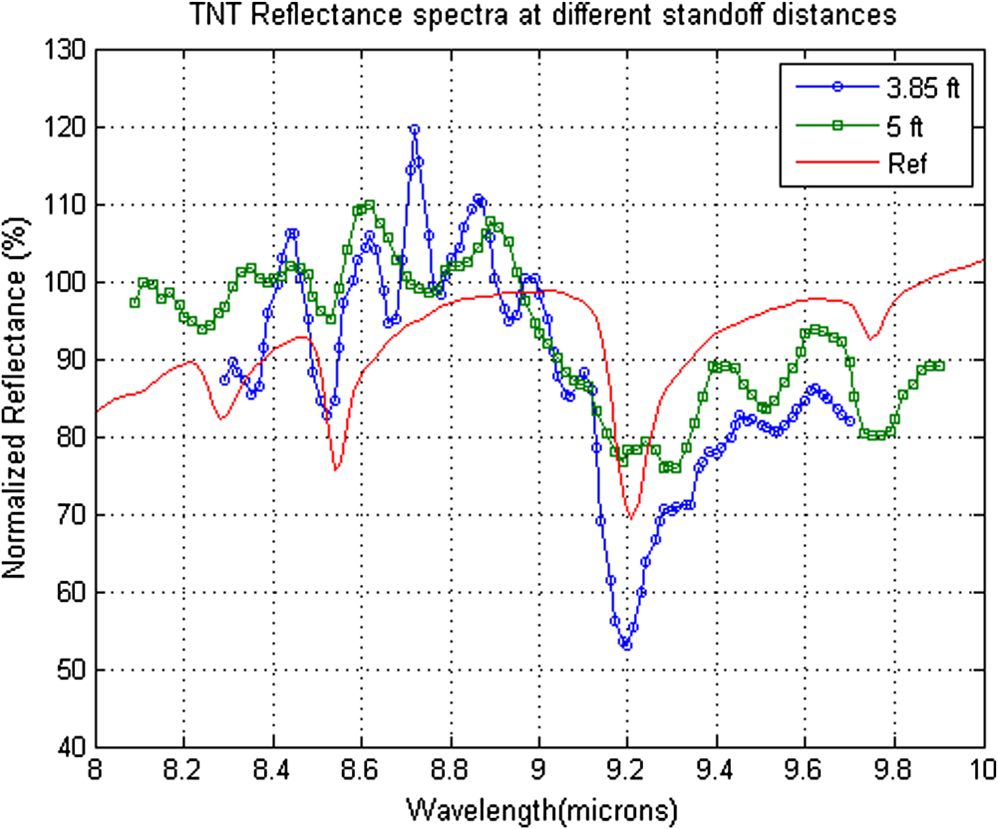
The X and Y dimensions are the size of the rectangle that encloses 90% of the image spot at the detector surface; these sizes were obtained from ray-traced geometrical images of the laser beam on target surfaces at different distances and beam-steering angles from the Risley prism scanner (RPS). F is the fill factor for the detector (F=detector area/image area). F/R2 0.5 and F/R2 1.0 refer to values of F/R2 for detector diameters of 0.5 and 1.0 mm (R in meters). 5.Prototype DRS SystemFigure 6(a) shows the opto-mechanical layout solid model for the prototype explosive detection (PED) system based on the concept shown in Fig. 1. Figure 6(b) shows a picture of the completed system. The prototype has dimensions of , weighs 25 lbs, and requires less than 200-W power. The assembly includes a tunable LWIR laser source, fold mirrors, RPS, collection optics, cooled MCT detector, and all custom control and processing electronics. The source is an extended cavity quantum cascade tunable laser (EC-QCTL) system [Daylight Solutions, San Diego, CA, Übertuner (ÜT)-9]. The ÜT-9 provides peak powers between 120 and 200 mW with duty cycles from 5% to 10% at a pulse repetition frequency of 100 kHz and results in average powers of 6 to 20 mW over the spectral range from 8.3 to 9.9 μm. This range supports the detection of explosives such as TNT, RDX, and PETN, all of which have distinct absorption features in this spectral region. The detector is a 1-mm square MCT photoconductive detector (InfraRed Associates Inc., Stuart, FL, MCT-13-1.00) and is housed in an integral Stirling microintegrated detector and dewar cooler assembly (IDDCA) (InfraRed Associates Inc., K508). The detector operates at 77 K and has a specific detectivity of and a response time of 0.4 μs. Fig. 6Prototype scan-based wide field diffuse reflectance spectroscopy (DRS) standoff explosive detection system. (a) Opto-mechanical computer aided design layout; and (b) picture of the completed system. 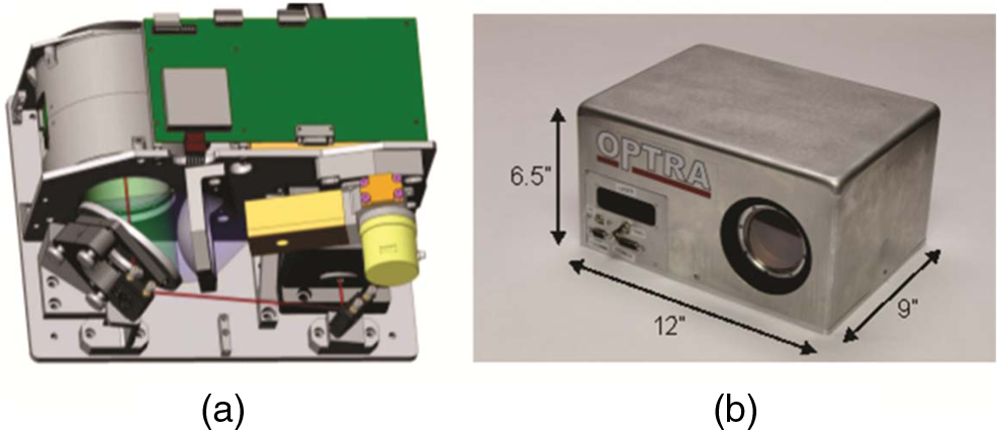 The custom electronics were designed to provide system control and processing. The control electronics have the task of commanding all the system components and maintaining the proper timing between commands. Communication with the system components is accomplished via an RS-232 interface. The control electronics are responsible for initializing the system components and, upon user input, command the system to point to a series of field locations and at each location, in turn, tune the laser wavelength to collect the spectrally varying reflected light signal from the object. The processing electronics obtain the reflectance spectrum by extracting the modulated signal of interest from the background signal. At each wavelength, the magnitude of the reflected signal is recovered by first applying a 5-pole Butterworth low-pass filter to the AC-coupled detector output. This transforms the detected high-frequency pulses into a close approximation of a sinusoid. The magnitude of the reflected signal is then extracted from this sinusoid using synchronous detection with a 50% duty cycle and 100-kHz square wave. The user interface architecture for the PED system has four key components: a computer, a USB to RS232 converter, a microcontroller, and an field programmable gate array (FPGA). The interfaces between these architecture elements and the system hardware are illustrated Fig. 7. Using the graphical user interface (GUI), pictured in Fig. 8, the user can modify spatial or spectral scan parameters and then can command the PED system to start a scan. These commands are transmitted through the computer USB port to the USB to RS232 converter chip (TUSB3410) on the PED controller board. This chip translates USB commands to RS232 commands, which can be understood by the microcontroller. The microcontroller processes these commands and begins executing the scan using the embedded software resident on the chip. For each measurement, the microcontroller sends commands to the laser to adjust the wavelength, to the RPA to adjust the spatial location of the beam, and to the FPGA to implement the appropriate integration time. After each measurement, the FPGA communicates the detected signal level to the microcontroller. The microcontroller saves this raw data to memory and, upon completion of the scan, transmits this data back to the computer, following the reverse path through the converter chip and USB interface. 6.System Test Using Simulants and ExplosivesDiffuse reflectance measurements at various standoff ranges were obtained by applying material to a silicon carbide (SiC) substrate, pointing the laser onto the SiC substrate, and then commanding the laser through a series of wavelengths to obtain a spectrum. This spectrum was then normalized for comparison to a spectral database by dividing it with a reference spectrum of the bare SiC substrate, which accounts for the variation in laser power across the spectral range. The explosive samples were prepared by grinding pellets of the material with a finger onto a SiC substrate, in order to obtain a sample suitable for diffuse reflectance measurement.15 SiC paper is ideal for this wavelength range, as it does not contain features that cause spectral interference. The sample produced contained a fine dust embedded in the sandpaper matrix, as seen in Fig. 9. The DRS spectra for DNT at a standoff distance of 3 ft are shown in Fig. 10 compared with Raman spectra from the University of Rhode Island (URI) explosives database ( http://expdb.chm.uri.edu/). The laser was tuned with a 32-nm step size for a total of 50 points across the 8.2- to 9.8-μm wavelength range. The integration time for each point was 0.68 s. A good match with all the absorption features in this range can be seen in the measured spectra. The spectral width of the feature is strongly dependent on the particle size,16 with significant broadening seen as the particle size increases beyond 75 μm. For the 320-grit SiC sandpaper used, the expected particle size is 80 μm on average. Spectral broadening can clearly be seen in DNT spectral features, as would be expected, given this particle size. The prototype system was transported to the URI Center of Excellence for Explosives Detection, Mitigation, and Response for testing with explosive materials. Measurements were made of TNT at a variety of ranges and concentrations. Figure 11 shows the results for TNT at standoff distances of 3.85 and 5 ft. At both standoffs, features at 8.5 and 9.2 μm are clearly evident. Along with the TNT resonances, the spectra show a distinct cyclical variation. Deposition of the powdered explosive can introduce changes in reflection in both the first surface specular response and diffuse specular response of the material particles.16 The diffuse specular response is caused by multiple reflections of particle surfaces without penetrating into the particle and can lead to nonabsorptive features in the spectrum as well as an increase in reflected signal. Figure 12 shows the results for RDX at a standoff distance of 3.85 ft. The results show decreased reflectance at the edges of the measurement range as would be expected due to the RDX absorption features at 8.2 and 9.6 μm. Figure 13 shows the results for PETN, which are similar to RDX due to the lack of strong absorption features in the spectral range of the instrument. However, there is a decrease in reflected signal as would be expected due to the absorption feature at 9.6 μm. 7.Summary and ConclusionsThere is a clear need for standoff trace explosive detection systems in today’s world. Active optical techniques based on Raman methods, LIBS, PTS, and DRS provide alternative approaches to satisfy this need. Wide spatial coverage can be achieved through scanning a single-element detector across the FOR. RPSs provide an ideal solution for portable and mobile wide spatial coverage standoff trace explosive detection systems due to their inherent compact size, low-operating power, large field of view, and fast scanning speed. OPTRA, Inc. designed and built a prototype DRS standoff explosive detection system utilizing an EC-QCTL tunable MIR laser, RPS, a single-element ZnSe collection lens, and cooled MCT detector. The system was tested with DNT simulant material and TNT, RDX, and PETN explosive materials and compared with reference spectra. The future work will involve the development of a physical model for the explosive spectra, which will be used for the generation of detection algorithms. AcknowledgmentsThe authors thank J. Engel for expert technical assistance. The authors would like to thank US Army Joint Munitions and Lethality Center for their support of this work under a Phase II SBIR contract (W15QKN-11-C-0045). ReferencesF. Capasso,
“High-performance midinfrared quantum cascade lasers,”
Opt. Eng., 49
(11), 111102
(2010). http://dx.doi.org/10.1117/1.3505844 OPEGAR 0091-3286 Google Scholar
C. BauerU. WillerW. Schade,
“Use of quantum cascade lasers for the detection of explosives: progress and challenges,”
Opt. Eng., 49
(11), 111267
(2010). http://dx.doi.org/10.1117/1.3505831 OPEGAR 0091-3286 Google Scholar
D. S. Moore,
“Instrumentation for trace detection of high explosives,”
Rev. Sci. Instrum., 75
(8), 2499
–2508
(2004). http://dx.doi.org/10.1063/1.1771493 RSINAK 0034-6748 Google Scholar
L. A. SkvortsovE. M. Maksimov,
“Application of laser photothermal spectroscopy for standoff detection of trace explosive residues on surfaces,”
Quant. Electron., 40
(7), 565
–578
(2010). http://dx.doi.org/10.1070/QE2010v040n07ABEH014334 QUELEZ 1063-7818 Google Scholar
L. NagliM. Gaft,
“Raman scattering for explosives identification,”
Proc. SPIE, 6552 65520Z
(2007). http://dx.doi.org/10.1117/12.719319 PSISDG 0277-786X Google Scholar
C. G. Brownet al.,
“Remote femtosecond laser induced breakdown spectroscopy (LIBS) in a standoff detection regime,”
Proc. SPIE, 6219 62190B
(2006). http://dx.doi.org/10.1117/12.663821 PSISDG 0277-786X Google Scholar
F. C. De Lucia Jr.J. L. GottfriedA. Miziolek,
“Evaluation of femtosecond laser-induced breakdown spectroscopy for explosive residue detection,”
Opt. Express, 17
(2), 419
–425
(2009). http://dx.doi.org/10.1364/OE.17.000419 OPEXFF 1094-4087 Google Scholar
C. M. Wynnet al.,
“Detection of condensed-phase explosives via laser-induced vaporization, photodissociation, and resonant excitation,”
Appl. Opt., 47
(31), 5767
–5775
(2008). http://dx.doi.org/10.1364/AO.47.005767 APOPAI 0003-6935 Google Scholar
F. Fuchset al.,
“Imaging standoff detection of explosives using widely tunable midinfrared quantum cascade lasers,”
Opt. Eng., 49
(11111127),
(2010). http://dx.doi.org/10.1117/1.3506195 OPEGAR 0091-3286 Google Scholar
X. Chenet al.,
“Standoff photoacoustic detection of explosives using quantum cascade laser and an ultrasensitive microphone,”
Appl. Opt., 52
(12), 2626
–2632
(2013). http://dx.doi.org/10.1364/AO.52.002626 APOPAI 0003-6935 Google Scholar
R. Furstenberget al.,
“Stand-off detection of trace explosives via resonant infrared photothermal imaging,”
Appl. Phys. Lett., 93 224103
(2008). http://dx.doi.org/10.1063/1.3027461 APPLAB 0003-6951 Google Scholar
V. LavigneB. Ricard,
“Fast Risley prisms camera steering system: calibration and image distortions correction through the use of a three-dimensional refraction model,”
Opt. Eng., 46
(4), 043201
(2007). http://dx.doi.org/10.1117/1.2722754 OPEGAR 0091-3286 Google Scholar
Y. Luet al.,
“Theoretical and experimental determination of steering mechanism for Risley prism systems,”
Appl. Opt., 52
(7), 1389
–1398
(2013). http://dx.doi.org/10.1364/AO.52.001389 APOPAI 0003-6935 Google Scholar
G. F. Marshall,
“Risley prism scan patterns,”
Proc. SPIE, 3787 74
–86
(1999). http://dx.doi.org/10.1117/12.351658 PSISDG 0277-786X Google Scholar
R. A. Spragg,
“A rapid sample preparation technique for diffuse reflectance measurements,”
Appl. Spectros., 38
(4), 604
–605
(1984). http://dx.doi.org/10.1366/0003702844555142 APSPA4 0003-7028 Google Scholar
C. F. BaulsirT. J. Tague Jr.,
“Introduction to diffuse reflectance infrared Fourier transform spectroscopy,”
http://www.nicoletcz.cz/userfiles/file/Aplikace/Introduction%20DR%20SpectraTech.pdf Google Scholar
BiographyCraig R. Schwarze received his BS in Electrical engineering from The Ohio State University and his MSEE with electro-optics option from the University of Massachusetts, Lowell. In 2008, he completed the Program for Leadership Development at the Harvard Business School. He spent 5 years working at Raytheon Company. Since 1996, he has been at OPTRA, Inc. and leads research and development efforts on electro-optical systems spanning the UV to IR ranges. Elizabeth Schundler received her MS in electrical engineering from Tufts University in 2008 and her BA in physics and mathematical science from Colby College in 2004. She has been a systems engineer at OPTRA, Inc., since 2004, working on a variety of SBIR programs focusing on the detection of chemical, laser, or explosive threats through the use of infrared imaging and spectroscopic systems. Robert Vaillancourt received his MS in electrical engineering from University of Massachusetts, Lowell, and his BS in electrical engineering from Merrimack College, in 1988 and 1996, respectively. He is the senior software engineer and engineering manager at OPTRA, Inc. Prior to joining OPTRA in 2001, he worked for Raytheon Company as a program manager and lead software and project engineer on a number of EO sensor development programs. |
|||||||||||||||||||||||||||||||||||||||||||||||||||||||||||||||||||||||||||||||||||||||||||||||||||||||||||||||||||||||||||||||||||||||||||||||||||||||||||||||