|
|
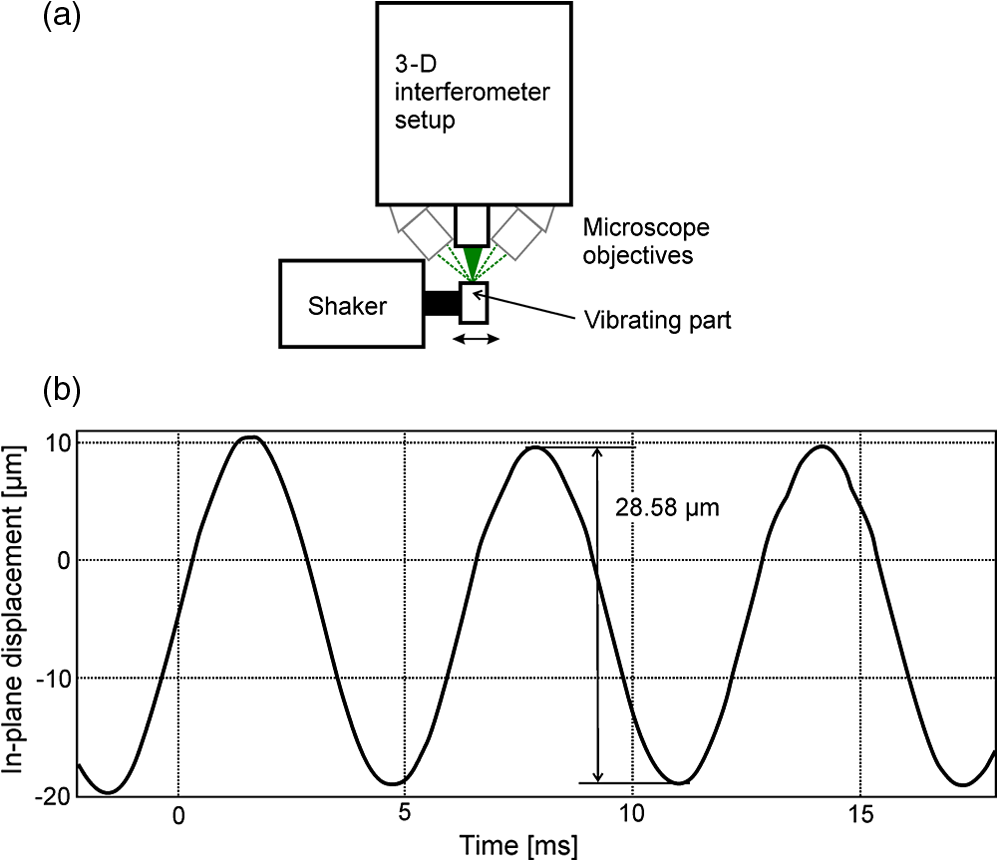
1.IntroductionLaser-Doppler vibrometry1,2 is widely applied to study out-of-plane-vibrations in microstructures,3,4 in which “out-of-plane” is defined as the direction parallel to the surface normal. A direction perpendicular to the surface normal is denoted as “in-plane.” The combination of heterodyne interferometric detection of the measurement light with the beam path of a confocal microscope enables the out-of-plane vibration analysis of microscopic specimens. Optical crosstalk5 of the classical three-dimensional (3-D) laser-Doppler vibrometer6,7 is an especially critical problem for microscopic specimens as microelectromechanical-systems (MEMS).8,9 Therefore, stroboscopic videomicroscopy10–12 or stroboscopic interferometric imaging techniques13–15 have been employed successfully to MEMS to study in-plane vibrations instead of applying 3-D vibrometry with three laser beams. Microscopic images are frozen by short (usually ) light pulses. Image processing reveals the displacements between a set of images. The drawbacks of stroboscopic imaging methods are a low-amplitude resolution (roughly 10 to 100 nm without averaging because acoustic noise is aliased as well as the strobed motion) and a rather time-consuming measurement procedure, which only works for periodic object motions. A real-time, broad-bandwidth vibration spectrum with picometer resolution, which is measured within milliseconds, cannot be obtained with stroboscopy. The application of in-plane laser-Doppler vibrometry1 to microscopic (biological) structures has been investigated by van Netten16 by focusing two parallel and collimated laser beams with a microscope objective on the specimen to generate a fringe pattern on the surface. The light scattered by the specimen in the fringe pattern is detected to obtain the in-plane vibration in one direction. The perpendicular in-plane-direction and the out-of-plane vibration detection would require additional beam arrangements17 and, consequently, additional lasers for a 3-D signal. Coherent amplification of the measurement light by reference light, necessary for shot-noise-limited detection, is also not possible for the approach of van Netten because the interference of the in-plane interferometer occurs already on the specimen. In addition, a fringe-pattern spot diameter below 10 μm and a simple arrangement with a single-laser source to acquire a real-time 3-D vibration signal are impossible with a combination of the classical in-plane-vibrometer with out-of-plane vibrometry. 3-D velocity fields in flows have been investigated with laser-Doppler anemometry18 by detecting the scattered light from a fringe pattern from different directions.19 But also solutions to study 3-D flow fields known from anemometry do not provide to our knowledge microscopic lateral resolution or coherent amplification of the detected scattered light with a high-reference-light power necessary to study vibrations in microstructures with a proper vibration-amplitude resolution. Hence, a new measurement technique which provides the performance of laser-Doppler vibrometry also for in-plane and 3-D vibrations has for many years been an important demand of the MEMS community and researchers endeavoring to study motions in microstructures. We have found a solution with a single-impinging laser beam by analyzing scattered light in different apertures simultaneously. 2.Physical Effects and Vibration Detection2.1.Principle of Laser-Doppler VibrometryCollecting light-scattered off-axis from different directions in respect to one single-impinging beam is the key idea of our optical sensing technique. The phase or phase deviation of the scattered light is measured with heterodyne interferometry to obtain the specimen vibration information. The Doppler effect can be elegantly formulated in a vector formula.20 Here, the Doppler frequency shift is expressed as the scalar product of the velocity vector of the scatter point and the difference of the wave vectors of the impinging beam and the wave vector in direction of the optical axis of the detection optics ().Note, an arbitrarily moving measurement spot results in a Doppler shift that is not a constant frequency shift but the time-dependent derivative of the measurement-light phase dependent on the specimen displacement . In a strict sense, Eq. (1) is an approximation for the Doppler frequency shift of the scattered radiation neglecting retardation. However, the formula is sufficient for most technical applications, where the (measurable) velocity of the scatter point is much lower than the velocity of light () and, in addition, we have measured the movement of an accurate stage to study the correctness of Eq. (1), experimentally5 on a rough surface under presence of laser Speckle effects. Equation (1) and the schematic in Fig. 1(a) show that the measured Doppler shift is proportional to the object velocity component in the direction of the bisector of the angle spanned by and . Fig. 1The vector diagram in (a) visualizes the vector Eq. (1), while the vector diagram in (b) shows wave vectors for direct reflection with the surface normal . 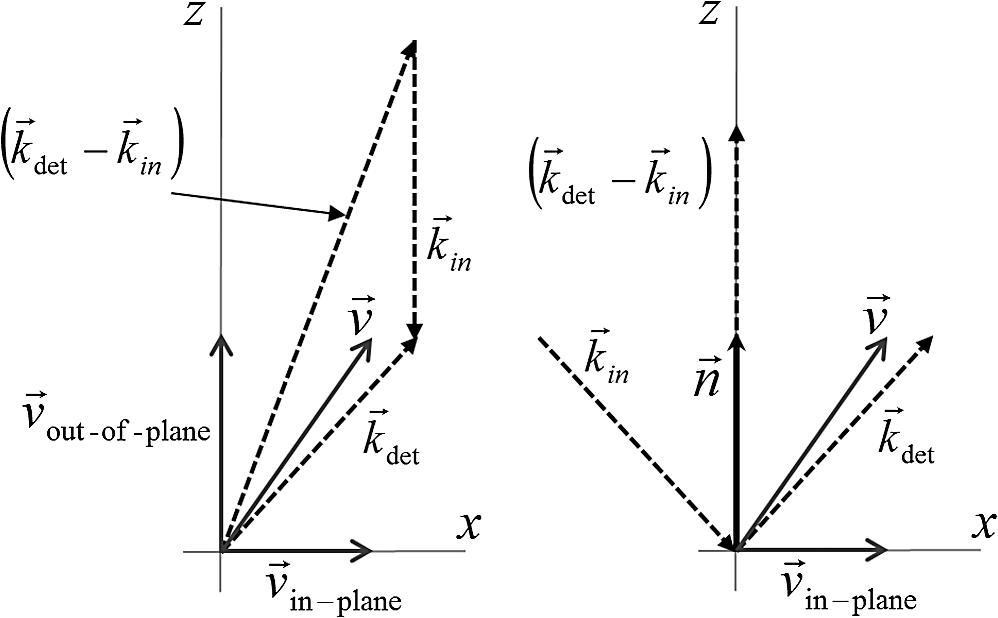 Coaxial wave vectors () describe the arrangement for a standard laser-Doppler vibration measurement and measure only the motion component parallel to the measurement beam. A coaxial arrangement which also impinges the surface collinearly with the surface normal collects a maximal light power and receives the maximal Doppler shift for out-of-plane motion if, for example, a Lambertian scatter behavior21 is assumed. As the Doppler frequency shift due to in-plane object motion and the spatial distribution of scattered light are antagonistic there exists also an angular arrangement for and , where the detection of an in-plane motion is optimal. A useful criterion is the in-plane, velocity-, or displacement-noise amplitude assuming shot-noise-limited detection and a certain scatter behavior, conscious that the chosen scatter model will greatly influence the result. 2.2.Scattered-Light ConditionsInserting the vector formula for direct reflection with the surface normal [see Fig. 1(b)] in Eq. (1), the detected Doppler frequency shift becomes . Obviously, no Doppler frequency shift due to in-plane motion can be detected (since ) while “out-of-plane” motion is well accessible (since ) with a velocity sensitivity of . Therefore, a perpendicularly impinging and detecting beam have been chosen (with a sensitivity ), and it follows that a Doppler frequency shift due to in-plane motion only exists in scattered radiation detected by the off-axis interferometer channels. 3.Optical 3-D Vibrometer Microscope3.1.Optical SystemOur realized setup consisting of three interlaced Mach–Zehnder interferometers is demonstrated in Fig. 2 for two interferometer channels. Fig. 2Demonstration of the optical setup. The center path and one of the two perpendicular detection paths are shown in the simplified schematic of our setup (a). The second off-axis-detection channel lies in the plane perpendicular to the plane shown in (a), and the 90-deg angle between the off-axis-detection channels can be seen in the photograph (b). BC is Bragg cell, BS is beam splitter, PBS is polarization beam splitter, QWP is quarter wave plate, A is aperture, PD is photo diode, O is a microscope objective, and M is a mirror. 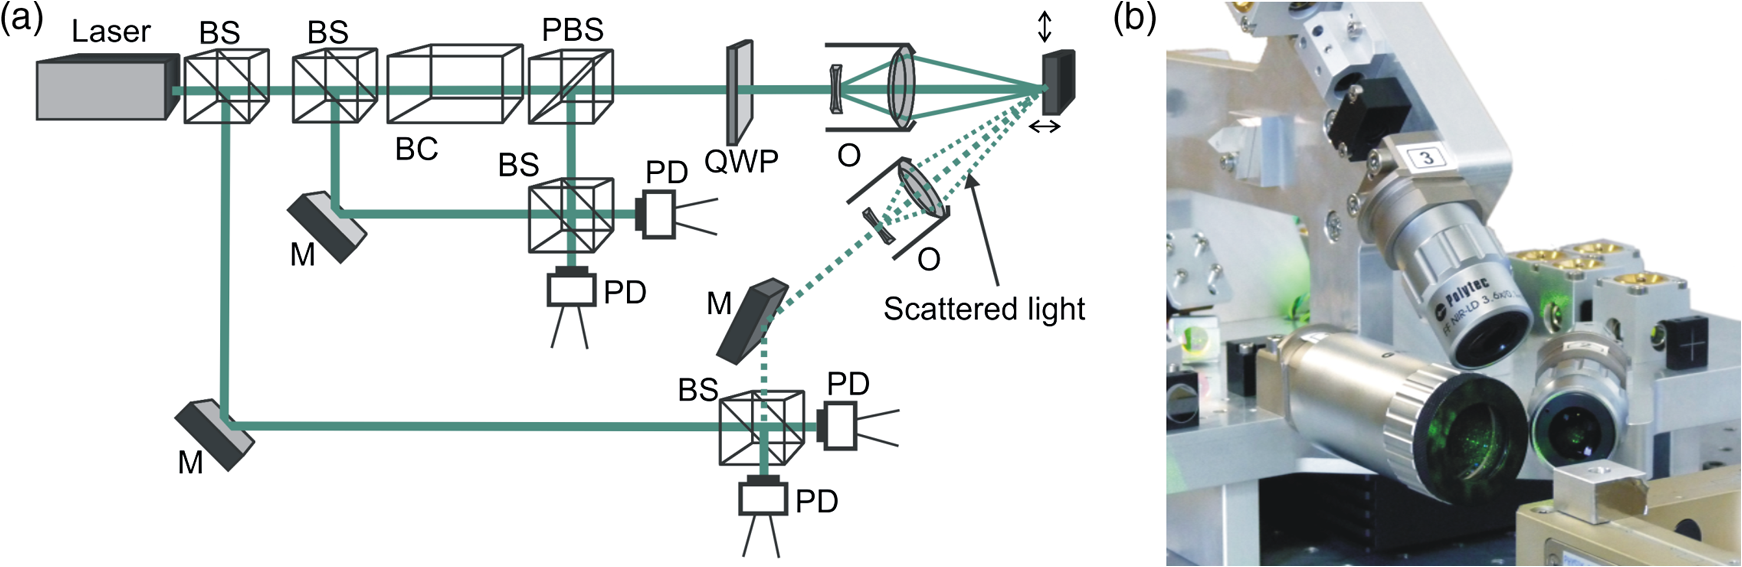 A laser-light power of 5 mW from a green 20-mW diode-pumped, solid-state laser is split to impinge the specimen while the remaining light is used as reference light for the three interferometer channels (Fig. 3). Fig. 3Optical arrangement. General beam arrangement of the interferometer channels with definitions for the detection angle and the vibration coordinate system but without the interferometric detection which is shown in Fig. 2. The wave vector of the incident beam and the wave vector of the center detection path are in direction of the -axis. Here, we define that the vectors and lie parallel to the plane while and lie parallel to the plane. 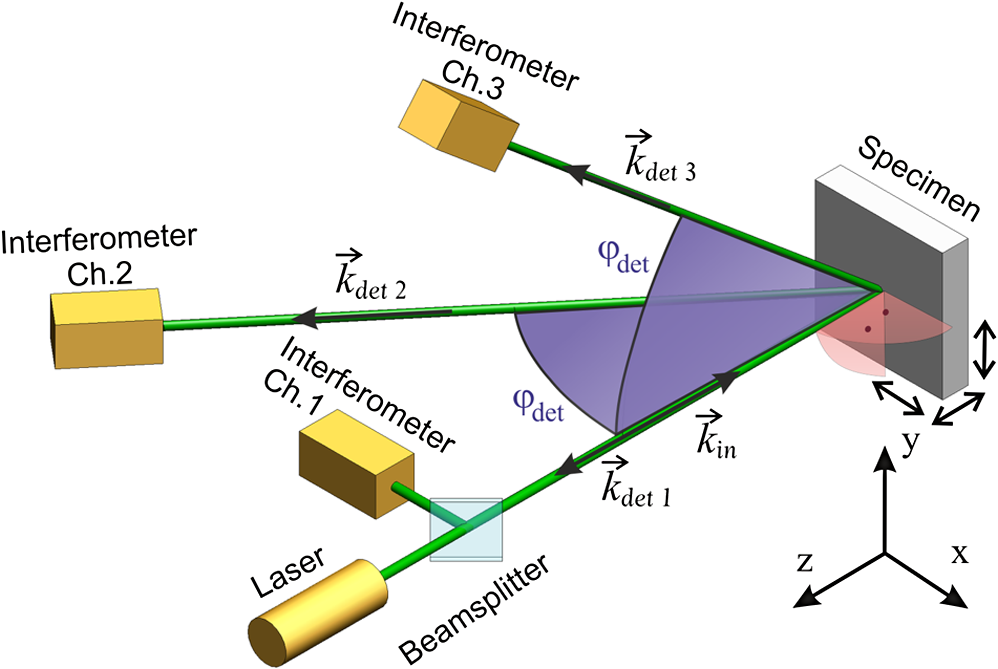 The impinging beam is frequency-shifted acousto-optically in respect to the reference beams with a Bragg-cell by 40 MHz to realize a shot-noise-limited heterodyne interferometric detection from three balanced photodetectors. The heterodyne detector signals are digitized and frequency demodulated with standard decoders from Polytec, Waldbronn, Germany. In particular, the electronics front-end from the existing PSV-500 system for macroscopic structures can reliably decode object motions with up to 2-MHz frequency and a maximum coaxially measured velocity of for the utilized laser wavelength of 532 nm. Recently a special controller has been realized at Polytec which has extended the frequency range up to 25 MHz and the maximal measurable velocity up to 10 m/s. An integrated camera allows the analysis and adjustment of the beam-path arrangement as well as the alignment of the measurement spot on the sample lighted with an integrated microscope illumination. Our solution measures one direction coaxially to the impinging beam (on-axis) with interferometer channel 1 to make best use of the available solid angle above the surface, which has to be segmented between the three detection channels and the impinging beam (see Fig. 2). We define the -axis parallel to the impinging laser beam because usually the optical axis of interferometer channel 1 detects the out-of-plane vibration and provides also the beam path for a digital-camera image necessary to align the measurement spot on the sample. The two off-axis interferometer channels collect the light under the angle in respect to the impinging beam. The projections of the two detection channels 2 and 3 on the plane are orthogonal to ensure equal sensitivity in both in-plane directions. The wave vector and the three wave vectors can be expressed in the coordinate system of Fig. 3 Using Eqs. (1) and (3) the relation between frequency shift for all three detection channels and object velocity at the measurement point is determined as Equation (3) demonstrates that interferometer channel 1 is only sensitive to displacements in -direction, channel 2 is sensitive to displacement in - and -directions, and channel 3 is sensitive to displacements in - and -directions. By computing the inverse matrix from Eq. (3), we obtain () to compute the instantaneous velocities from the Doppler shifts , , and in the directions , , and by the linear transformation Equation (3) has to be evaluated in the signal processing to derive the correct vibration information from the three Doppler shift frequencies. 3.2.Design Criteria of the OpticsThe selection of the angle and the numerical apertures (NAs) of the three channels have to ensure (1) a minimal measurement spot size, (2) sufficient range for the out-of-plane displacement measurement, and (3) sufficient resolution of the vibration signals. To realize high NAs with low aberrations and a large working distance (WD), we use special long-distance microscope objectives. Our proposed design has the advantage that the measurement spot size is only defined by the diameter of the Gaussian beam waist on the specimen which results from the collimated-beam diameter at the exit pupil and the focal length of the microscope objective of channel 1. For the off-axis interferometer channels 2 and 3, only collected scattered light which interferes efficiently with the Gaussian-shaped reference beams on the photo detectors can contribute to the heterodyne-signal strength. Thus, the beam propagation paths of the detecting interferometer channels are defined by the Gaussian reference beams at the detectors of channels 2 and 3 imaged virtually by the receiving optics on the specimen. The better the overlap between impinging and detection beam paths, the better the sensitivity of the off-axis channels. Regarding only lateral resolution, the waist diameters of the Gaussian beams of interferometer channels 2 and 3 at the measurement spot can be larger than the measurement spot size because as passive detectors they do not affect spatial resolution on the object. Larger waist diameters for channels 2 and 3 improve the alignment tolerance and measurement depth at the expense of some sensitivity, as the receiving NA is smaller and, thus, less scattered light is collected. 3.3.Optimization of the Optical ArrangementThe signal-to-noise ratio (SNR) of the detected displacement or velocity signal depends on the square root of the detected power of the measurement light.2 The detected measurement-light power is proportional to if an ideal Lambertian scatter characteristic is regarded. This is considered here as influence on the SNR by the scattering characteristic of the surface. The velocity sensitivity to the bisector direction () is reduced by a factor of compared with the coaxial detection. The in-plane-velocity sensitivity is, in addition, proportional to the factor and reduces the SNR by the selected geometry in respect to the coaxial case. Both effects (detected scattered light power and velocity sensitivity) result as sum in the total change of the displacement-signal SNR, which has an optimal detection angle () of for in-plane-vibration detection as it is shown in Fig. 4. For more specular scattering characteristics the global maximum of is shifted to smaller angles. Fig. 4Optimal detection angle. The penalty for the measured in-plane velocity or displacement signal-to-noise ratio (SNR) relative to the out-of-plane SNR depends on the object scatter characteristic and the measurement geometry-dependent sensitivity of the Doppler shift to in-plane motion. For a Lambertian scatter source, the optimum detection angle is . An angle has been selected as compromise because the optimum shifts to smaller angles for more specularly scattering objects. 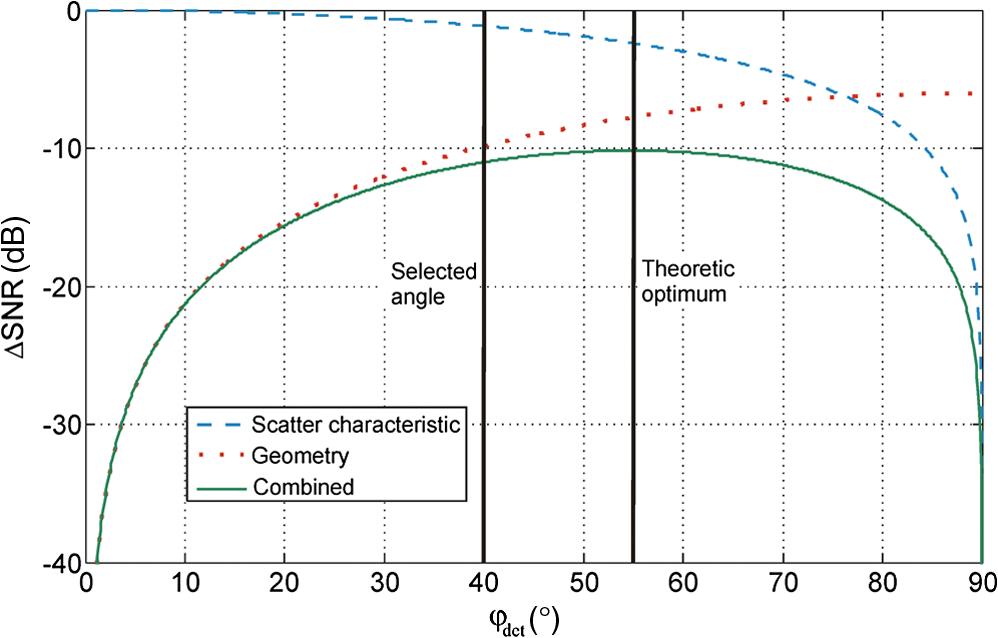 We have discovered experimentally on different surfaces of MEMS and hard-disk devices with different scatter behavior that the angle is a good compromise, choosing a combination of a objective (focal length is 20 mm) with a for interferometer channel 1 and objectives with a for the interferometer channels 2 and 3. The WD that we have achieved with this arrangement is 31 mm. Scanning functionality is implemented by means of a planar translation stage on which the specimen is placed and whose motion is controlled by the PSV software to automate data acquisition. Data from all three interferometer channels is decoded simultaneously and sent to a workstation. The 3-D object motion is computed in respect to Eq. (4). The measurement results are visualized and operational deflection shapes can be animated. 4.Performance Analysis4.1.Analyzing the Spot Diameter of the Impinging BeamAn important goal of the 3-D vibrometer microscope design is the generation of a microscopic measurement spot on the specimen. The photograph (Fig. 5) of the measurement spot captured with an integrated camera module with defined pixel size has been evaluated to estimate the focus diameter on the specimen. Fig. 5Photograph captured with an integrated digital camera. The pixel size has been calibrated with a reference scale and the measured spot diameter has a diameter of . 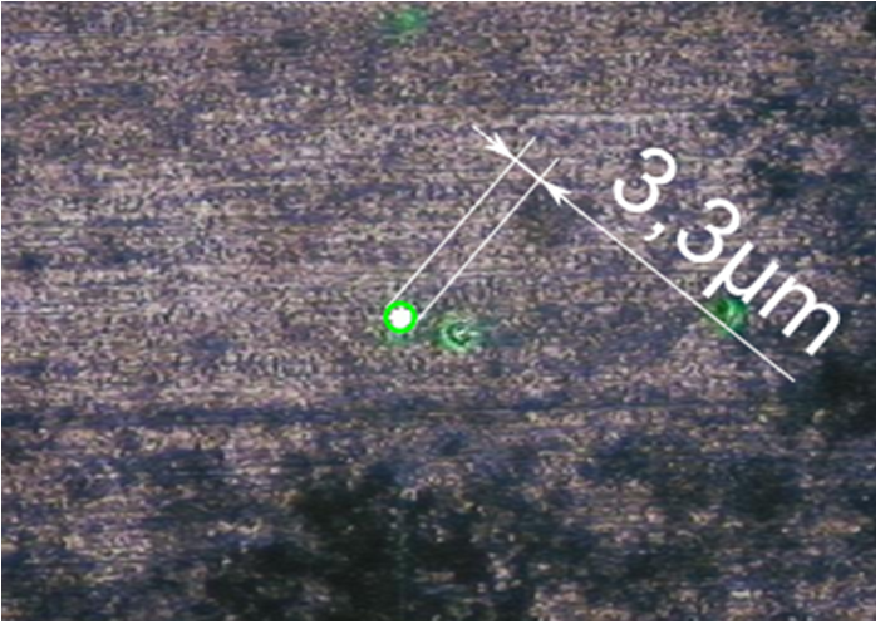 The spot has a diameter of , which is an improvement compared with the existing three-beam technology5 by approximately a factor of 10. The measurement spot can be positioned on an edge, corner, etch hole of a MEMS device with a reflective surface or any light scattering feature on the object. Practically, such edges, corners, etch holes are sufficient to enable a good measurement, but an integrated grating would optimize the vibration-amplitude resolution. Gratings with 1200 lines per mm are optimal because the first-order diffraction angle for 532-nm light does agree with the detection angle of 40 deg. 4.2.Resolution Limit and Accuracy of the Vibration AmplitudesThe most important motivation for this research was the lack of a fast technique that provides vibration-amplitude resolutions in the picometers range for in-plane vibrations as is possible with microscopic out-of-plane, laser-Doppler vibrometry. Usually, the ultimate resolution of a laser-Doppler vibrometer is measured on a mirror by collecting the reflected light completely. Obviously, measuring on the mirror does not reveal the ultimate resolution of the 3-D vibrometer microscope since scattered light is required. Therefore, we have used a grating with a 40-deg diffraction angle. The zeroth diffraction order can be measured with the out-of-plane measurement channel 1, whereas the first diffraction order is simultaneously collected with channel 2. For this arrangement, 58% of the light power is diffracted in the first order and 8% is diffracted in the zeroth order. The measured displacement-amplitude resolution (see Fig. 6) for an in-plane vibration spectrum is at 185 fm for a resolution bandwidth of 9.77 Hz in the range of white noise above 1 MHz if a decoder measurement range of (maximal velocity) is selected. The amplitude resolution corresponds to a resolution of , which is a tremendous improvement compared with the resolution of video stroboscopy. It should be mentioned that this resolution can only be achieved when an appropriate grating is integrated on the measurement surface. However, it is an unambiguous proof of subpicometer vibration-amplitude resolution for , , and directions. The resolution limit of the out-of-plane direction was measured on a mirror for the realized system at . Fig. 6The resolution measurement on a grating with an efficiency of 58% in the first order shows a vibration-amplitude noise level of 185 fm for a resolution bandwidth (RBW) of 9.77 Hz in the in-plane direction. 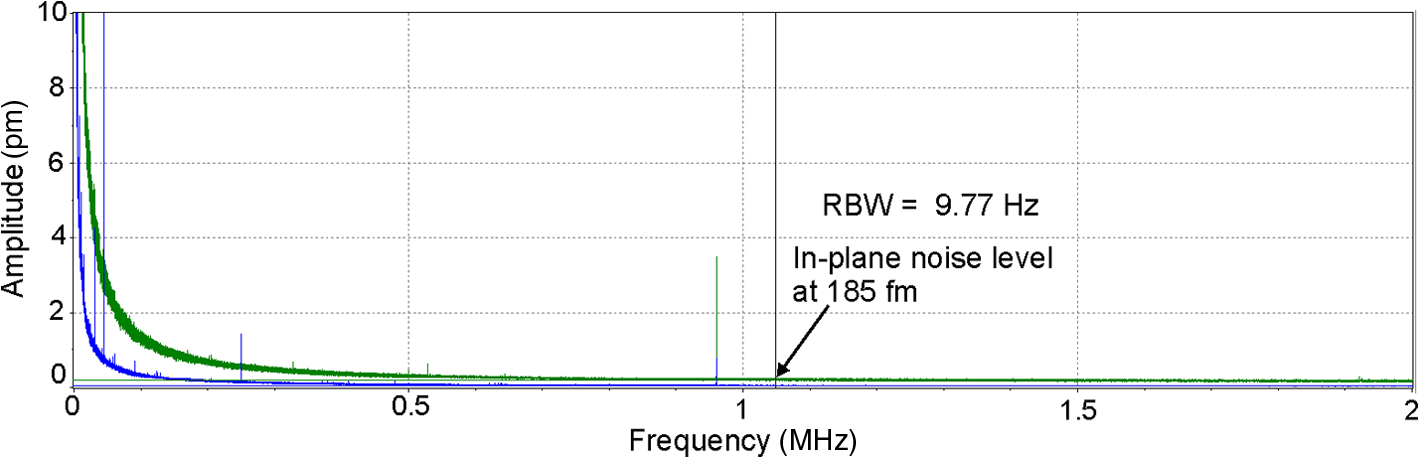 The accuracy of a laser-Doppler vibrometer is well determined, and the calibration is defined in the ISO 16063-41 standard.22 However, our new in-plane measurement technique is not addressed in the ISO standard. Therefore, we have performed an additional measurement by obtaining the motion of a traceable calibrated shaker (model VC10 from Metra Mess- und Frequenztechnik Radebeul, Germany) in the -direction (in-plane) of our sensor to prove the accuracy of the technique. The schematic of the setup is demonstrated in Fig. 7(a). The vibration peak-to-peak amplitude of the shaker is 28.28 μm with 3% vibration-amplitude uncertainty at 159 Hz. The measured motion of the shaker is shown in Fig. 7(b). Our system measures clearly the variation of the controlled amplitude over time within the uncertainty of the shaker and, therefore, our uncertainty estimation by measuring a vibration standard is limited by the uncertainty of the utilized shaker. 4.3.Measuring on MEMS StructuresScanning measurements have been performed on a cantilever MEMS structure which has been fixed on a motorized translation stage. The spectrum up to 1 MHz is presented in Fig. 8(a). For most resonance frequencies, the out-of-plane component (-axis) is predominant but at a frequency of 142 kHz there is a large in-plane (-axis) movement. This reveals the importance of measuring not only the out-of-plane component but also the in-plane components of the vibrations. Note the picometer resolution in -direction achieved at a MEMS cantilever with a rather specular surface. The 3-D deflection-mode shapes at several resonance frequencies can be seen in Fig. 8(b). Fig. 8Example measurement with the three-dimensional (3-D) vibrometer microscope. 3-D vibration spectra () of a silicon cantilever microelectromechanical-systems (MEMS) structure (a) at the marker position excited with a periodic-chirp signal2 from 1 kHz to 2 MHz with an amplitude of 1.5 V and deflection mode shape of a cantilever MEMS device (b) at 142, 294, and 734 kHz (top to bottom). Note the different scaling of the amplitudes for clarity and the picometer resolution in -direction. 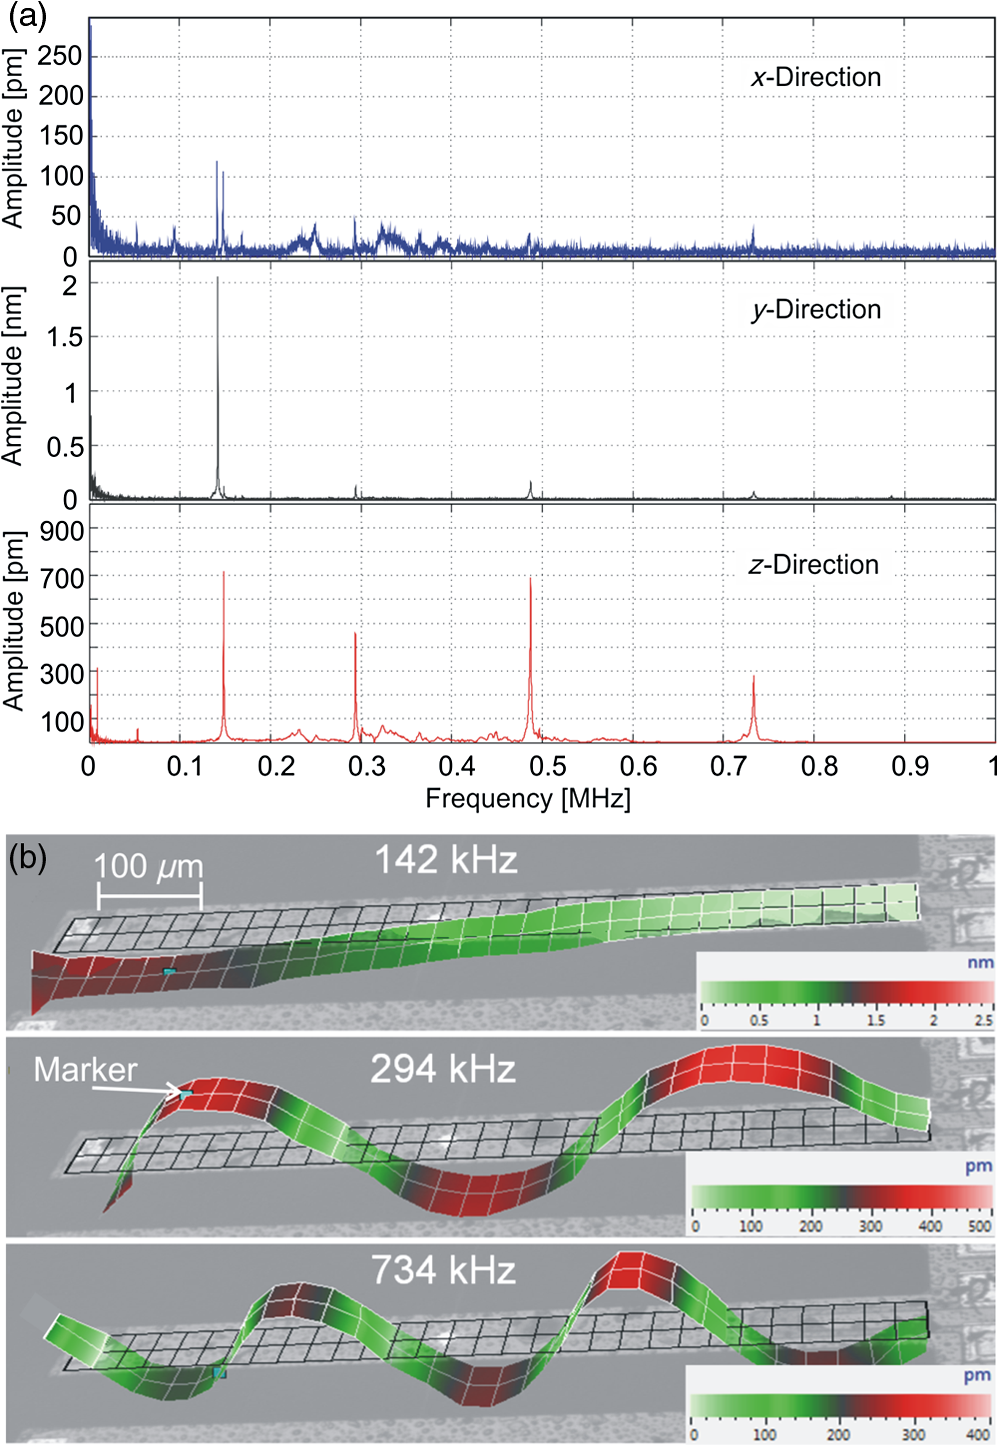 5.ConclusionsWe have realized a measurement system which can analyze vibrations in microscopic parts with a 3.5-μm measurement spot and with picometer vibration amplitude resolution in all three directions. The real-time signal makes possible the analysis of transient vibration phenomena. The scanning measurement on a MEMS cantilever demonstrates clearly that our patented method23 enables 3-D measurements to verify the modal behavior of microstructures. The square-root dependence2 of the vibration-amplitude noise from the detected light power leads to an increase of the amplitude noise by a factor of only 10 if a factor of 100 less light is detected and even a small-detected power in the microwatts regime of the scattered light can reveal tiny vibration amplitudes below 1 nm. Therefore, we can achieve picometer resolution for in-plane vibrations without averaging on specimens with relatively specular surfaces where only a little fraction of the light power is scattered in the off-axis detection aperture. In addition, our technique allows a well-defined measurement volume because of the pinhole character of the photo diodes and the defined overlap region of the detection beam paths with the impinging beam. Therefore, our 3-D vibrometer microscope certainly enables also interesting applications in biology and medicine (e.g., hearing research) on weakly scattering, vibrating specimens. However, the exploration of the usability of our system in other measurement applications is an open task for the future. AcknowledgmentsThe authors would like to acknowledge B. Pourat, G. Siegmund, V. Roth, L. Heller, A. Collet, M. Herberich, and M. Schüssler for the specific contributions of the realization of the final measurement system (the first prototype of the intended Polytec product MSA-100-3D) which has been used for the measurements of the MEMS-cantilever vibrations. ReferencesL. E. Drain, The Laser Doppler Technique, John Wiley & Sons, Chichester
(1980). Google Scholar
C. Rembeet al., Measuring MEMS in Motion by Laser Doppler Vibrometry, 245
–292 Taylor & Francis, Boca Raton
(2007). Google Scholar
C. RembeA. Dräbenstedt,
“The laser-scanning confocal vibrometer microscope: theory and experiments,”
Rev. Sci. Instrum., 77 083702
(2006). http://dx.doi.org/10.1063/1.2336103 RSINAK 0034-6748 Google Scholar
M. Gennatet al.,
“Determination of parameters with uncertainties for quality control in MEMS fabrication,”
J. Microelectromech. Syst., 22
(3), 613
–624
(2013). http://dx.doi.org/10.1109/JMEMS.2012.2236076 JMIYET 1057-7157 Google Scholar
R. Kowarschet al.,
“Real-time 3D vibration measurements in microstructures,”
Proc. SPIE, 8430 84300C
(2012). http://dx.doi.org/10.1117/12.922184 PSISDG 0277-786X Google Scholar
K. BendelM. FischerM. Schüssler,
“Vibrational analysis of power tools using a novel three-dimensional scanning vibrometer,”
Proc. SPIE, 5503 177
–184
(2004). http://dx.doi.org/10.1117/12.579525 PSISDG 0277-786X Google Scholar
M. SchüsslerM. MitrofanovaU. Retze,
“Measurement of 2D dynamic stress distributions with a 3D-Scanning laser Doppler vibrometer,”
Modal Anal. Topics, 3 141
–151
(2011). http://dx.doi.org/10.1007/978-1-4419-9299-4 2191-5644 Google Scholar
K. Peterson,
“Silicon as a mechanical material,”
Proc. IEEE, 70
(5), 420
–457
(1982). http://dx.doi.org/10.1109/PROC.1982.12331 IEEPAD 0018-9219 Google Scholar
J. M. BustilloR. T. HoweR. S. Muller,
“Surface micromachining for microelectromechanical systems,”
Proc. IEEE, 86
(8), 1552
–1574
(1998). http://dx.doi.org/10.1109/5.704260 IEEPAD 0018-9219 Google Scholar
C. RembeT. TibkenE. P. Hofer,
“Analysis of the dynamics in microactuators using high-speed cine photomicrography,”
J. Microelectromech. Syst., 10
(1), 137
–145
(2001). http://dx.doi.org/10.1109/84.911102 JMIYET 1057-7157 Google Scholar
C. Q. DavisD. M. Freeman,
“Using a light microscope to measure motions with nanometer accuracy,”
Opt. Eng., 37
(04), 1299
–1304
(1998). http://dx.doi.org/10.1117/1.601967 OPEGAR 0091-3286 Google Scholar
C. RembeR. S. Muller,
“Measurement system for full three-dimensional motion characterization of MEMS,”
J. Microelectromech. Syst., 11 479
(2002). http://dx.doi.org/10.1109/JMEMS.2002.803285 JMIYET 1057-7157 Google Scholar
E. Novaket al.,
“MEMS metrology using a strobed interferometric system,”
in Proc. 17th IMEKO World Congress,
178
–182
(2003). Google Scholar
S. PetitgrandA. Bosseboeff,
“Simultaneous mapping of out-of-plane and in-plane vibrations of MEMS with (sub) nanometer resolution,”
J. Micromech. Microeng., 14
(9), 97
–101
(2004). http://dx.doi.org/10.1088/0960-1317/14/9/017 JMMIEZ 0960-1317 Google Scholar
Y. EmeryN. AspertF. Marquet,
“Dynamical topography measurements of MEMS up to 25 MHz, through transparent window, and in liquid by digital holographic microscope (DHM),”
in AIP Conf. Proc.,
71
–77
(2012). Google Scholar
S. M. van Netten,
“Laser interferometer microscope for the measurement of nanometer vibrational displacements of a light-scattering microscopic object,”
J. Acoust. Soc. Am., 83 1667
–1674
(1988). http://dx.doi.org/10.1121/1.395922 JASMAN 0001-4966 Google Scholar
J. P. Monchalinet al.,
“Measurement of in-plane and out-of-plane ultrasonic displacements by optical heterodyne interferometry,”
J. Nondestr. Eval., 8
(2), 121
–133
(1989). http://dx.doi.org/10.1007/BF00565636 JNOED5 0195-9298 Google Scholar
Y. YehH. Z. Cummins,
“Localized fluid flow measurements with an He-Ne laser spectrometer,”
Appl. Phys. Lett., 4
(10), 176
–178
(1964). http://dx.doi.org/10.1063/1.1753925 APPLAB 0003-6951 Google Scholar
A. I. Mityushin,
“A superheterodyne three-component laser Doppler anemometer,”
Instrum. Exp. Technol., 46 115
–121
(2003). http://dx.doi.org/10.1023/A:1023694406012 INETAK 0020-4412 Google Scholar
M. Hugenschmidt, Lasermesstechnik—Diagnostik der Kurzzeitphysik, 131 Springer, Berlin
(2007). Google Scholar
F. E. Nicodemuset al.,
“Geometrical Considerations and Nomenclature for Reflectance,”
BRDF Physics-Based Vision, 94
–145 Jones and Bartlett Publishers, Sudbury, Massachusetts
(1992). Google Scholar
“Methods for the calibration of vibration and shock transducers—Part 41: Calibration of laser vibrometers,”
(2011). Google Scholar
A. Dräbenstedtet al.,
“Vorrichtung und Verfahren zur interferometrischen Vermessung eines Objekts,”
(2012). Google Scholar
BiographyChristian Rembe is manager of development optics at the Research and Development Department of the Polytec GmbH. He received his diploma degree in physics from the University of Hanover, Germany, in 1994 and his doctoral degree in engineering from the University of Ulm in 1999. His current research interests include optical sensors, optical metrology, and microelectromechanical systems. He is a member of SPIE, IEEE, the German VDI, and the German DPG. Robert Kowarsch studied optoelectronics and received his diploma in 2009 at the University of Applied Sciences of Aalen. Since 2009, he has worked as an engineer in the Optics Development Department of the Polytec GmbH. In 2012, he accepted additional responsibility as technology manager for laser-Doppler velocimeters. Wanja Ochs has studied electrical engineering at the Hochschule Karslruhe, Germany, and completed his master’s thesis in the R&D department of the Polytec GmbH in 2011. After his master’s thesis, he joined the Engineering Department of the Polytec GmbH. Alexander Dräbenstedt studied physics at the TU Chemnitz. After his diploma thesis about optical near field microscopy, he did his doctorate degree at the Department of Optical Spectroscopy and Molecular Physics. Since 2001, he has worked as an optics design engineer for Polytec GmbH. |