|
|
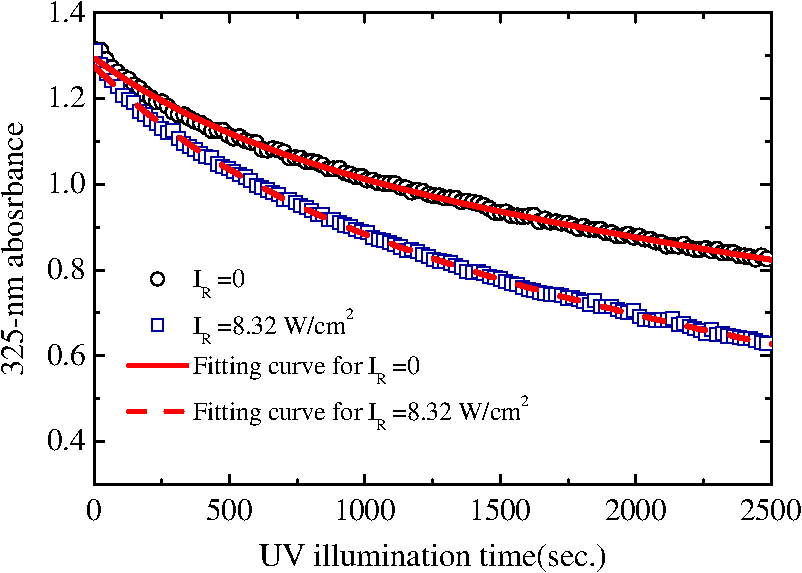
1.IntroductionPhotopolymers are promising write-once and read-many (WORM) holographic recording materials due to their advantageous properties of self-development, high sensitivity, and large modulation depth of the refractive index.1 A number of holographic materials have been developed since the first holographic photopolymer was reported in 1969.2 Currently, one can still observe intensive research activities that pursue material improvements and practical applications.3–6 Photopolymer’s self-developing property enables it for many unique applications in real-time holography, such as holographic data storage, holographic filters, holographic interferometry, and holographic optical elements.7–10 On the other hand, this characteristic leads to a reduction of diffraction efficiency as well as building up of scattering noise gratings, so that readout signal is degraded during hologram reconstruction. Thus, after the hologram is recorded, fixing process is necessary to turn off the remaining sensitivity and to prevent degradation of the hologram upon readout. A simple approach to achieve nondestructive reconstruction is heating the recorded hologram so that all the remaining photoactive elements in the material are used up. It can also be achieved by flooding it with uniform incoherent light after holographic recording.11,12 These postcuring techniques are effective for eliminating material’s remaining sensitivity. However, they also terminate material’s ability for succeeding recordings before its dynamic range is utilized. And this ability is very important for many applications, for example, in data storage, which often needs succeeding recordings to write more information at the same location at later time. The two-wavelength recording is one alternative to achieve nondestructive readout and maintain the remaining sensitivity at the same time. The idea is simple: the material is originally not sensitive to the writing light (usually at red or long wavelengths) so that holographic recording is not possible. When it is under simultaneous illumination of sensitizing (usually at UV or short wavelengths) and writing lights, the material is sensitive to writing light so that holographic recording can be performed. During hologram reconstruction, in the absence of sensitizing light, the material is again insensitive to the reading light so that nondestructive readout of the hologram is achieved. This scheme has been implemented with great success in doubly doped lithium niobate crystals for reversible holographic recording.13,14 Here, the similar idea is extended to photopolymer for WORM applications. Holographic recording based on two-wavelength photochemical (TWP) process in photopolymer was first demonstrated in carbazole dissolved poly(methyl methacrylate) (PMMA) thin film of thickness 200 μm.15 Hologram with 1% diffraction efficiency was achieved by using sensitizing light at 333.6 nm and writing at 488 nm. Later, the hologram with 11% diffraction efficiency was recorded in photopolymer thin film consisting of biacetyl-dissolved poly--cyanoacrylate host.16 A two-photon two-product processing has been proposed to record a hologram with 10% diffraction efficiency in a photopolymer consisting of methylene blue, diphenylisobenzofuranne, and a mixture of acrylamides.17 More recently, multilayer waveguide holographic memory card was reported in a photopolymer doped with two-color-photosensitive dye of bis(silyl)pentathiophene and radical photopolymerization initiator of 2,2-dimethoxy-2-phenylacetophenone.18,19 We recently reported 5% diffraction efficiency from a TWP hologram recorded in a phenanthrenequinone-doped poly(methyl methacrylate) (PQ/PMMA) photopolymer sample of thickness 2 mm by using a UV sensitizing light at 325 nm and red writing light at 647 nm.20 By adjusting the intensity ratio of sensitizing and writing beams, diffraction efficiency has been increased to .21 This progress strongly suggests that TWP holographic recording is promising for practical applications of volume holograms. However, to our knowledge, there is still no theoretical modeling for TWP holographic recording in such photopolymers. Most experimental parameters are adjusted by experience. In order to find suitable light parameters for achieving high diffraction efficiency, it is necessary to carry out a systematic analysis on TWP recording and to investigate its physical implications. In this paper, we present a theoretical modeling and experimental verification of the modeling for TWP holographic recording in PQ/PMMA photopolymer. Based on the principle of TWP holographic recording adapted from Ref. 15, the key issues and parameters for theoretic modeling are described in Sec. 2. In Sec. 3, PQ/PMMA fabrication, TWP holographic recording, and nondestructive readout are experimentally demonstrated. In Sec. 4, theoretical modeling of TWP holographic recording is introduced. Rate equations of population densities are listed and solved, and dynamics of TWP holograms is described. Computer simulations on TWP holograms are confirmed with optical experiments. The results reveal characteristics of TWP holograms and suggest methods for optimizing its performance. Conclusions are made in Sec. 5. 2.Principle of Two-Wavelength Photochemical Holographic RecordingInvestigations on the previous experimental results15–18,20,21 reveal that photosensitive molecules for the TWP holographic recording share a common characteristic: they are -diketone structure, which can be described by a four-energy-level absorption scheme with cascaded-excited metastable intermediate levels. An intermediate level of metastable state is essential for this scheme. This metastable level can be reached by absorption of only photons with higher energy and not photons of lower energy, resulting in accumulation of excited molecules in this level.22 There they facilitate significant absorption of photons with lower energy and, thus, enable holographic recording. Figure 1 depicts the schematic diagram for the above four-level system. It consists of two singlet states, and , plus two triplet states, and . Dye molecules are assumed to be originally in the stable ground state . Under two-wavelength illumination, the molecules will be pumped to their final state at , which is a chemically active or radical state. Excitation can be pumped by high-energy photons at sensitizing wavelength but not by photons with low energy at writing wavelength. The transition can be pumped by either UV or red photons. The process of TWP holographic recording begins with simultaneous illuminations of sensitizing light and writing light. Dye molecules are first pumped by the uniform sensitizing light to go from ground state to . Then, they will undergo a rapid decay (nanoseconds) into the triplet state via intersystem crossing (ISC). There these excited molecules can be pumped by the writing light to reach radical level via transition. Finally, the excited radicals at react with other components to form the final photochemical product, which bears index of refraction different from other parts of the photopolymer. Thus, a spatial modulation of refractive index or phase hologram that follows bright and dark interference fringes of writing light is created. During reading, without sensitizing illumination, the hologram can persist against uniform reading illumination at writing wavelength, and thus, nondestructive readout is achieved. Ideally, if the transition can be pumped by only writing light, then spatial distribution of radicals and resulting photoproduct will follow exactly that of the interference fringes of the object and reference beams; thus, high-efficiency holograms can be recorded. However, absorption band of molecules at state usually covers a broad spectrum. It often extends to sensitizing light such that part of the molecules will be pumped by the sensitizing light into higher level of states. This part should be minimized because it contains no optical information but uniform background, which will reduce spatial modulation of the index of refraction and lead to a decrease in amplitude of hologram. Yet, the sensitizing light is necessary because without it the material is insensitive to writing light and holographic recording is not possible. Hence, how to adjust intensity ratio of sensitizing to writing lights is a key factor that determines the performance of TWP holograms. It shall be found by solving rate equations in Sec. 4 that the optimum ratio is related to the material’s level properties, such as absorption cross-sections and quantum yields of sensitizing and writing lights. Before that, the fabrication of the photopolymer material in this study is described. The methods for determining the sensitizing and writing wavelengths are proposed and experimentally performed. 3.Experiments3.1.MaterialPQ/PMMA photopolymer is used in this study. The material was fabricated by a two-step thermo-polymerization method.23 Thickness of the sample is 2 mm with PQ doping concentration of 0.7 wt.%. In such PQ/PMMA, the main mechanism for holographic recording is the refractive index change induced by photochemical attachment between one PQ radical and one residual MMA under light illumination.24 The diffusions of PQ and MMA molecules in polymer matrix can be ignored. 3.2.Wavelength Selection for Sensitizing and Writing LightWavelengths of sensitizing and writing lights can be determined by absorption spectroscopy. Figure 2(a) shows a UV-VIS absorption spectrum of PQ/PMMA. In order to identify absorption characteristics of PQ molecules, the absorption spectroscopy of dilute solution PQ in MMA () is measured and showed in the same figure. The red curve contains two characteristic absorption peaks below the blue wavelength (). One peak is centered at , corresponding to transition, and the other is centered at , corresponding to transition. Either one of the two peaks can be used for the pumping of singlet transition, which will be followed up by ISC of to reach metastable level . It has been reported that PQ molecules that reach at level via transition have longer lifetime than those via transition.22,25,26 This will facilitate more efficient accumulations of PQ molecules. Thus, the wavelength of sensitizing light is chosen to be 325 nm from an He-Cd laser. Fig. 2(a) UV-VIS spectra of phenanthrenequinone-doped poly(methyl methacrylate) (PQ/PMMA) and dilute solution of PQ/MMA (). (b) UV-induced absorption spectroscopy of PQ/PMMA. 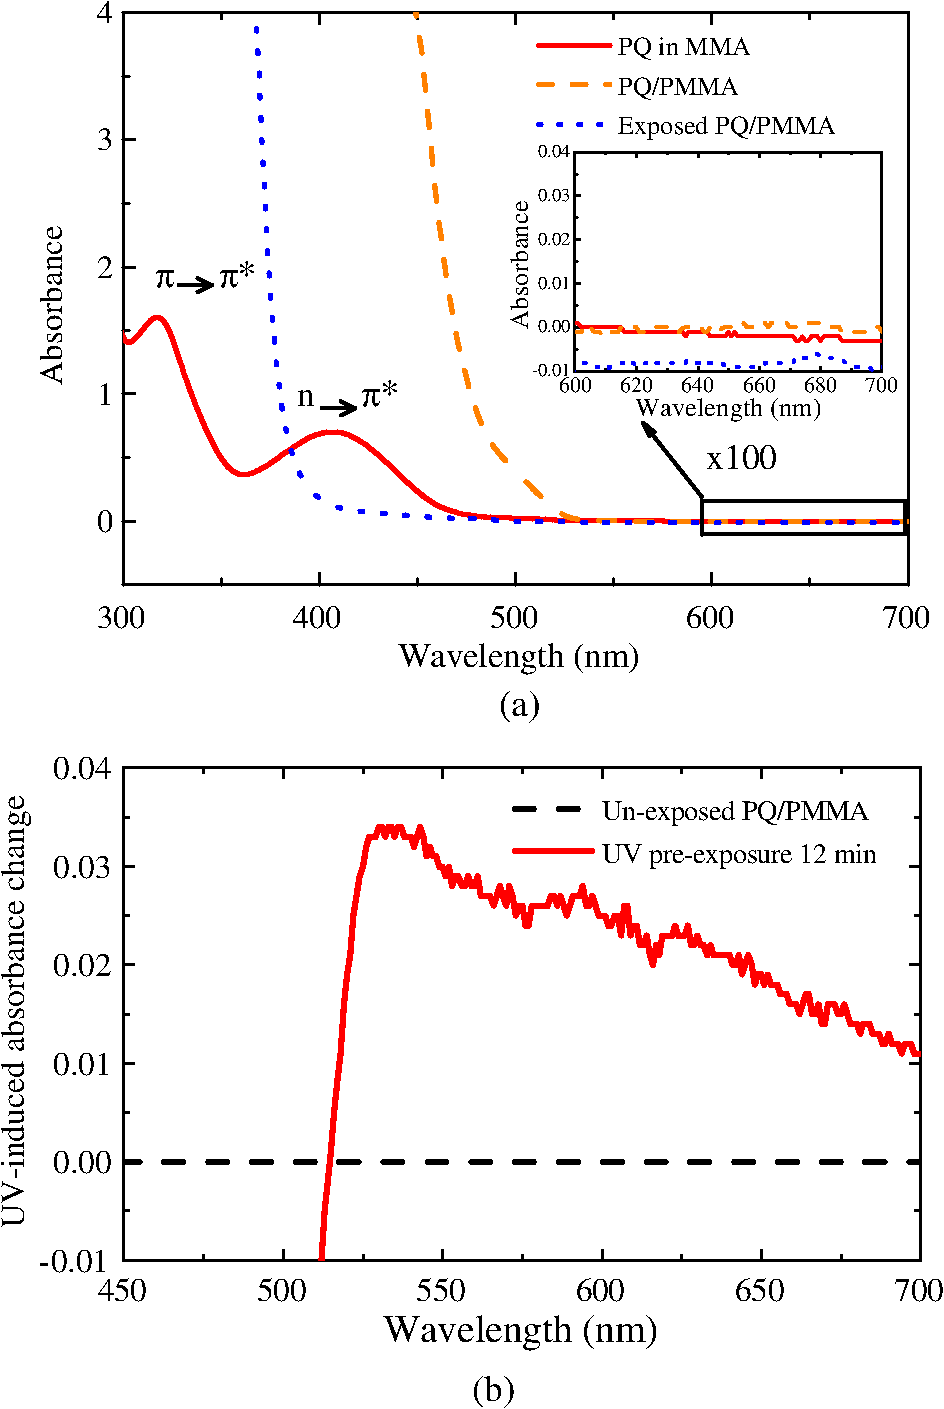 As shown in Fig. 2(a), the PQ/PMMA samples before exposure and after saturated exposure are almost transparent for wavelengths longer than 550 nm. For nondestructive readout, the material should not be sensitive to reading light without illumination of sensitizing light. Hence, wavelengths could be used for hologram reconstruction. However, in order to write holograms with TWP recording, the material should be sensitive to writing light under simultaneous illumination or preexposure of sensitizing light. Under these requirements, wavelength for writing light can be found by UV-induced absorption spectroscopy. Figure 2(b) shows spectroscopy curves of 325-nm induced absorption change of PQ/PMMA. The absorption change spectroscopy was performed when the sample was preilluminated for 12 min by a uniform 325-nm He-Cd laser at intensity of . It is found that there is a significant UV-induced absorbance change in the wide range from 550 to 700 nm. In addition, as illustrated by the blue curve in Fig. 2(a), the photoproduct PQ-MMA has almost no absorption at this range. Thus, the measured results indicate that the excited PQ molecules at level provide the absorption change so that this range of wavelength is suitable for writing light. For convenience, a red beam with wavelength of 647 nm from a Krypton laser is chosen for writing and readout. 3.3.TWP Holographic Recording and Nondestructive ReadingThe schematic diagrams for TWP holographic recording and nondestructive reading experiments are shown in Fig. 3(a). A uniform beam of intensity from a 325-nm He-Cd laser is used as the sensitizing light, and two s-polarized beams (each of ) splitting from a 647-nm Krypton laser are used as the writing lights. The writing lights are incident symmetrically on the sample with an intersection angle of 28 deg () in the air. By controlling the opening and closing of shutters S1, S2, and S3, TWP holographic recording and reading were performed in PQ/PMMA. Fig. 3Experimental results. (a) Optical setup. (b) Comparison of diffraction efficiency between with and without sensitizing light. 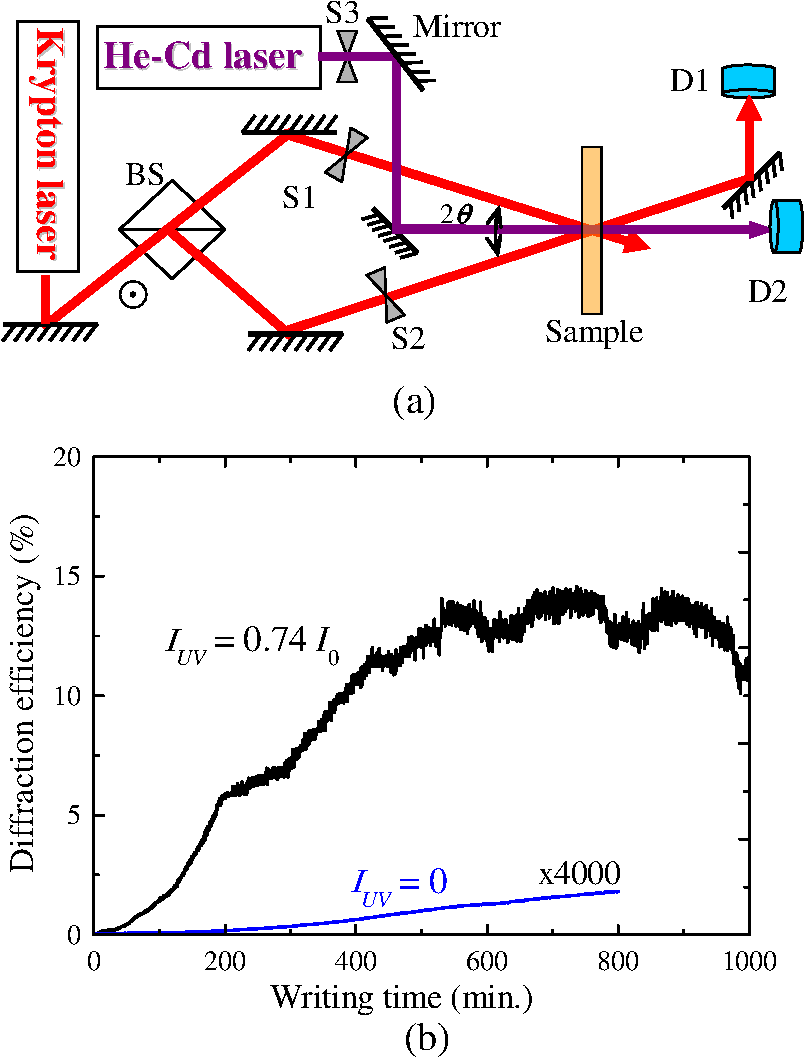 First, the holographic recording without sensitizing light (by closing shutter S3 and opening S1 and S2) is performed. During recording, one of the writing beams was blocked (by closing S2) from time to time and the diffracted intensity from the other beam was measured by detector D1. Temporal evolution of the diffraction efficiency is shown as the curve in Fig. 3(b), where diffraction efficiency is defined as the ratio between the diffracted and the incident intensities. It is seen that maximum diffraction efficiency is much below ; thus, holographic recording at only red wavelength is almost negligible compared with that with UV sensitization shown in the following. Then, TWP holographic recording with sensitizing light (by opening S3) is performed. The result is shown as the curve in Fig. 3(b), where represents the sum of total intensity of the writing beams. It is seen that, with simultaneous illumination of UV light, diffraction efficiency is , which is an improvement over four orders of magnitude than that without UV light. Thus, the significance of material sensitization induced by sensitizing light is fully demonstrated. After holographic recording, the Bragg selectivity curve of the hologram was measured by rotating the sample mounted on a rotational stage. Figure 4(a) shows a typical curve for a hologram with diffraction efficiency. It can be seen clearly that the selectivity curve of the hologram fits well with the Kogelnik’s formula27 without considering the absorption at 647 nm. This result indicates that a uniform 2-mm-thick hologram has been recorded by TWP method in our PQ/PMMA. In addition, in order to test the persistence property of the TWP hologram, a holographic reconstruction experiment is demonstrated. A TWP hologram with 5% diffraction efficiency was reconstructed with a red light (shutters S2 and S3 closed and S1 open) and the diffraction efficiency was measured by using detector D1. Figure 4(b) shows the result. It is seen that diffraction efficiency remains almost unchanged after 24 h of continuous reading, although the sample is not saturated. This clearly demonstrates the capability of nondestructive property of the TWP hologram. 4.Four-Energy-Level Model of TWP Holographic Recording4.1.Rate Equations and SolutionsReferring to the four-energy-level model for TWP holographic recording that was depicted in Fig. 1, rate equations for the population density of PQ molecules at each level can be written as where , , , , and are population densities (molecules·) of each level, respectively. is the concentration of residual monomer, MMA. and are photon flux () of UV sensitizing light and red writing light, with definition , where is the Planck constant, is the intensity, and is the frequency of light. and are molar absorption cross-sections () of UV and red lights, respectively. is the quantum yield (molecules per photon) of UV light for the transition . Similarly, and represent quantum yields of red and UV lights, respectively, for the transition . (, , 1, 2, 3, ) represents lifetime corresponding to the transition of upper level and lower level . and are the attachment rate constants between the free PQ radicals and MMA at level to form photoproducts. The rate equation of growth of photoproduct density can be written asThe photoproduct bears index of refraction different from other parts of the photopolymer so that the phase hologram can be recorded as the uniform sensitizing light and the spatially modulated writing light are given. Based on the photochemical mechanisms in PQ/PMMA, the following approximations are made. It is assumed that initially all PQ molecules are at the ground level , so at , and , where is the doping concentration of PQ molecules. During holographic writing process, the diffusion of PQ molecules is so small that they are distributed among the energy levels purely according to the local intensities of UV and red lights, so . Finally, if the writing time is long enough, all PQ molecules will be pumped to become radicals at levels and attach with MMA to form final photoproduct; thus at , . Further, since lifetime of PQ at each level is long () compared with that of the ISC time (approximately nanoseconds), hence, under sufficient pumping by the sensitizing and writing lights, all the level-relaxation terms in rate equations can be neglected except the term of for the ISC relaxation.28,29 For simplicity and without loss of generality, absorption cross-sections for both wavelengths are assumed as unity. This will not affect physical results because actually its effect is absorbed in the quantum yield of each level at that wavelength. Under these simplifications, population densities of PQ molecules at each level and photoproduct can be solved and written as represents temporal evolution of the concentration of photoproduct that governs the dynamics of TWP holographic recording. Before proceeding to investigation on dynamics of holographic recording, several observations can be made. First, above solutions show that, with , and for all time, no matter what the value of is, i.e., when there is no UV light, all PQ molecules will stay at ground level and the material is not sensitive to red light. This confirms the requirement that sensitizing light is necessary for enabling the TWP holographic recording. Further, is so quick that the terms involved with exponential term of in Eqs. (9) to (12) can be neglected compared with other terms of the solution. Under these simplifications, it can be seen that (thus, TWP holographic recording) is mainly conducted by the quantum yields of the material, i.e., , , and as well as photon flux of sensitizing and writing lights, and . In the next section, the methods for finding these material parameters of PQ/PMMA through light-induced absorption experiments are described. Then, dynamics of TWP holograms can be investigated by adjusting intensity ratio of sensitizing and writing lights. 4.2.Light-Induced Experiment for Determining Level ParametersAccording to the four-energy-level modeling, sensitizing light is absorbed by PQ molecules both at levels and , and writing light is absorbed only by PQ molecules at level . Molecules that absorb photons will be pumped to higher energy levels and , respectively. Following this consideration, light intensity absorption constant can be derived as In the above equation, represents light intensity absorption coefficient of UV light, and accounts for the material intrinsic absorption coefficient that does not contribute to population change, such as PMMA polymer matrix absorption. Defining absorbance as , where represents material thickness, and substituting and from Eqs. (7) and (9) into Eq. (13), the absorbance can be written as where coefficients and are related to quantum yields , , and , and photon flux and . Also, and are time constants of the light-induced absorbance, which can be written asThese time constants can be obtained by light-induced absorbance experiments; then, by curve fitting, the quantum yields can be found. The setup described in Fig. 3(a) was used for the absorbance measurements. Two measurements were performed. In the first one, there was no red light illumination (shutters S1 and S2 closed and S3 open). The PQ/PMMA was illuminated with UV of intensity , and the transmitted power was monitored every 4 s by UV detector D2 located behind the sample. Experimental result is shown by the curve of small black circles in Fig. 5. By curve fitting with solid line, it was found that and . By setting and in Eq. (15), quantum yields of UV light at levels and were obtained to be and , respectively. Then, UV absorbance was measured when the sample was simultaneously illuminated with UV and strong red lights (shutters S3 and S1 open and S2 closed). UV intensity was and red intensity was (). In this situation, red photons were competing with UV photons for molecules at level; thus, the UV absorbance would be reduced. Experimental result confirmed this prediction, as shown by the curve of small blue squares in Fig. 5. By curve fitting with dashed lines, it was found that and . By using values of and , the value of is obtained. These parameters will be used for the following investigations on TWP holographic recordings. 4.3.Dynamics of TWP HologramsDuring TWP holographic recording, intensity of the sensitizing light is uniform, and intensity of the writing light is a spatial variation of interference between object and reference waves, which is written as where is the sum of intensity of the object and reference beams; and are the period and the modulation depth of the interference pattern, respectively. After substituting light intensities and as well as level parameters and , and , which were found in Sec. 4.2, into Eq. (12), temporal evolution of the spatial distribution of photoproduct PQ-MMA, , can be calculated numerically. Since the main mechanism for holographic recording in the PQ/PMMA is the refractive index change induced by photochemical attachment between one PQ radical and one residual MMA, hence, the photo-induced refractive index change, or the phase hologram, , which is proportional to density of photoproduct, can be found as and, thus, can be written asAs an example, assuming and , the temporal evolution of the hologram profile, at , 400, 800, and 3000 min, respectively, are calculated and plotted in Fig. 6(a). It is seen that the hologram profile deviates from purely sinusoidal function. By using Fourier analysis, temporal evolution of the first harmonic term of the hologram amplitude, , can be written as Fig. 6The simulation results on TWP holographic recording. (a) Optical fringes and normalized grating profiles . (b) Diffraction efficiency (, , , , , , , , , , , ). 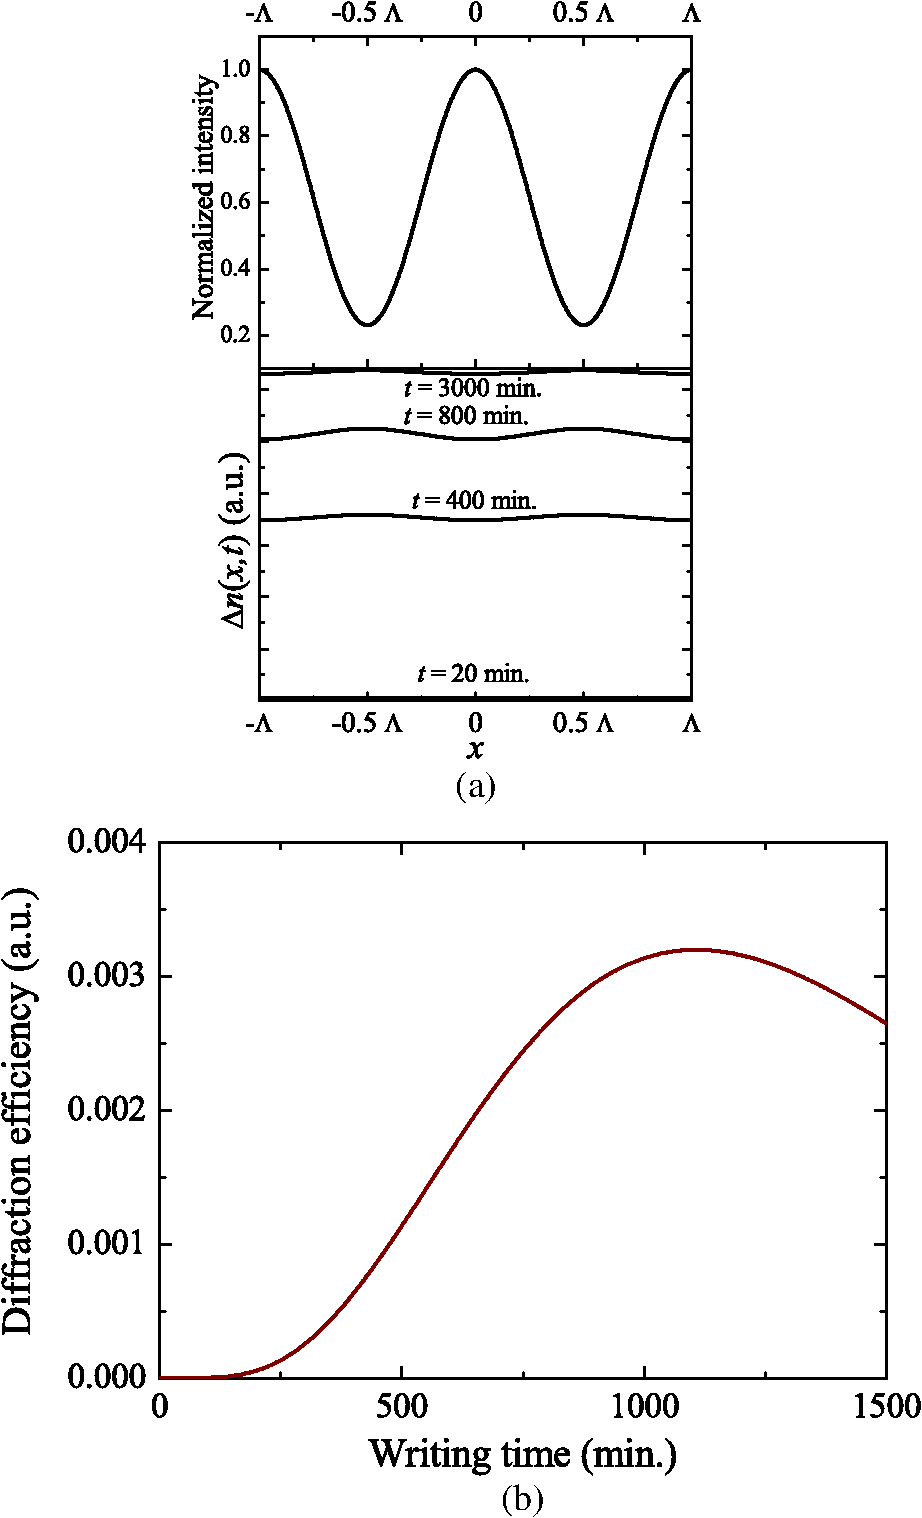 Then, as mentioned in experimental results, the temporal evolution of diffraction efficiency can be calculated by using Kogelnik’s formula:27 where is the thickness of the material, is the wavelength of the writing beam in material, and is the incident angle of the probing beam in material. With given light intensities, temporal evolution of the diffraction efficiency can be calculated, as plotted in Fig. 6(b). Note that only relative values of the hologram amplitude and diffraction efficiency can be obtained here because Eq. (17) is in proportional relationship.4.4.Investigations on the TWP Holographic RecordingFollowing the same procedures described in Sec. 4.3, the temporal evolutions of TWP holographic recordings are calculated by using the intensity ratio between UV and red beams at , where is fixed at . The result is shown as solid blue line in Fig. 7. In order to examine these calculations, TWP holographic recording experiments are carried out with the same beam conditions. The results are shown as black open circles in Fig. 7. It is seen that the general trends of the theoretical and experimental curves appear to match well. Thus, the experiments and calculations are repeated by using different intensity ratios. The maximum diffraction efficiencies corresponding to the given intensity ratio and the time to reach this point for all cases are summarized in Table 1. It is noted that simulation only gives relative values. By setting the maximum diffraction efficiency for the case to be equal to that of the experimental value (14.6%), the simulation results of diffraction efficiency for other cases are obtained. Fig. 7The experimental result (black circles) and numerical calculations (solid line) for temporal evolution of TWP holographic recording ().  Table 1Maximum diffraction efficiency and writing time to reach maximum under different intensity ratios.
As illustrated in Table 1, the smaller intensity ratio gives higher diffraction efficiency, and it takes longer time to reach the maximum. The following paragraph shows that the four-energy-level model can explain these characteristics. First, the characteristic that weaker sensitizing light takes longer time to reach diffraction maximum is understandable. Since the writing intensity is fixed, hence, smaller intensity ratio means weaker sensitizing beam intensity, which in turn implies slower pumping rate to excite PQ molecules from the ground state to the metastable level. Thus, it will need longer time to supply sufficient PQ molecules at level , which will result in longer time to write a hologram. The behavior of smaller intensity ratio of producing higher diffraction efficiency can also be understood by the four-energy-level modeling. For a fixed writing intensity , smaller intensity ratio means weaker background of UV intensity; thus, the contrast of optical interference can be higher in this case. Further, it in turn implies less UV photons to compete with red photons for PQ molecules at energy level . Thus, the population density of PQ radicals produced by red light, , can be enhanced compared with that produced by UV, . As a result, the spatial modulation of the holograms produced by these radicals can be higher in this case; therefore, it gives higher diffraction efficiency. The question is, can the diffraction efficiency keep growing when the intensity ratio keeps reducing to indefinitely small? In order to investigate this problem, we followed the same procedures to calculate the maximal diffraction efficiency as a function of . Further, in order to avoid the problem of oscillations in diffraction efficiency that is embedded in sine function of Eq. (19), the maximal value of hologram amplitude in Eq. (18), , is examined, which corresponds to the maximal value of the spatial modulation of the radical population density. Figure 8(a) shows the results for the cases , 25.2, and , respectively. Fig. 8Numerical calculations. (a) Maximum hologram amplitude as a function of intensity ratio. (b) Hologram recording time to reach maximum versus the intensity ratio (, , ). 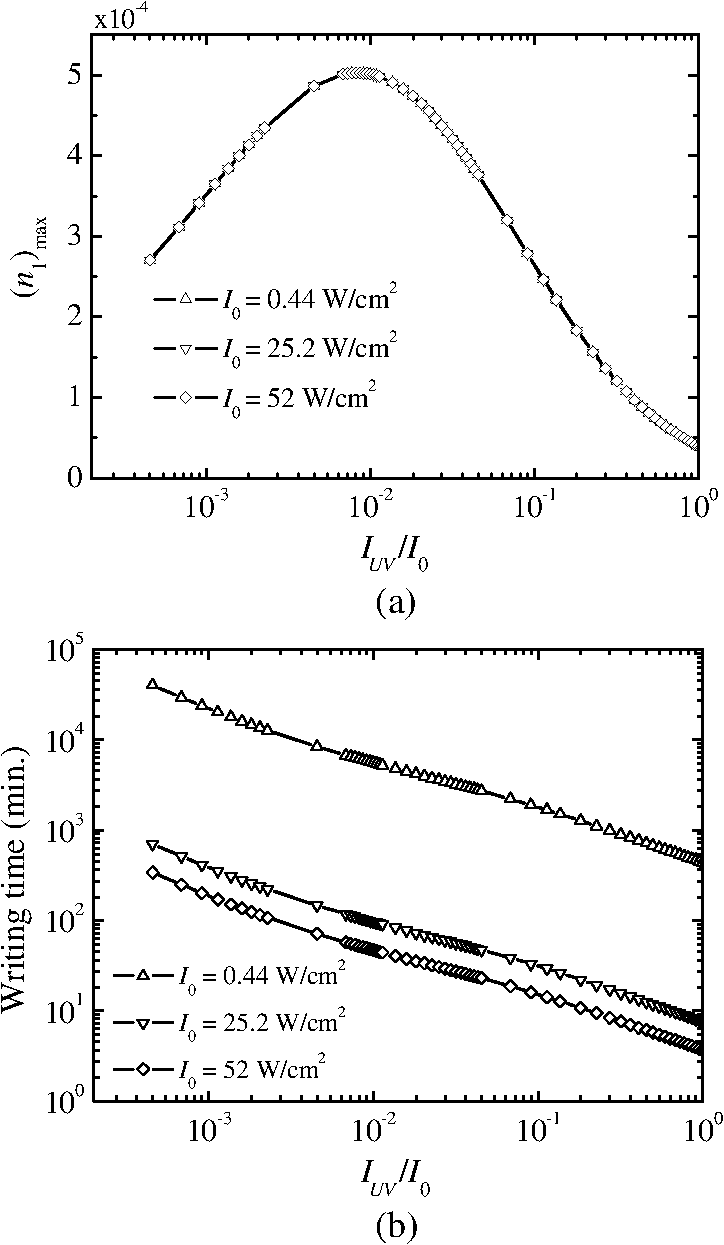 It is seen that the three curves almost overlap with each other, meaning that the hologram amplitude depends only on the intensity ratio and not the beam intensity. This result can be understood by recalling that amplitude of the hologram depends only on the difference of the photoproduct densities between the bright and dark regions. Therefore, a fixed intensity ratio will produce the same value of the spatial modulation of the refractive index, no matter how the beam intensities are changed. It is also seen in Fig. 8(a) that smaller intensity ratio produces larger hologram amplitude, as expected. However, when the ratio is reduced too much, such as in Fig. 8(a), the hologram amplitude starts to decrease. According to the four-level model, the hologram is written by the attachment of PQ radicals and MMA. The sum of population density , which are excited from PQ at level by UV and red photons, respectively, plays an important role in determining the concentration of the photoproduct . PQ molecules at level are in turn pumped from the ground level by UV photons. If the UV intensity is reduced too much such that the pumping speed from cannot support that for , then the spatial distribution of the photoproducts becomes different from that of the bright and dark fringes of the interference pattern. Then the refractive index distribution is distorted from the sinusoidal function and the coefficient of the fundamental grating is decreased. Therefore, the hologram amplitude is decreased if the intensity ratio is reduced too much. Hence, an optimal value exists for the intensity ratio . The optimal condition can be estimated when the two pumping speeds are equal to each other, i.e., , which gives the intensity ratio as Taking , , and , which were obtained from light-induced experiments, the intensity ratio is 0.0052. This number is very close to the calculated value () of theoretical curve in Fig. 8(a). Thus, Eq. (20) gives a useful guideline to choose the intensity ratio. Note that the beam intensity actually affects the hologram writing speed. Figure 8(b) plots the time to reach maximal hologram amplitude as a function of the intensity ratio for three cases of , 25.2, and , respectively. The figure shows that stronger beam intensity takes shorter writing time to reach the maximal hologram amplitude, which was observed in the experiments. It is also worthy to note that in Table 1, the time to reach maximum diffraction efficiency of the experimental results deviates a little bit from the numerical calculations. The difference in temporal evolution can be attributed to the simplifications in the modeling. For example, the diffusion effect of free PQ molecules has been neglected. In holographic recording, the writing time is in the order of 1000 min. The diffusion length of PQ molecules in PMMA matrix at room temperature can be calculated to be in the order of submicrometers,30–32 which is a fraction of typical fringe spacing of the interference fringe. Hence, the spatial modulation of the hologram will be affected. Thus, a more detailed investigation to account for the spatial diffusion of molecules is necessary for improving the accuracy of the modeling. 5.ConclusionsWe have presented a methodology for investigating TWP holographic recording in PQ/PMMA. Samples of thickness 2 mm have been fabricated. Absorption spectroscopy was used to determine the wavelengths for TWP holographic recording in this material. An He-Cd laser at 325 nm was chosen as the sensitizing light and a Krypton laser at 647 nm as the writing light. TWP holograms of 53% diffraction efficiency and nondestructive readout of this hologram have been demonstrated. The four-energy-level model for the system has been illustrated. Rate equations are listed and solutions for the amplitudes of the TWP holograms have been found. It is found that the key parameters that govern the characteristics of the TWP holograms are quantum yields (, , and ) of the material and photon flux ( and ) of the incident lights. The quantum yields of PQ/PMMA material are found by the UV-induced absorbance experiments. Then, using these material parameters, the TWP holographic recording has been theoretically calculated and compared with the experimental results for different intensity ratios of the gating and writing lights. It is demonstrated that the intensity ratio between sensitizing and writing lights determines the maximal achievable diffraction efficiency of the hologram and that the beam intensity determines the writing speed of holographic recording. Confirmation of the numerical calculations with experimental results demonstrates the validity of this model for TWP holographic recording in PQ/PMMA. This methodology for investigating the dynamics of TWP holographic recording can be extended to other photopolymers with similar photochemical schemes. AcknowledgmentsFinancial support by National Science Council, Taiwan, under contracts #NSC 101-2221-E-009-112-MY3 and #NSC 101-2221-E-009-111-MY3 are gratefully acknowledged. ReferencesR. A. LessardG. Manivannan,
“Holographic recording materials: an overview,”
Proc. SPIE, 2405 2
–23
(1995). http://dx.doi.org/10.1117/12.205350 PSISDG 0277-786X Google Scholar
D. Closeet al.,
“Hologram recording on photopolymer materials,”
Appl. Phys. Lett., 14 159
(1969). http://dx.doi.org/10.1063/1.1652756 APPLAB 0003-6951 Google Scholar
G. J. Steckmanet al.,
“Holographic data storage in phenanthrenequinone doped PMMA,”
Proc. SPIE, 3623 234
–242
(1999). http://dx.doi.org/10.1117/12.348403 PSISDG 0277-786X Google Scholar
J. LawrenceF. O’NeillJ. Sheridan,
“Photopolymer holographic recording material,”
Optik, 112
(10), 449
–463
(2001). http://dx.doi.org/10.1078/0030-4026-00091 OTIKAJ 0030-4026 Google Scholar
F.-K. Bruderet al.,
“Full-color self-processing holographic photopolymers with high sensitivity in red—the first class of instant holographic photopolymers,”
J. Photopolym. Sci. Technol., 22
(2), 257
–260
(2009). http://dx.doi.org/10.2494/photopolymer.22.257 JSTEEW 0914-9244 Google Scholar
M. S. Weiseret al.,
“Self-processing, diffusion-based photopolymers for holographic applications,”
Macromol. Symp., 296
(1), 133
–137
(2010). http://dx.doi.org/10.1002/masy.201051020 MSYMEC 1022-1360 Google Scholar
B. J. ChangC. D. Leonard,
“Dichromated gelatin for the fabrication of holographic optical elements,”
Appl. Opt., 18
(14), 2407
–2417
(1979). http://dx.doi.org/10.1364/AO.18.002407 APOPAI 0003-6935 Google Scholar
H. J. CoufalG. T. SincerboxD. Psaltis, Holographic Data Storage, Springer-Verlag, New York
(2000). Google Scholar
A. Popovet al.,
“Spectrally selective holographic optical elements based on a thick polymer medium with diffusional amplification,”
J. Opt. A Pure Appl. Opt., 2
(5), 494
–499
(2000). http://dx.doi.org/10.1088/1464-4258/2/5/324 JOAOF8 1464-4258 Google Scholar
A. SatoM. ScepanovicR. K. Kostuk,
“Holographic edge-illuminated polymer Bragg gratings for dense wavelength division optical filters at 1550 nm,”
Appl. Opt., 42
(5), 778
–784
(2003). http://dx.doi.org/10.1364/AO.42.000778 APOPAI 0003-6935 Google Scholar
J. A. Jenney,
“Holographic recording with photopolymers,”
J. Opt. Soc. Am., 60
(9), 1155
–1161
(1970). http://dx.doi.org/10.1364/JOSA.60.001155 JOSAAH 0030-3941 Google Scholar
S. Gallegoet al.,
“Stabilization of volume gratings recorded in polyvinyl alcohol-acrylamide photopolymers with diffraction efficiencies higher than 90%,”
J. Mod. Opt., 51
(4), 491
–503
(2004). http://dx.doi.org/10.1080/09500340408238063 JMOPEW 0950-0340 Google Scholar
K. BuseA. AdibiD. Psaltis,
“Non-volatile holographic storage in doubly doped lithium niobate crystals,”
Nature, 393
(6686), 665
–668
(1998). http://dx.doi.org/10.1038/31429 NATUAS 0028-0836 Google Scholar
A. AdibiK. BuseD. Psaltis,
“Two-center holographic recording,”
J. Opt. Soc. Am. B Opt. Phys., 18
(5), 584
–601
(2001). http://dx.doi.org/10.1364/JOSAB.18.000584 JOBPDE 0740-3224 Google Scholar
G. C. Bjorklundet al.,
“2-photon holography with continuous-wave lasers,”
Opt. Lett., 6
(4), 159
–161
(1981). http://dx.doi.org/10.1364/OL.6.000159 OPLEDP 0146-9592 Google Scholar
C. Brauchleet al.,
“2-photon holographic pecording with continuous-wave lasers in the 750–1100-nm range,”
Opt. Lett., 7
(4), 177
–179
(1982). http://dx.doi.org/10.1364/OL.7.000177 OPLEDP 0146-9592 Google Scholar
D. Lougnotet al.,
“A new gated system for two‐photon holographic recording in the near infrared,”
J. Appl. Phys., 63
(10), 4841
–4848
(1988). http://dx.doi.org/10.1063/1.340477 JAPIAU 0021-8979 Google Scholar
M. Shimizuet al.,
“A novel strategy for two‐photon holographic recording: stepwise two‐photon absorption of ‐quinquethiophene followed by energy transfer to an aryl azide,”
Adv. Mater., 19
(14), 1826
–1829
(2007). http://dx.doi.org/10.1002/(ISSN)1521-4095 ADVMEW 0935-9648 Google Scholar
K. Hirabayashiet al.,
“Multilayer holographic recording using a two-color-absorption photopolymer,”
Appl. Opt., 46
(35), 8402
–8410
(2007). http://dx.doi.org/10.1364/AO.46.008402 APOPAI 0003-6935 Google Scholar
P. L. Chenet al.,
“Two-wavelength holographic recording in thick phenanthrenequinone-doped poly(methyl methacrylate) photopolymer,”
Opt. Eng., 51
(3), 030503
(2012). http://dx.doi.org/10.1117/1.OE.51.3.030503 OPEGAR 0091-3286 Google Scholar
K. Y. HsuJ. H. LinS. H. Lin,
“Two-wavelength volume holographic recording in thick PQ-doped PMMA photopolymer,”
Proc. SPIE, 8776 877602
(2013). http://dx.doi.org/10.1117/12.2017315 PSISDG 0277-786X Google Scholar
A. P. DarmanyanC. S. FooteP. Jardon,
“Interaction of singlet oxygen with peroxy and acylperoxy radicals,”
J. Phys. Chem., 99
(31), 11854
–11859
(1995). http://dx.doi.org/10.1021/j100031a011 JPCHAX 0022-3654 Google Scholar
S. H. Linet al.,
“Doped poly(methyl methacrylate) photopolymers for holographic data storage,”
J. Nonlinear Opt. Phys. Mater., 15
(2), 239
–252
(2006). http://dx.doi.org/10.1142/S0218863506003244 JNOMFV 0218-8635 Google Scholar
Y. N. HsiaoW. T. WhangS. H. Lin,
“Analyses on physical mechanism of holographic recording in phenanthrenequinone-doped poly(methyl methacrylate) hybrid materials,”
Opt. Eng., 43
(9), 1993
–2002
(2004). http://dx.doi.org/10.1117/1.1774196 OPEGAR 0091-3286 Google Scholar
D. M. TogashiD. E. Nicodem,
“Photophysical studies of 9,10-phenanthrenequinones,”
Spectrochim. Acta A, 60
(13), 3205
–3212
(2004). http://dx.doi.org/10.1016/j.saa.2004.03.003 SAMCAS 1386-1425 Google Scholar
Y. Haradaet al.,
“Photochemical reaction dynamics of 9, 10-phenanthrenequinone and 1, 2-naphthoquinone with hydrogen donors in solution,”
J. Photochem. Photobiol. A, 170
(2), 161
–167
(2005). http://dx.doi.org/10.1016/j.jphotochem.2004.08.008 JPPCEJ 1010-6030 Google Scholar
H. Kogelnik,
“Coupled wave theory for thick hologram gratings,”
Bell Syst. Tech. J., 48
(9), 2909
–2947
(1969). http://dx.doi.org/10.1002/bltj.1969.48.issue-9 BSTJAN 0005-8580 Google Scholar
H. Shimoishiet al.,
“Influence of solvent polarity on the excited triplet states of nonphosphorescent 1, 2-naphthoquinone and phosphorescent 9, 10-phenanthrenequinone: time-resolved triplet ESR and CIDEP studies,”
J. Phys. Chem., 93
(14), 5410
–5414
(1989). http://dx.doi.org/10.1021/j100351a020 JPCHAX 0022-3654 Google Scholar
F. Wilkinson,
“Electronic energy transfer between organic molecules in solution,”
Advances in Photochemistry, 253
–256 John Wiley & Sons Inc., New Jersey
(2007). Google Scholar
V. L. Colvinet al.,
“Quantitative model of volume hologram formation in photopolymers,”
J. Appl. Phys., 81
(9), 5913
–5923
(1997). http://dx.doi.org/10.1063/1.364378 JAPIAU 0021-8979 Google Scholar
J. Mumbruet al.,
“Comparison of the recording dynamics of phenanthrenequinone-doped poly(methyl methacrplate) materials,”
Opt. Commun., 194
(1–3), 103
–108
(2001). http://dx.doi.org/10.1016/S0030-4018(01)01292-5 OPCOB8 0030-4018 Google Scholar
S. Liuet al.,
“Modeling the photochemical kinetics induced by holographic exposures in PQ/PMMA photopolymer material,”
J. Opt. Soc. Am. B Opt. Phys., 28
(11), 2833
–2843
(2011). http://dx.doi.org/10.1364/JOSAB.28.002833 JOBPDE 0740-3224 Google Scholar
BiographyChun-Hua Lin received his BS in electrophysics in 2001 from the National Chiao Tung University, an MS in electro-optical engineering in 2003, and a PhD in electro-optical engineering in 2013 from National Chiao Tung University in Taiwan, China. He is currently a postdoctoral fellow researcher at the Department of Photonics, National Chiao Tung University, Taiwan. His research interests are in photopolymer, holographic storage, and liquid crystal optics. Sheng-Lung Cho received his BS in control engineering in 1986 from National Chiao Tung University in Taiwan and his MS in industry engineering in 1992 from Tsing Hua University in Taiwan. He is currently a PhD student in electrical engineering at Yuan Ze University in Taiwan. His research interests are in optical fiber communication and holographic optical elements. Shiuan-Huei Lin received his BS in electrophysics in 1990, and his MS and PhD in electro-optical engineering in 1992 and 1996, respectively, all from National Chiao Tung University in Taiwan. He is currently a professor in the Department of Electrophysics at the National Chiao Tung University. His research interests are in holographic storage, optical computing, optical devices, holographic materials, and holography for optical information processing. Sien Chi received his BSEE degree from National Taiwan University, Taipei, Taiwan, and his MSEE degree from National Chiao-Tung University, Taiwan, in 1959 and 1961, respectively. He received his PhD degree in electrophysics from Polytechnic Institute, Brooklyn, New York, in 1971. From 1971 to 2004, he was a professor at National Chiao-Tung University. He is currently a chair professor at Yuan-Ze University, Taiwan. He is a fellow of the Optical Society of America. His research interests are optical-fiber communications, fast and slow light, passive optical networks, and microwave photonics. Ken-Yuh Hsu received his BS in electrophysics in 1973 and his MS in electronic engineering in 1975, both from National Chiao Tung University in Taiwan. He received his PhD in electrical engineering from the California Institute of Technology in 1989. He is currently a professor at the Department of Photonics & Institute of Electro-Optical Engineering at the National Chiao Tung University. His research interests are in the area of optical computing, optical neural networks, and holography for information storage and processing. |
|||||||||||||||||||||||||