|
|
1.IntroductionRecently, light emitting diodes (LED) have been utilized in a wide range of applications in visual signaling, information display, and the automotive industry because of their high brightness levels, long life span, and low power consumption.1 For these reasons and due to concerns regarding environmental issues,2,3 LEDs are predicted to replace existing lighting sources, such as incandescent and fluorescent lamps, in next-generation illumination.4–6 LEDs can also be modulated at high speed, offering the possibility of using sources for simultaneous illumination and high-data rate communication.7–9 These systems are usually referred to as visible light communication (VLC) systems, which have many attractive features such as unlimited, unregulated bandwidth (BW), immunity to interference caused by other electronic equipment, and the possibility of frequency reuse in adjacent rooms.10–13 In fact, a VLC system can be considered as a candidate for the wireless indoor links because it uses an illumination device that is easy to install.14 To apply the VLC system for both illumination and communication, a study on the physical model of the lighting layout, which affects the system efficiency, was recently conducted. The first model of ceiling lighting layout for indoor communication was proposed previously by Fan et al.,5 which addressed the effect of reflection. Then, in Ref. 15, the numerical studies of the influence of intersymbol interference (ISI) on the visible-light communication system are carried out. According to these studies, interference affects the performance of the communication system. The same layout was proposed by Lubin et al.,16 focusing on the data rate transmission using equalizer. With this technique, they could double the transmission rate up to . However, neither paper discussed the influence of lighting layout on the performance of the system. Recently, the study of the effectiveness of the ceiling lighting and corner lighting layouts for visible light applications has been presented by Ding et al.17 Although the ceiling lighting layout gives the best performance of the VLC system, improvements have not yet been made to the corner lighting layout. Another investigation on a physical model was conducted by Miya and Kajikawa,18 in which they developed a simulation interface for the user depending on their own proposed base-station layout. By using the user-interface system, an appropriate base-station layout that satisfies all conditions was demonstrated by considering the requirements of both lighting and communication. This article investigates the performance of the VLC system using the proposed models of modern lighting layouts to make it applicable in reality. This article is organized as follows. In Sec. 2, three models of modern lighting layouts are provided—the hybrid corner lighting layout (HCLL), the hybrid wall lighting layout (HWLL), and the hybrid edge lighting layout (HELL)—to implement the VLC system including an overview of the LED bulbs’ position in order to achieve the target lighting levels. Section 3 presents the communication channel of the VLC system including the drawback of ISI on the system. In Sec. 4, the system performance based on SNR value is investigated analytically. Finally, results of our investigation are summarized in Sec. 5 and major conclusions are drawn in Sec. 6. 2.Models of the Lighting LayoutsTo design the models of the lighting layouts, we must determine the visual task that will be performed within the task area, because different rooms require different lighting solutions. In this study, the models of the lighting layouts are implemented for an office space with the dimensions of (). According to Malaysian Standard (MS 1525:2001),19 the minimal recommended brightness of an office area must be uniformly distributed at an average brightness value of 300 lux. Given the required brightness of the model area, the number of lights that is needed to illuminate the office area can be calculated as follows: where is the total lumen output value of the LED lights, is the average illumination level of the working plane, and is the area of the working plane. By considering the ideal case, the utilization and maintenance factors are neglected in this calculation.According to the calculation in Eq. (1), the required lumen output to obtain a brightness of 300 lux is 7500 lumen. The number of lights depends on the total luminous flux divided by the value of the luminous flux emitted by a single LED bulb. Six LED bulbs are required, and each emits 1200 lumens with an operating power of 12 W. The 12-W operating power of the LED bulb is equivalent to an operating power of 85 W for an incandescent light. All lighting layout models are designed using six LED bulbs to implement the VLC system. 2.1.Lighting Layout ModelsFigure 1 shows the model of the working area using six LED bulbs, and Table 1 shows the location of the LED bulbs based on the model types. Referring to Fig. 1, the working plane is taken to be 0.8-m high because the recommended average desk height in Malaysia is approximately 0.8 m from the floor finish level.20 Thus, the height is considered to be fixed at 2.2 m by assuming that the receiver is placed at the working plane level, as shown in Fig. 1. There are three types of lighting layout models proposed in this article: the HCLL, HWLL, and HELL. The differences between them are the positions and the coordinates of the light fixtures, as shown in Table 1. The design parameters have been fixed according to the illumination standard; therefore, all the models are designed to use six LED bulbs at different positions, as shown in Table 1. Table 1The coordinate of the LED bulbs.
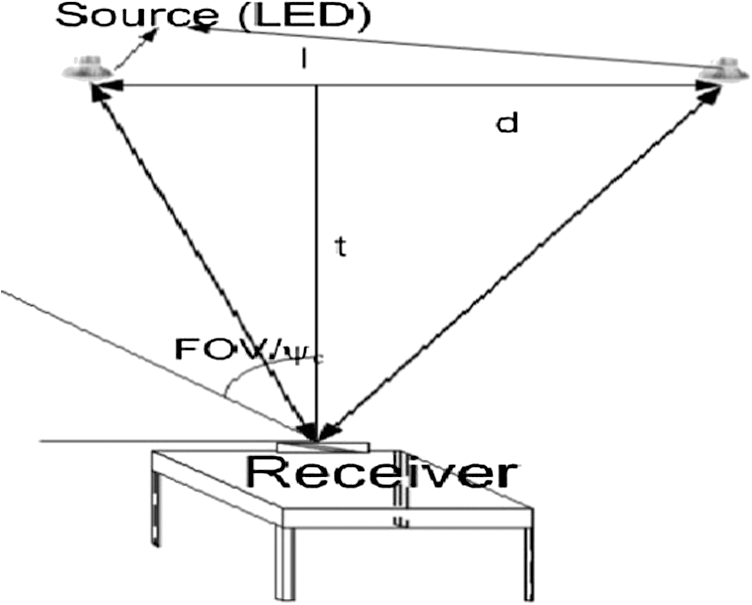
For the HCLL model, four LED bulbs are fixed at every corner of the area, and the other two bulbs are fixed on the ceiling. The difference between the common corner lighting layout and HCLL is the additional two LED bulbs fixed on the ceiling. The transmitter is fixed at 2.2-m height from the receiver. The coordinates and positions of the LED bulbs at the ceiling plane are shown in Fig. 2(a) and listed in Table 1. Fig. 2(a–c) The coordinate of the LED bulb for each model of the lighting layout: (a) hybrid corner lighting layout (HCLL), (b) hybrid wall lighting layout (HWLL), and (c) hybrid edge lighting layout (HELL). The number inside the two-dimensional diagram represents the coordinate of . 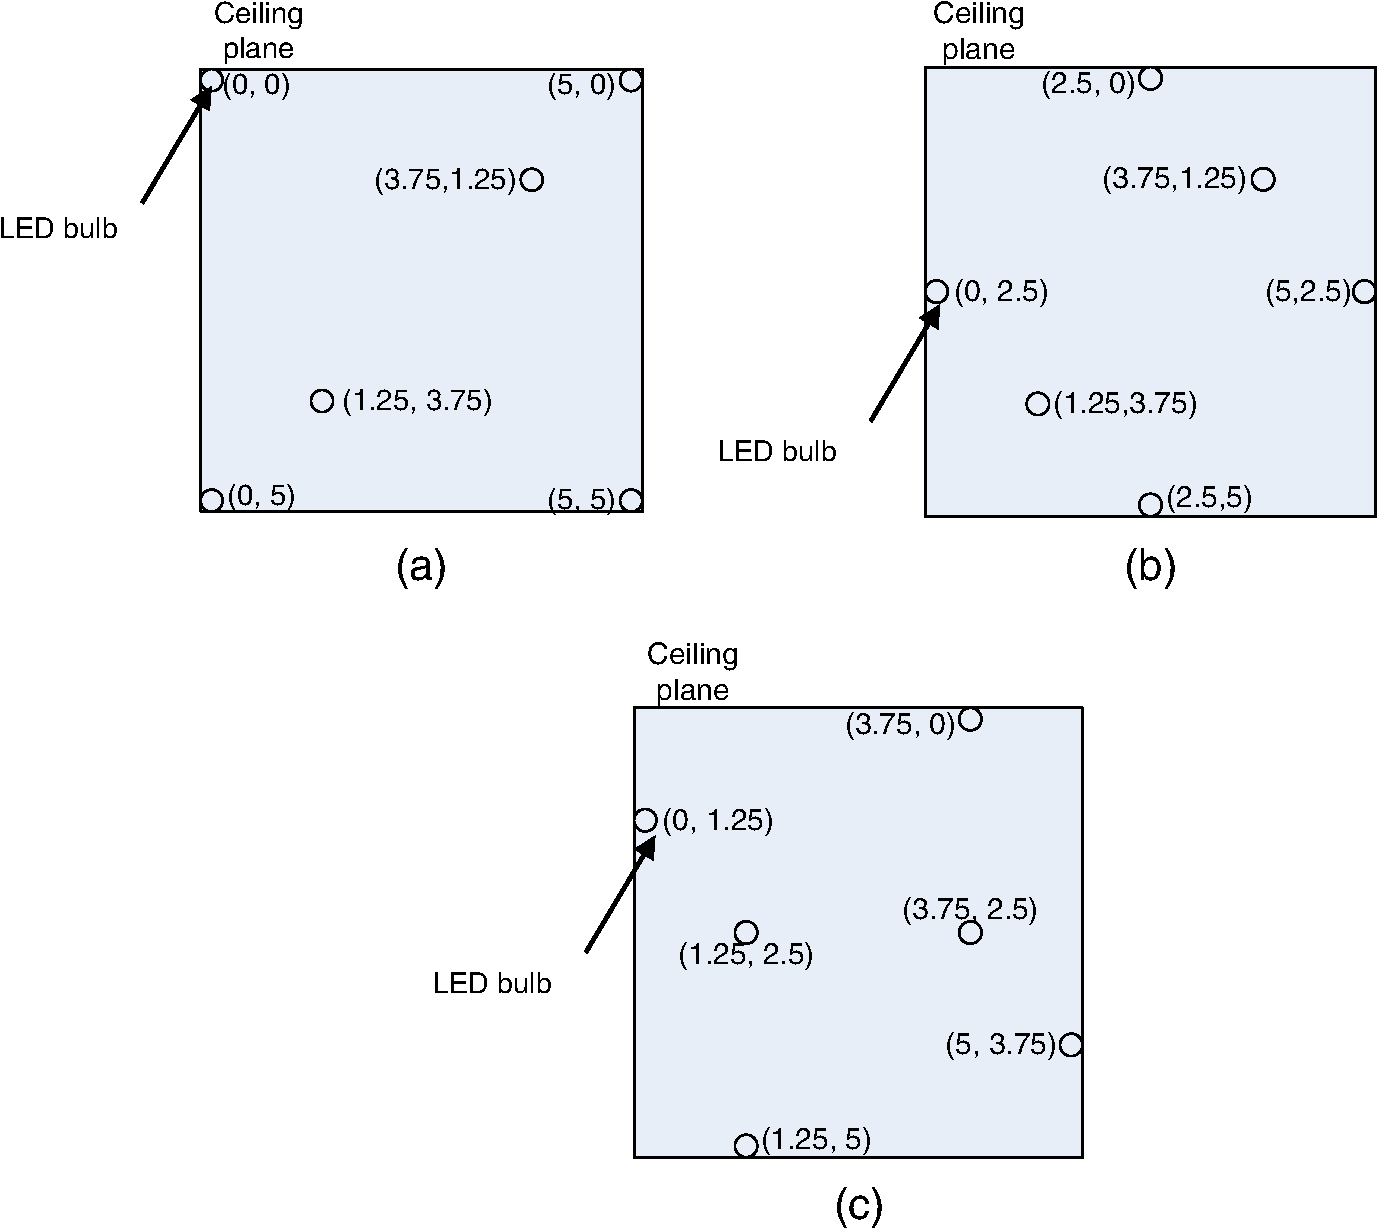 The second scheme is the HWLL, where four LED bulbs are fixed on the wall and the other two bulbs are fixed on the ceiling. The model of the HWLL is different from the common wall lighting layout because of the additional two LED bulbs on the ceiling. The coordinates of the LED bulbs in - and -axes are also given in Table 2, and the top view is shown in Fig. 2(b). The height remains the same as in the first model. The last layout model is the modification of the HWLL, named as HELL. With the same height as in the previous layout models, the and coordinates of the LED bulbs at the ceiling plane are given in Table 1 and illustrated in Fig. 2(c). The term hybrid is used which refers to the combination of the LED bulbs being fixed either at the corner or at the wall with LED bulbs fixed on the ceiling. The purpose of such combination is to ensure that the whole area is illuminated with sufficient brightness and to prevent blind-spot conditions. The uniformity of the light distributions of the three lighting layout models, which contributes to the efficiency of the VLC, was investigated. 3.VLCIn this section, mathematical modeling is used to describe the VLC system. The mathematical modeling begins with the intensity radiation of the LED light at the transmitter. The next subtopic discusses the expression for the channel gain and the effect of ISI on the VLC system. Using the channel gain equation for the intensity modulation and direct detection (IM/DD) technique, the received power can be determined by assuming that the light collected by the photodetector produces a current proportional to the instantaneous received power. 3.1.TransmitterIn the VLC system, the data are transmitted using the LED light through an optical medium to the receiver. The emission of light from the surface of the LED lamp can be assumed to have a Lambertian radiant intensity,21 which can be expressed as where is the order of the Lambertian emission, which is related to the of the transmitter semiangle (at half-power), and it is given byBy assuming that the transmitter emits an axially symmetric radiation pattern, the transmitted power, , from the LED can be expressed as where is the power emitted by the LED.3.2.Optical Wireless ChannelAccording to Barry and Kahn,22 a practical transmission technique for short-range communication in indoor applications is the IM/DD using on–off keying (OOK) modulation. This technique leads to an efficient spatial diversity, which prevents multipath fading. With this technique, the photodetector produces a current proportional to the instantaneous received power. Today, the major challenge in research on VLC systems is the limitation of modulation BW for higher rates of data transmission.23 The first experiment was demonstrated using the OOK technique that obtained data transmission rate up to based on the “blue-filtering” approach.9 The improvements on the data rate transmission had achieved up to (Ref. 24), (Ref. 25), and (Ref. 26) by using analogue equalization at the receiver. Moreover, a higher transmission rate up to (Ref. 27) was obtained using the same technique without equalization but with the use of an avalanched photodiode as the receiver instead of a photodiode (PD). Another modulation technique was recently introduced which is known as discrete multitone modulation. This modulation technique was able to achieve a transmission rate up to (Ref. 28) and currently improves the data transmission rate up to .13 In this analysis, the OOK modulation technique is used to provide the BW of the system up to 50 MHz for high data rate transmission. This BW is the minimum BW size to provide sufficient optional data rates for multimedia transmission such as real-time video, graphics, and the high-speed transfer of very large files.29 The presence of ambient light due to exposure of the photodetector caused by ambient light arising from sunlight, skylight, and incandescent and fluorescent lights is also taken into account.21,30,31 The presence of such unmodulated sources may induce shot noise in the wireless system and degrade the performance of optical wireless channel transmission.32 The shot noise can be modeled as white Gaussian noise, and the optical wireless channel is assumed to be an optical additive white Gaussian noise (AWGN), , that can be expressed as follows:11 where is the detector sensitivity in units of A/W, is the AWGN, denotes the convolution, is the instantaneous input power, and is the impulse response.3.3.ISIGenerally, the fading phenomenon occurs in optical wireless communication systems due to the existence of more than one version of signals received by the receiver at slightly different times.33 It could be the effect of multipath light propagation from multiple transmitters to a single receiver or the effect of nondirected line of sight (LOS) links. The nondirected LOS links are produced by refraction and reflection from the surroundings (the room properties and the distribution of light on the ceiling) of the transmitted light beam. The multipath signals arrive at the receiver at slightly different times and have different amplitudes and phases. By assuming that each white LED bulb only consists of one straight LOS path,34 the delay is caused by the signals produced by multiple transmitters located within the field of view (FOV) of the receiver. The multipath propagation causes ISI and degrades the performance of the system. The condition that contributes to ISI is that the data rate is out of the filter BW range, , with the signal arriving at the receiver within a time that is smaller than the symbol period delay, . In the ideal case (without delay), the received power , arriving at the photodetector in the time domain, is given by15 The received power for a directed LOS link without considering the delay time can be expressed as where is the channel gain for LOS, and represents the amplitude of the rectangular pulse using OOK modulation.Assuming that the delay of the signal arriving at the photodetector is greater than half of the symbol period delay, the received power that considered as ISI, , is given by where is the corresponding signal delay. The BW of the system is limited to 50 MHz, as mentioned above, and therefore the symbol period is limited to . The ISI will occur if the signal has a delay greater than half of the symbol period. In this analysis, the presence of ISI for each model is investigated for the maximal delay between two LOS optical paths. These paths are determined by the maximal radiation angle of the transmitter and its height from the working plane. The equation for calculating the time delay is given by35 where is the light speed, and , , and are given in Fig. 3.Based on the calculation, the maximum time delay produced by the three models is , showing that ISI due to different LOS paths is not present. Therefore, the influence of ISI in the channels of the three models of lighting layouts can be neglected. 3.4.Received PowerThe light beams emitted by LED bulbs pass through the optical filter and concentrator before reaching the receiver. Upon falling on the receiver surface, the optical signal is converted to an electrical signal and then processed by conventional electronics to recover the information. The average received optical power collected by the receiver is given by11 where is the DC channel gain, and is the average transmitted optical power. By assuming that the optical power emitted from the LED is characterized by a Lambertian output pattern, the DC channel gain for visible light with the directed and LOS link conditions can be expressed as21 where represents the order of Lambertian emission, refers to the physical area of the photodetector, is the optical filter gain, which is assumed to be 1, is the irradiance angle, is the angle of incidence, is the distance between the source and the receiver, and is the optical concentrator gain. The optical concentrator is used to improve the collection efficiency of the receptors.36,37 In the case of a nondirected LOS link, the value of the angle of is assumed equivalent to the angle of .The concentrator gain, , is given by11 where is the refractive index, which has a value of 1.5, and is the FOV of the photodetector.To obtain the maximum value of the DC channel gain, some parameters are fixed such as the physical area of the receiver, the FOV of the photodetector, the refractive index of the optical concentrator, and the optical to electrical conversion efficiency. The DC channel gain depends on the incidence angle, and it should be less than the FOV of the photodetector. No signal is received if the incidence angle exceeds the FOV because no light will fall on the photodetector. 4.Quality of the Received DataThe values for the channel gain and received power are unable to demonstrate the efficiency of the system; thus, the SNR is calculated to evaluate the performance of each lighting layout model. The quality of the communication systems of the three models is expressed with an SNR distribution that is given as16 where denotes the responsivity of the photodetector; is the transmitted power, which is assumed to be 12 W; and the total variance, , is the Gaussian noise associated with the output current produced by the receiver and can be expressed as15,32In this article, the preamplifier noise is neglected, and the noise is assumed to be dominated by the shot noise due to the influence of ambient light, which is given by36,38 where is the electrical charge, is the background current, is the noise BW, and is the noise BW factor for a rectangular pulse shape, .37 Again, to achieve measurement accuracy, the gate leakage current and noises are neglected in this study, assuming that the background light current is due to sunlight, which leads to a value of .30 The target of this system is to provide sufficient optional data rates for multimedia transmission such as the real-time video, graphics, and the high-speed transfer of very large files. A silicon-based PD, OSD5-15T type, is used, and it has a responsivity of in the blue region.Due to the use of a photodetector as the receiver, the thermal noise also plays a role in contributing to the noise in the system. Following the analysis of Smith and Personick, the thermal noise is expressed as22,39 where is the Boltzmann constant, is the fixed capacitance per unit area, is the environmental temperature, is the open-loop gain, is the field effect transistor (FET) transconductance, is the FET channel noise factor, and is the noise BW factor for a full, raised-cosine, equalized pulse shape with a value of 0.0868. The terms in Eq. (15) represent the feedback-resistor noise and FET channel noise, respectively.To maintain a stable communication link using the OOK modulation scheme, the minimum desired value of SNR is 13.6 dBm.40 In this section, the SNR value should be determined by the receiver, which is placed within the illuminated area. The calculation was performed using MathCad software to determine the SNR of the multiple LED lights in the office area with a single photodetector as the receiver on the working plane level. The parameters of the system are fixed according to the values stated in Table 2. Table 2Parameters for SNR calculation.
The coordinates of the LED lights are given in Table 1. Basically, the LED lights that operate as the transmitters are distributed at the same height but at different and coordinates. The SNR of the system can be represented for each model as 5.Results and DiscussionThe SNR distributions for all the lighting layouts models are explained below. In our case, the range of SNR values for the three models varies from a minimum value of 57 dB to a maximum value of 67 dB. To analyze the performance of the models, it is convenient to classify the SNR values as “excellent area,” “good area,” and “acceptable area,” as shown in Table 3. Although the SNR that is obtained via analytical studies is above the minimum desired value,16 the purpose of classifying the area is to study the uniformity of the SNR distribution for each layout. The analytical analysis performed by Grubor using an Si-based PD with a responsivity of showed an improvement of the SNR distribution value from the range of 47 to 60 dB (minimum, maximum)41 to the range of 60 to 73 dB (minimum, maximum)4 with additional of LED chips at the ceiling plane. Another analytical study in Ref. 16 achieved the lowest SNR of 69 dB by using the responsivity of a PD of . Table 3Area classification.
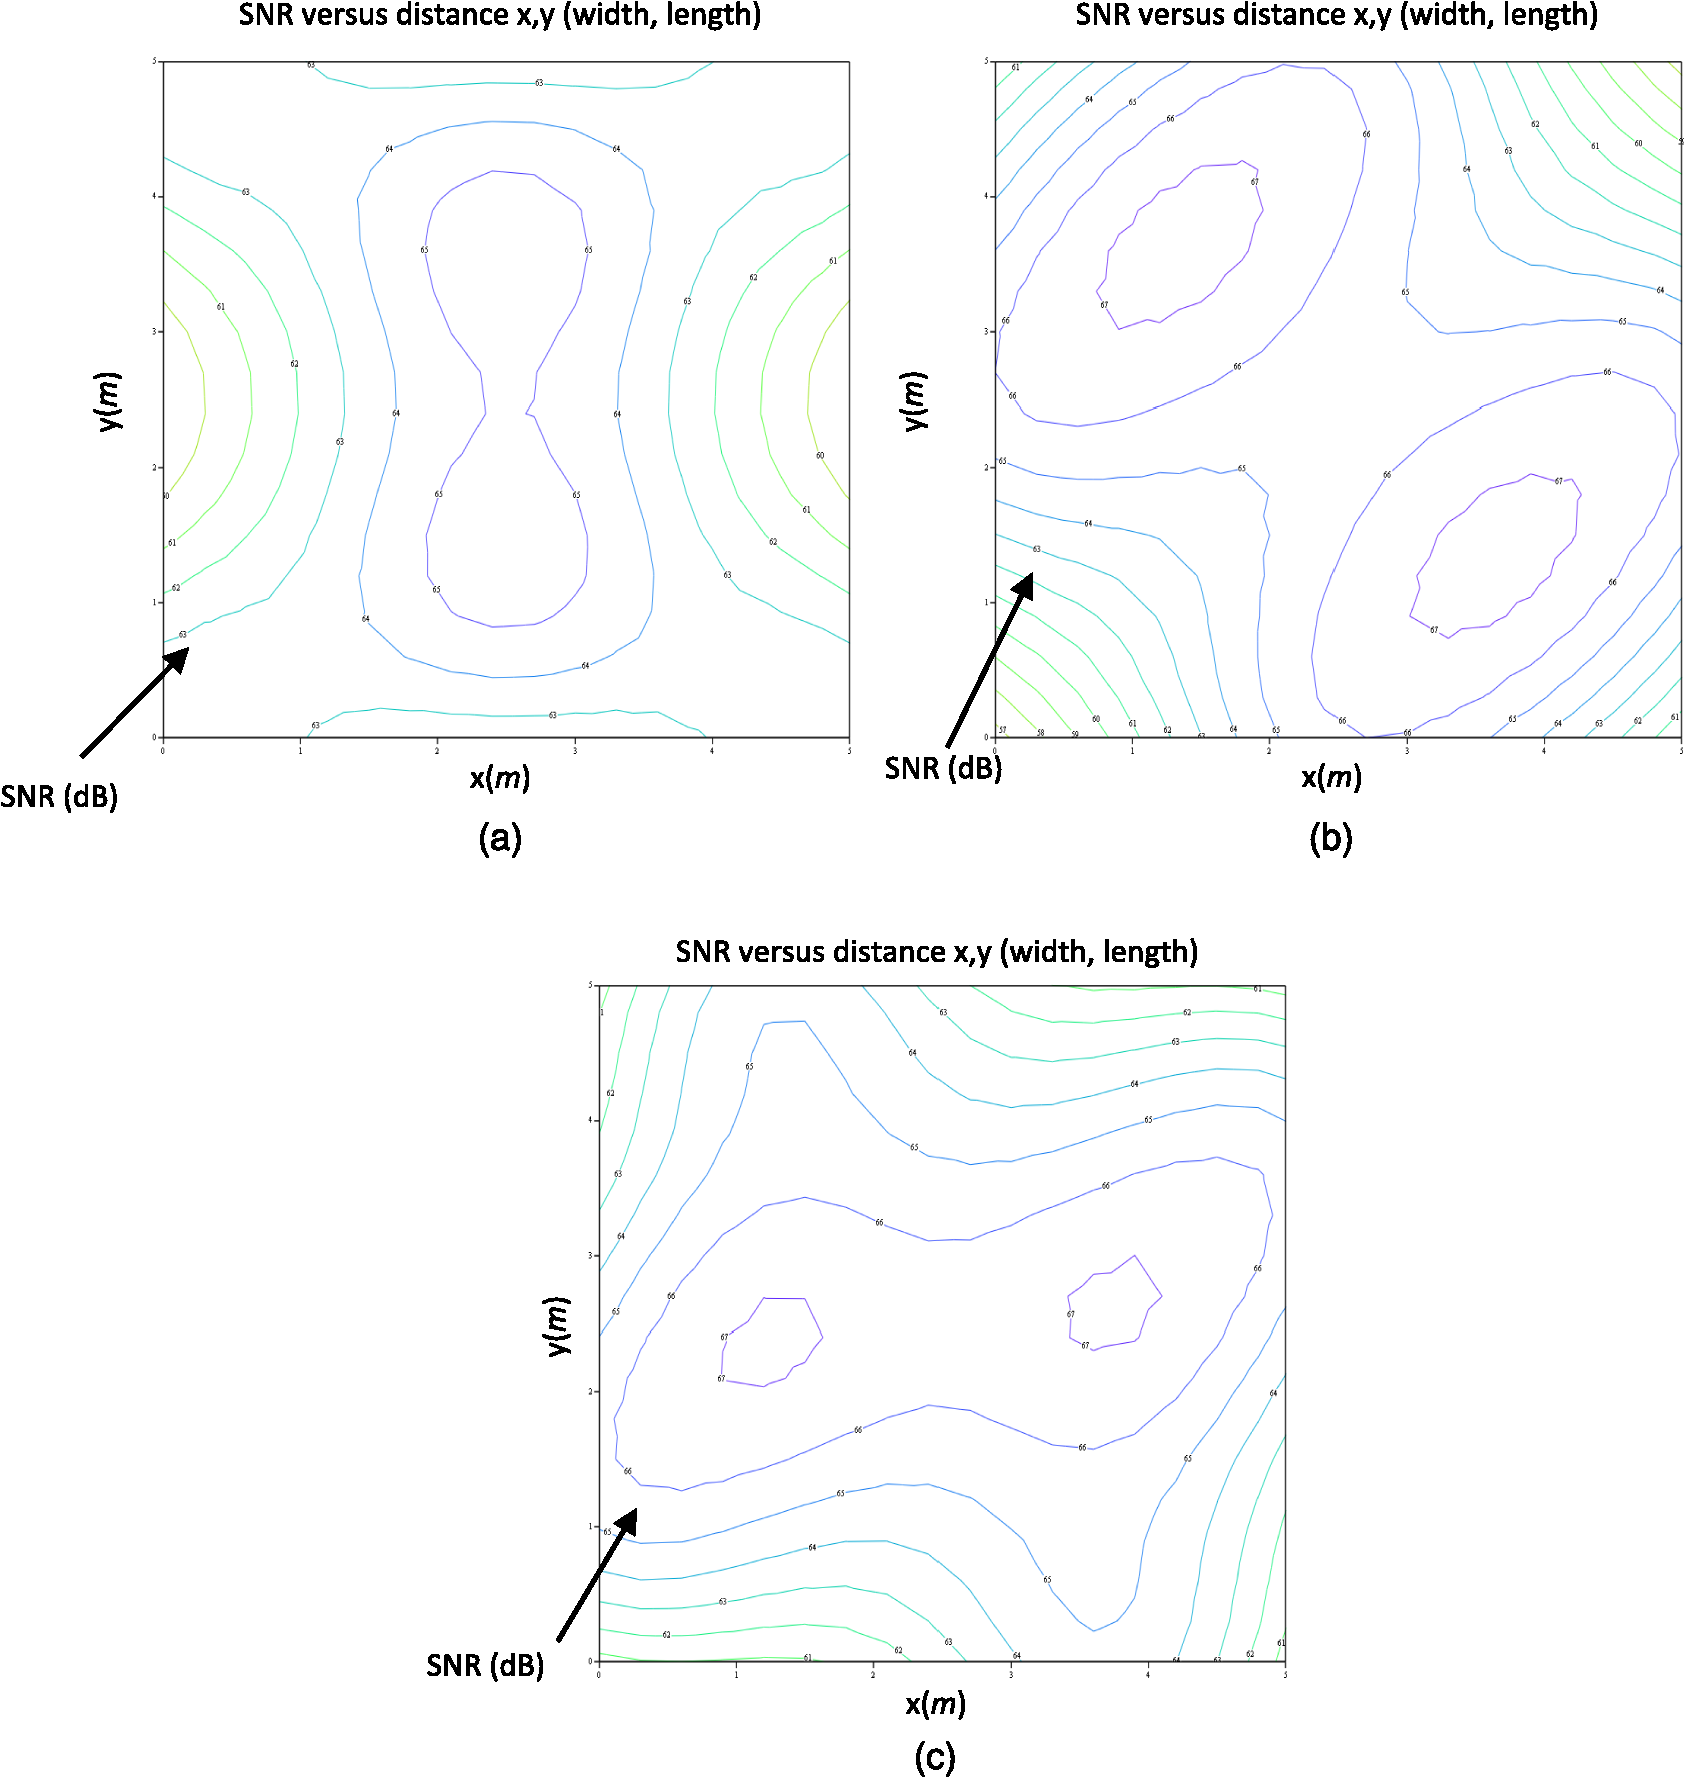
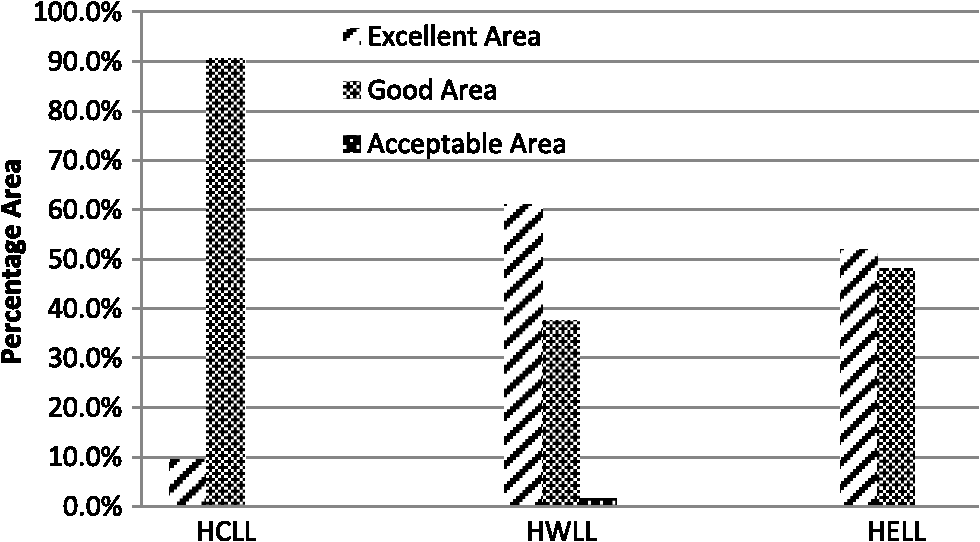
Note: The factory standard for a good SNR value is 40 dB using pulse-position modulation technique.42 5.1.HCLL ModelFigure 4(a) depicts the SNR distribution of the HCLL using six LED bulbs. The figure shows that the SNR are uniformly distributed within the range of 60 to 65 dB. However, based on the area classification, the excellent communication area only contributes approximately 9.5% of the total office area, while the remaining areas are considered as good communication areas. Referring to Fig. 2(a) and Table 1, two LED bulbs are fixed on the ceiling at the coordinates of (2.5, 1.25) and (2.5, 3.75). The purpose of placing the bulbs at these specific coordinates is to support the lighting at the center area, since the four bulbs placed at each corner are unable to give sufficient brightness. The combination of the light intensity radiated by the corner lights and the ceiling lights increased the SNR due to the increased received power. 5.2.HWLL ModelThe results in Fig. 4(b) show the SNR distribution of the model of HWLL. The range of SNR distributions for this model is within 67 to 57 dB. However, Fig. 4(b) shows the decrement of the SNR at two corner areas with values below 60 dB. These areas are approximately 1.5% of the whole office area and are considered as acceptable areas. In this figure, approximately 61% of the office area is considered as an excellent area for communication due to the combination of luminous intensities produced by the wall lights and ceiling lights, as shown in Table 1. The SNR decreased at the coordinates of (0, 0) and (5, 5) in the plane because both areas are far from the lighting sources. Therefore, the light intensity that fall on the areas is low and decreases the received power accordingly. 5.3.HELL ModelFigure 4(c) depicts the SNR distribution versus the coordinates of the office area with the HELL layout model. The range of SNR values for this model varies from the highest value of 67 dB to the lowest value of 61 dB. The percentage of excellent area is approximately 52% of the whole area, whereas 48% of the area is considered as good communication area. The SNR value at the corner area is lower than the center area because the illumination relies only on the wall light, whereas at the center area, the illumination is produced by the combination of wall lights and ceiling lights. The combination of wall lighting intensity and ceiling lighting intensity increases the SNR value due to the increment of received power. The LED bulbs fixed on the ceiling for each model increase the brightness of the working area, because the four LED bulbs at the corners and on the walls provide insufficient illumination. The arrangements of LED lights influenced the light distribution for the entire simulated area. As the distance between the source and receiver increases, the SNR decreases accordingly because the light intensity is inversely proportional with the distance, and thus, decreasing the received power and degrading the SNR distribution within the working area. The SNR distribution can be analyzed easily using the contour plot of the SNR distribution versus the length and width of the office area. Using the contour plot, the percentages of area classification of the SNR distribution can be calculated using the following equation: where is the area of the SNR distribution with the specific range of SNR as stated in Table 3, is the total area of , and is the classified area referring to the range of .Figure 5 illustrates the performance of the VLC system based on the area classification, as shown in Table 3. In this analysis, the best lighting layout must meet two criteria. The first criterion is the ability to achieve a high SNR distribution value, which is classified as the excellent communication area. The second criterion is having a uniform SNR distribution within the working area. Uniformity is defined as obtaining high percentage of the classified area. For practical implementation, uniformity is essential to prevent no-signal condition being detected within the area. To simplify the analysis of each model, the difference between the areas of classification for each model is being calculated, which is represented by , based on Fig. 5. The parameter is considered positive if the percentage of the “excellent” area is higher than the “good” and “acceptable” areas, whereas is negative if the opposite is true. The model with the greatest value of is considered the best model, because it has a large “excellent” area. According to Figs. 4(a)–4(c) and 5 and Table 4, the HWLL meets the requirement of the first criterion and is considered the best layout because this layout obtained the highest value of , as shown in Table 4. Although the HWLL consists of an area that is considered as an acceptable area, as shown in Fig. 5, the portion is very small and can be neglected. In fact, the value of “acceptable” areas is still above the factory standard and essentially considered to be “good.” Table 4Model selection.
6.ConclusionThis article proposed three models of modern lighting layouts for indoor VLC system. It is important to ensure that the system met the requirement of optical lighting and optical transmission. From the analytical results, all three layouts achieved SNR value within 57 to 67 dB using OOK modulation format for 50-MHz modulation BW. In fact, by using 50-MHz modulation BW, the ISI is neglected because the difference of the delay period of two signals emitted by different sources is still within the modulation BW. It is also observed that the uniformity of the LED light distributions and without the effect of interference is the key factor to enhance the performance of the VLC system. Based on the two criteria, the system performances for all layouts were compared referring to SNR distribution. From the analysis, HWLL layout was chosen to be the best layout to implement the VLC system, since the entire office area obtained an excellent SNR distribution with value of approximately 22%. This analysis implies that the VLC system can be implemented in the modern lighting layout for next generation. AcknowledgmentsThis work was supported by the School of Electrical and Electronic, University of Science Malaysia, and conducted at the Department of Electrical, Electronic and System of Faculty of Engineering and Built Environment, National University of Malaysia. ReferencesR. D. DupuisM. R. Krames,
“History, development, and applications of high-brightness visible light-emitting diodes,”
J. Lightwave Technol., 26
(9), 1154
–1171
(2008). http://dx.doi.org/10.1109/JLT.2008.923628 JLTEDG 0733-8724 Google Scholar
T. BorogovacM. RahaimJ. B. Carruthers,
“Spotlighting for visible light communications and illumination,”
in IEEE GLOBECOM Workshops (GC Wkshps),
1077
–1081
(2010). Google Scholar
D. C. O’Brienet al.,
“Visible light communications: challenges and possibilities,”
in IEEE 19th Int. Symp. Personal, Indoor and Mobile Radio Communications, 2008 (PIMRC 2008),
1
–5
(2008). Google Scholar
J. Gruboret al.,
“Broadband information broadcasting using LED-based interior lighting,”
J. Lightwave Technol., 26
(24), 3883
–3892
(2008). http://dx.doi.org/10.1109/JLT.2008.928525 JLTEDG 0733-8724 Google Scholar
K. Fanet al.,
“The effect of reflection on indoor visible-light communication system utilizing white LEDs,”
in The 5th Int. Symp. Wireless Personal Multimedia Communications, 2002,
611
–615
(2002). Google Scholar
H. SugiyamaS. HaruyamaM. Nakagawa,
“Brightness control methods for illumination and visible-light communication systems,”
in Third Int. Conf. Wireless and Mobile Communications, 2007 (ICWMC ‘07),
78
(2008). Google Scholar
L. KwonhyungP. HyuncheolJ. R. Barry,
“Indoor channel characteristics for visible light communications,”
IEEE Commun. Lett., 15
(2), 217
–219
(2011). http://dx.doi.org/10.1109/LCOMM.2011.010411.101945 ICLEF6 1089-7798 Google Scholar
M. Hoa Leet al.,
“High-speed visible light communications using multiple-resonant equalization,”
IEEE Photonics Technol. Lett., 20
(14), 1243
–1245
(2008). http://dx.doi.org/10.1109/LPT.2008.926030 IPTLEL 1041-1135 Google Scholar
J. Gruboret al.,
“Wireless high-speed data transmission with phosphorescent white-light LEDs,”
in 2007 33rd European Conf. and Exhibition of Optical Communication—Post-Deadline Papers (published 2008),
1
–2
(2007). Google Scholar
S. Haruyama,
“Progress of visible light communication,”
in 2010 Conf. (OFC/NFOEC) Optical Fiber Communication (OFC), collocated National Fiber Optic Engineers Conference,
1
–3
(2010). Google Scholar
J. M. KahnJ. R. Barry,
“Wireless infrared communications,”
Proc. IEEE, 85
(2), 265
–298
(1997). http://dx.doi.org/10.1109/5.554222 IEEPAD 0018-9219 Google Scholar
F. E. AlsaadiJ. M. H. Elmirghani,
“Multibeam mobile optical wireless systems employing beam power and angle adaptation method,”
in 2010 IEEE Int. Conf. Communications (ICC),
1
–6
(2010). Google Scholar
J. Vucicet al.,
“ visible light communications link based on DMT-modulation of a white LED,”
J. Lightwave Technol., 28 3512
–3518
(2010). Google Scholar
C. Jae HyuckK. Sung WanK. Jin Young,
“Influence of optical path difference on visible light communication systems,”
in 9th Int. Symp. Communications and Information Technology, 2009 (ISCIT 2009),
1247
–1251
(2009). Google Scholar
T. KomineM. Nakagawa,
“Fundamental analysis for visible-light communication system using LED lights,”
IEEE Trans. Consumer Electron., 50
(1), 100
–107
(2004). http://dx.doi.org/10.1109/TCE.2004.1277847 ITCEDA 0098-3063 Google Scholar
Z. Lubinet al.,
“Improvement of date rate by using equalization in an indoor visible light communication system,”
in 4th IEEE Int. Conf. Circuits and Systems for Communications, 2008 (ICCSC 2008),
678
–682
(2008). Google Scholar
D. DingX. KeL. Xu,
“An optimal lights layout scheme for visible-light communication system,”
in 8th Int. Conf. Electronic Measurement and Instruments, 2007 (ICEMI ‘07),
2-189
–2-194
(2007). Google Scholar
Y. K. I. MiyaY. Kajikawa,
“Base station layout support system for indoor visible light communication,”
in Int. Symp. Communications and Information Technologies (ISCIT), 2010,
661
–666
(2010). Google Scholar
“Code of Practice on Energy Efficiency and use of Renewable Energy for Non-residential Buildings,”
(2007). Google Scholar
B. M. Deroset al.,
“Recommended chair and work surfaces dimensions of VDT tasks for Malaysian citizens,”
Eur. J. Sci. Res., 34
(2), 156
–167
(2009). http://dx.doi.org/10.1183/09031936.00160208 1450-216X Google Scholar
F. R. GfellerU. Bapst,
“Wireless in-house data communication via diffuse infrared radiation,”
Proc. IEEE, 67 1474
–1486
(1979). http://dx.doi.org/10.1109/PROC.1979.11508 IEEPAD 0018-9219 Google Scholar
J. R. BarryJ. M. Kahn,
“Design of non-directed infrared links for high-speed wireless networks,”
in Conf. Proc. Lasers and Electro-Optics Society Annual Meeting, 1994 (LEOS ‘94),
207
(1994). Google Scholar
D. K. J. S.-B. Parket al.,
“Information broadcasting system based on visible light signboard,”
in Proc. Wireless Opt. Commun. 2007, Montreal, Canada,
311
–313
(2007). Google Scholar
M. Hoa Leet al.,
“ visible light communications using pre-equalized white LED,”
in 34th Eur. Conf. Optical Communication, 2008 (ECOC 2008),
6
–9
(2008). Google Scholar
M. Hoa Leet al.,
“100-Mb/s NRZ visible light communications using a postequalized white LED,”
IEEE Photonics Technol. Lett., 21
(15), 1063
–1065
(2009). http://dx.doi.org/10.1109/LPT.2009.2022413 IPTLEL 1041-1135 Google Scholar
J. Vucicet al.,
“ over 5 m wireless distance by use of OOK-modulated phosphorescent white LEDs,”
in 35th Eur. Conf. Optical Communication, 2009 (ECOC ‘09),
1
–2
(2009). Google Scholar
J. Vucicet al.,
“ via a wireless visible-light link based on OOK modulation of phosphorescent white LEDs,”
in 2010 Conf. (OFC/NFOEC) Optical Fiber Communication (OFC), collocated National Fiber Optic Engineers Conf.,
1
–3
(2010). Google Scholar
J. Vucicet al.,
“White light wireless transmission at net data rate by use of discrete-multitone modulation,”
IEEE Photonics Technol. Lett., 21 1511
–1513
(2009). http://dx.doi.org/10.1109/LPT.2009.2028696 IPTLEL 1041-1135 Google Scholar
C. Ta-ShingM. Gans,
“High speed infrared local wireless communication,”
IEEE Commun. Mag., 25
(8), 4
–10
(1987). http://dx.doi.org/10.1109/MCOM.1987.1093675 ICOMD9 0163-6804 Google Scholar
A. J. C. MoreiraR. T. ValadasA. M. De Oliveira Duarte,
“Optical interference produced by artificial light,”
Wireless Networks, 3
(2), 131
–140
(1997). http://dx.doi.org/10.1023/A:1019140814049 1022-0038 Google Scholar
A. C. Boucouvalas,
“Indoor ambient light noise and its effect on wireless optical links,”
in IEE Proc. Optoelectronics,
334
–338
(1996). Google Scholar
I. E. LeeM. L. SimF. W. L. Kung,
“Performance enhancement of outdoor visible-light communication system using selective combining receiver,”
IET Optoelectron., 3
(1), 30
–39
(2009). http://dx.doi.org/10.1049/iet-opt:20070014 1751-8768 Google Scholar
F. Xiong, Digital Modulation Techniques, Artech House, Inc., London, UK
(2000). Google Scholar
Y. TanakaS. HaruyamaM. Nakagawa,
“Wireless optical transmissions with white colored LED for wireless home links,”
in The 11th IEEE Int. Symp. Personal, Indoor and Mobile Radio Communications, 2000 PIMRC 2000,
1325
–1329
(2000). Google Scholar
P. AmirshahiM. Kavehrad,
“Broadband access over medium and low voltage power-lines and use of white light emitting diodes for indoor communications,”
in 3rd IEEE Consumer Communications and Networking Conf., 2006, CCNC 2006,
897
–901
(2006). Google Scholar
P. P. S. M. McCullaghet al.,
“Optical wireless local area networks: enabling technologies: advances in optical technology,”
BT Technol. J., 11
(2), 56
–64
(1993). BTJUEH 1358-3948 Google Scholar
R. Ramirez-IniguezR. J. Green,
“Indoor optical wireless communications,”
in IEE Colloquium on Optical Wireless Communications (Ref. No. 1999/128),
14/1
–14/7
(1999). Google Scholar
T. KomineM. Nakagawa,
“Performance evaluation of visible-light wireless communication system using white LED lightings,”
in Proc. (ISCC 2004) Ninth Int. Symp. Computers and Communications, 2004,
258
–263
(2004). Google Scholar
R. SmithS. Personick,
“Receiver design for digital fiber optic communication systems, I and II,”
Bell Syst. Tech. J., 52 843
–886
(1973). http://dx.doi.org/10.1002/bltj.1973.52.issue-6 BSTJAN 0005-8580 Google Scholar
S. B. Alexandar, Optical Communication Receiver Design, 1st ed.SPIE Press, Bellingham, Washington
(1997). Google Scholar
O. C. G. J. J. Gruboret al.,
“High-speed wireless indoor communication via visible light,”
ITG Fachbericht, 198 203
–208
(2007). Google Scholar
J. Rufoet al.,
“Experimental evaluation of video transmission through LED illumination devices,”
IEEE Trans. Consumer Electron., 56
(3), 1411
–1416
(2010). http://dx.doi.org/10.1109/TCE.2010.5606277 ITCEDA 0098-3063 Google Scholar
BiographyLuqman A. Azizan is currently a master’s candidate from the Department of Electrical, Electronic and Systems Engineering, Faculty of Engineering and Built Environment, National University of Malaysia. He received his BEng degree from University of Science Malaysia in the field of electrical engineering in 2007. His current research interests are in renewable energy, optical communication, and visible light communication. Mohammad S. Ab-Rahman is a professor in the Department of Electrical, Electronics, and System Engineering, Faculty Universiti Kebangsaan Malaysia (UKM). He received the BEng, MSc, and PhD degrees in electrical, electronics, and systems engineering from UKM, Selangor, in 2000, 2003, and 2007, respectively. He is a member of the Institute of Electronics, Information and Communication Engineers (IEICI), Japan, and the Institution of Engineers Malaysia (IEM), Board of Engineers Malaysia (BEM). He joined the Institute of Micro Engineering and Nano Electronics (IMEN) in 2003. He has also been an associated research fellow in IMEN since 2006. His current research interests are in the area of photonic networks and optical communication. Mazen R. Hassan is a senior lecturer at Asia Pacific University. He received his BSc and MS degrees in 1999 and 2002, respectively, from University of Basra, Basra, Iraq, and a PhD degree from Universiti Kebangsaan Malaysia (UKM) (National University of Malaysia), Malaysia, in 2011, all in electrical engineering. His current interests include modeling of laser diodes employed in optical communication systems and subjected to physical phenomena. A. Ashrif A. Bakar received a PhD degree in electrical engineering from the University of Queensland, Australia, in 2010. He joined the Universiti Kebangsaan Malaysia in 2005 as an academic staff and researcher. He is currently a senior lecturer at the Department of Electrical, Electronics, and Systems Engineering, Universiti Kebangsaan Malaysia. His research interests are related to photonics technology, specifically on optical sensor development, optical fiber subsystems, and devices and biomedical applications. Rosdiadee Nordin received his BEng degree from Universiti Kebangsaan Malaysia, in 2001, and a PhD degree from University of Bristol, United Kingdom, in 2011. He is currently a senior lecturer in the Department of Electrical, Electronics, and System Engineering in Universiti Kebangsaan Malaysia. His research interests include multiple-input multiple-output (MIMO), orthogonal frequency-division multiple access (OFDMA), resource allocation, energy efficient wireless communication, indoor wireless localization, and visible light wireless communication. |
||||||||||||||||||||||||||||||||||||||||||||||||||||||||||||||||||||||||||||||||||||||||||||||||||||||||||||||||||||||||||||||||||||||||||||||||||||||||||||||||||||