|
|
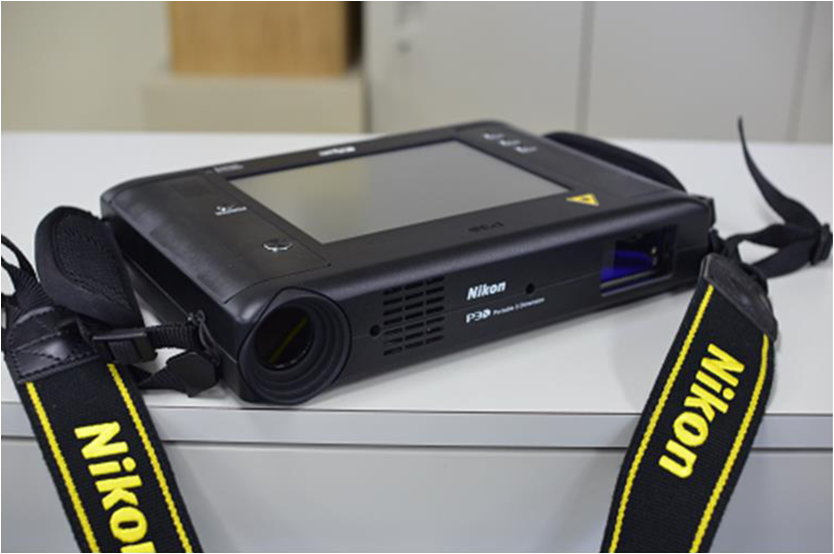
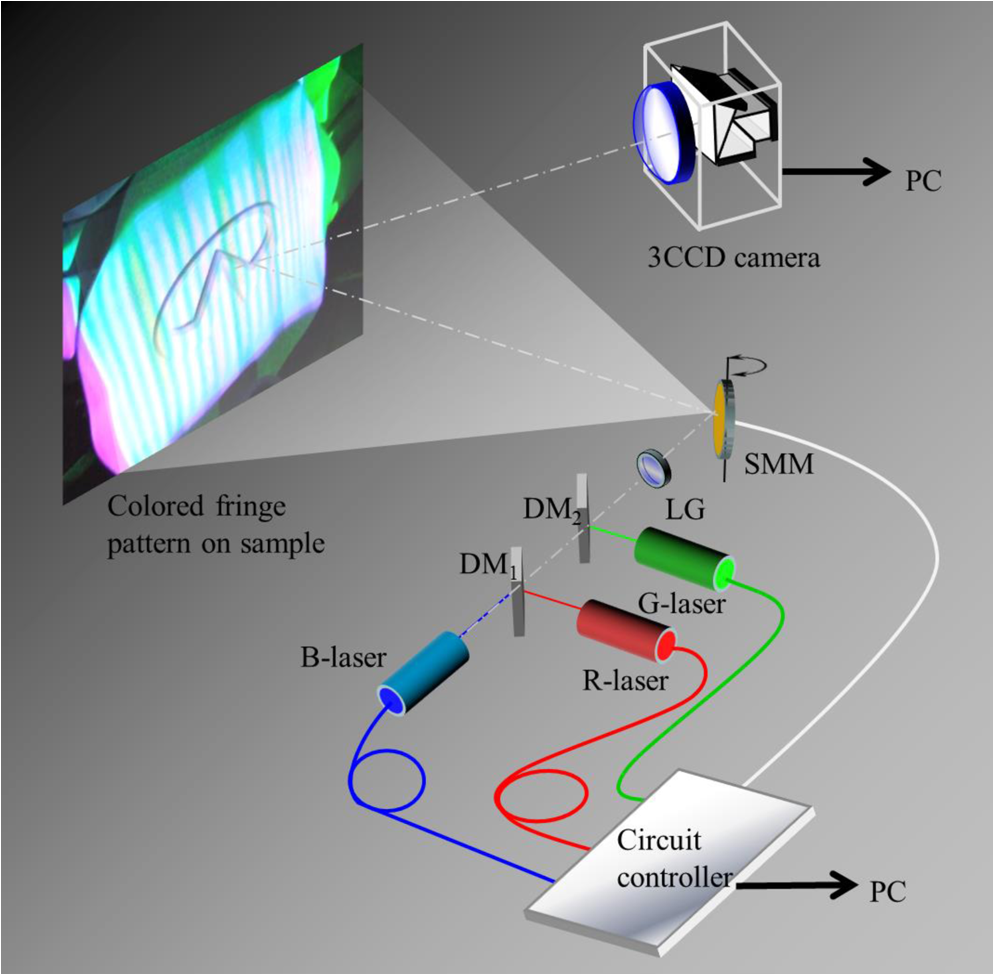
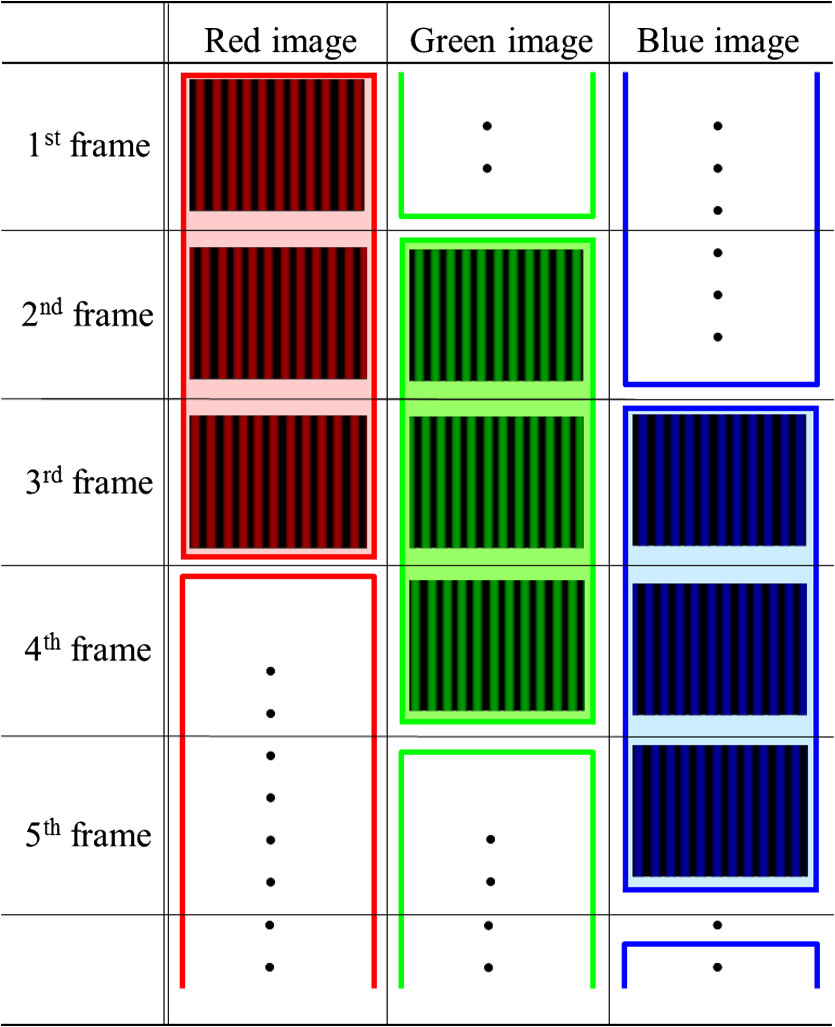
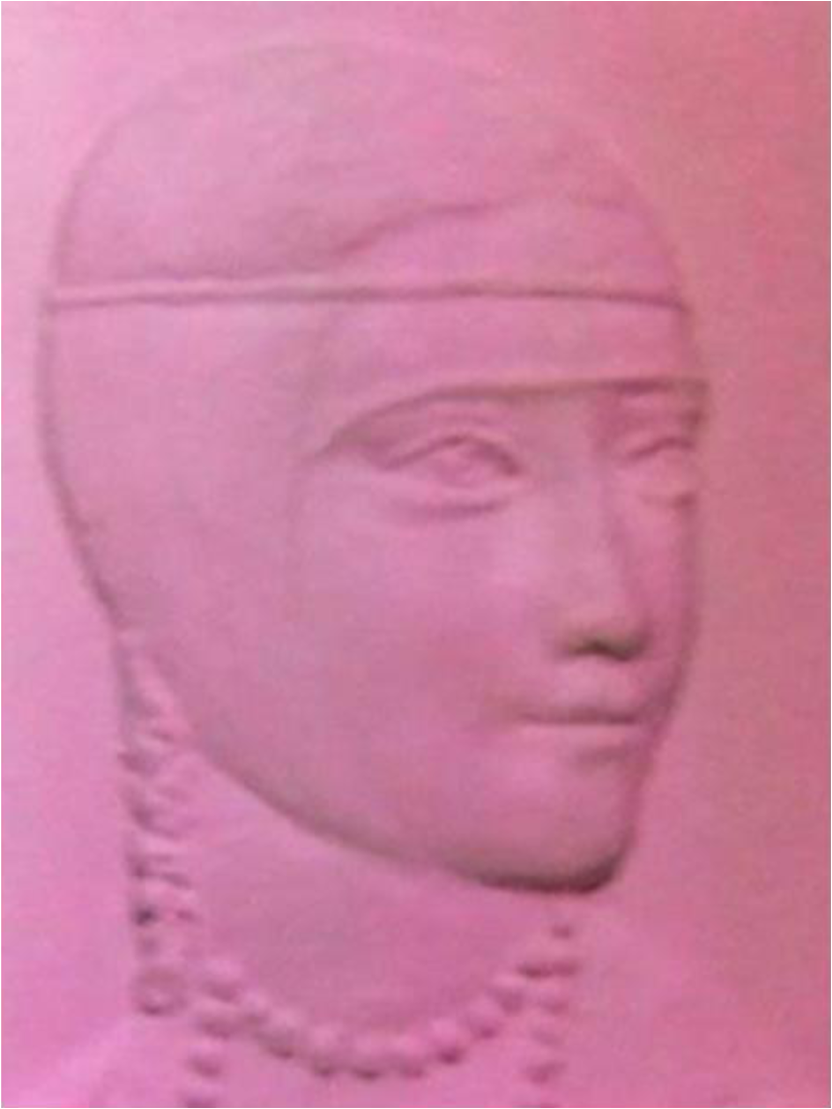
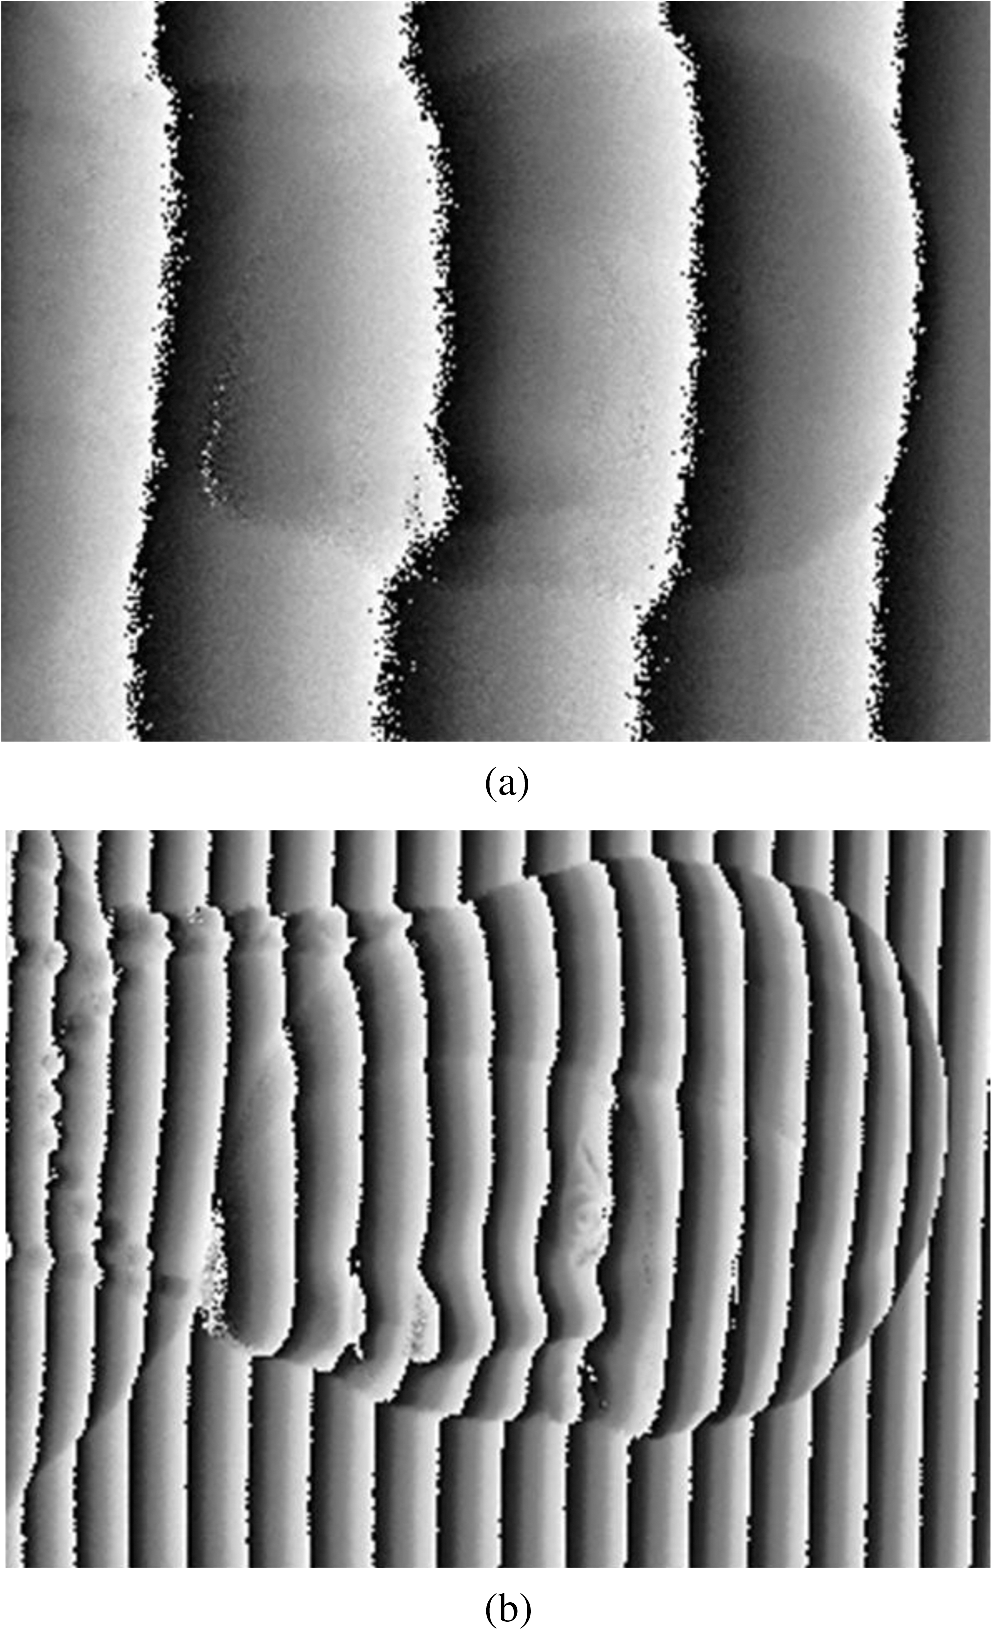
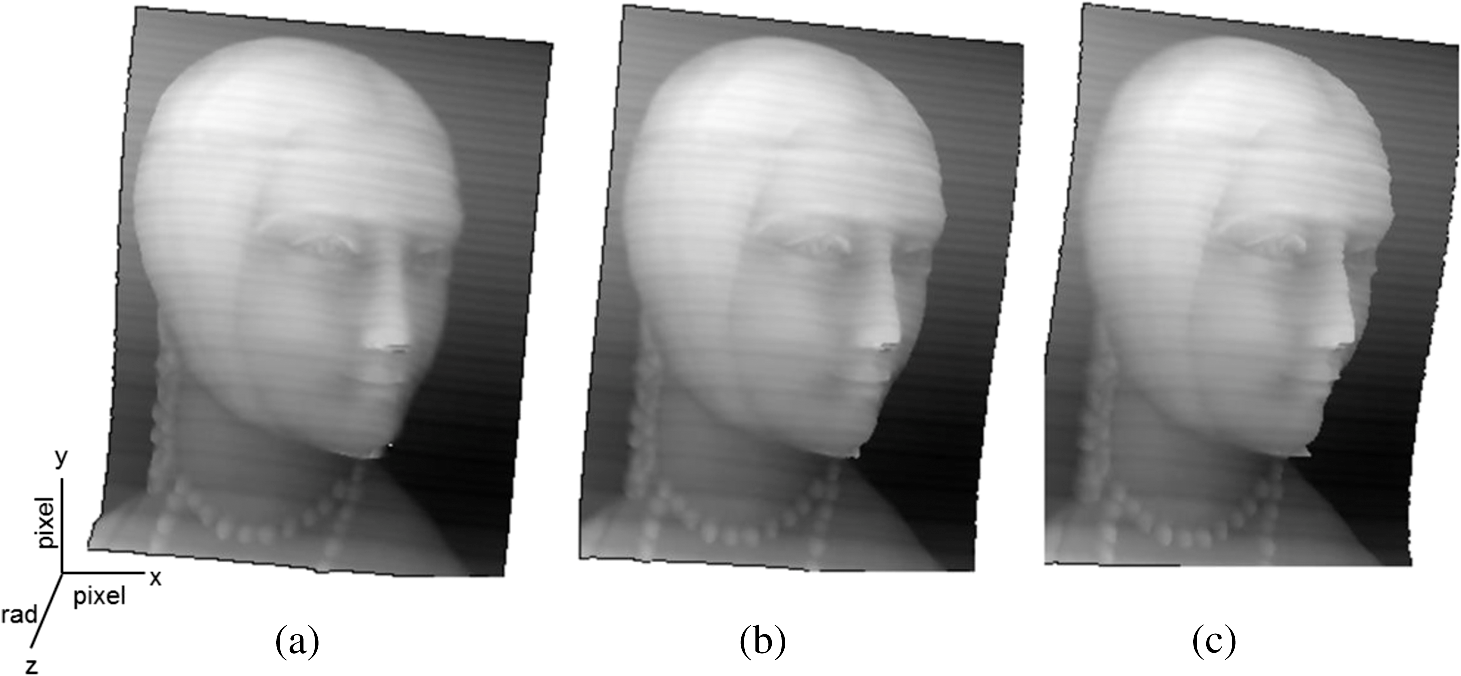
1.IntroductionHigh-speed three-dimensional (3-D) shape measurements based on a pattern projection technique are employed in mechanical, automobile, aircraft, medical, and heavy industries.1 An important requirement for these applications is shorter measurement time. Among various techniques for 3-D shape measurement such as precision, accuracy, and full-field measurement, pattern projection is often preferred. If one could achieve faster phase shifting using smaller elements and devices, a more compact measurement system could be constructed that is both portable and easy to use. In addition to speed, precise shifting and an appropriate intensity distribution (preferably sinusoidal) are desired. Recently, a few papers have been published on 3-D shape measurements using a liquid crystal grating, a digital mirror device (DMD), a single micro-electro-mechanical system (MEMS) mirror, a linear LED array, and a polygonal mirror.2–6 In particular, phase shifting using a digital projector with a built-in DMD has attained ultrafast 3-D shape measurements.3,7–12 A DMD is at the heart of a digital light processing (DLP) unit. Digital projectors are readily available due to their popularity for industrial and consumer applications. In case of the use of the digital projectors, Pan et al.7 has suggested the importance of preferable sinusoidal intensity distribution of a fringe and has demonstrated the phase compensation algorithm. As described by Zhang et al., conventional commercial DLP projectors are limited to a 120-Hz measurement rate. The speed of switching multiple 8-bit grayscale patterns is limited by the refresh rate in 3-D measurements.10 To overcome that drawback, techniques such as defocusing a square-shaped binary pattern has enabled 3-D shape measurements at a rate of 20 kHz.8 However, the measurement accuracy in the defocused area and the depth of the measured area are poor. An alternative ultrafast phase-shifting technique using a single MEMS mirror (SMM) and a laser diode was proposed in 2007.4,13–15 A SMM is scanned to accomplish the time-space transformation of the modulation signal. This spatiotemporal phase-shifting technique has merits, especially for applications that require high speeds. Use of a single mirror could enable compact equipment such as a commercial digital camera. Such a 3-D camera can cover a larger measurement area, determined by the focal depth of the projection optics. Eliminating the projection lenses will avoid aberrations caused by the optics. Therefore, this technique has potentiality that realizes the compact measurement system with superfast measurement speed. A compact system (P3D, Nikon Corp., Tokyo, Japan) shown in Fig. 1 has already been developed for practical applications in various industries.16 This measuring instrument has high accuracy of 0.3 mm covering the size of and the dynamic range of depth is . It takes 5 s to display 3-D shape on the built-in LCD monitor after capturing images and processing the 3-D data. Another method accomplishes phase shifting using a linear LED array at a rate of 12 kHz. It can be applied to 3-D measurements at 4 kHz using a three-step algorithm.5 Some success was reported by Huang et al. They proposed a color-encoded fringe projection technique for three-step phase shifting, one in each color band, with a phase shift of between neighboring channels.17,18 Furthermore, Zhang et al.19 used a 3CCD camera to independently record fringe images in each RGB channel. However, they could not measure sinusoidal fringe patterns of different periods and phases, because their projector used a one-chip DMD. To overcome this limitation and achieve high-speed 3-D measurements, a multiwavelength spatiotemporal phase-shifting technique is proposed in the present work.20 This makes it possible to project three color fringe patterns with different periods using only one MEMS mirror and three laser diodes. This technique can control the initial phase of the periodic patterns. A novel projection technique is developed to control the periods and phases of the fringe patterns. In this article, we proposed high-speed 3-D shape measurement method using the multiwavelength spatiotemporal phase-shifting technique. The method is achieved to determine the phase distributions in each RGB channel. The strong point of this measurement is able to time-sequentially obtain the 3-D shape of sample without any color crosstalk. As a matter of course, this technique is also applied to determination of a phase distribution using RGB color channels. In addition to its application to 3-D shape measurements of objectives for a continuously varying surface, it can be used to measure samples having large steps or steep changes. It incorporates a gray code technique. In this experiment, we demonstrate to independently shift the phase of fringe patterns and measure 3-D shape of samples with large steps. 2.Principle2.1.Multiwavelength Spatiotemporal Phase-Shifting TechniqueFigure 2 sketches the phase-shifting technique using a red (R), a green (G), and a blue (B) lasers. To illuminate a two-dimensional area on a sample, an SMM, and a line generator lens (LG) are employed. The blue, red, and green laser beams are combined in dichroic mirrors DM1 and DM2. The LG converts the point beam into a fan, which is reflected by the SMM sympathetically vibrated at . The swing of the MEMS mirror can be adjusted from 0 to , so that the scanning angle is Fig. 2Scheme of the phase-shifting technique using RGB lasers and a single micro-electro-mechanical system (MEMS) mirror. 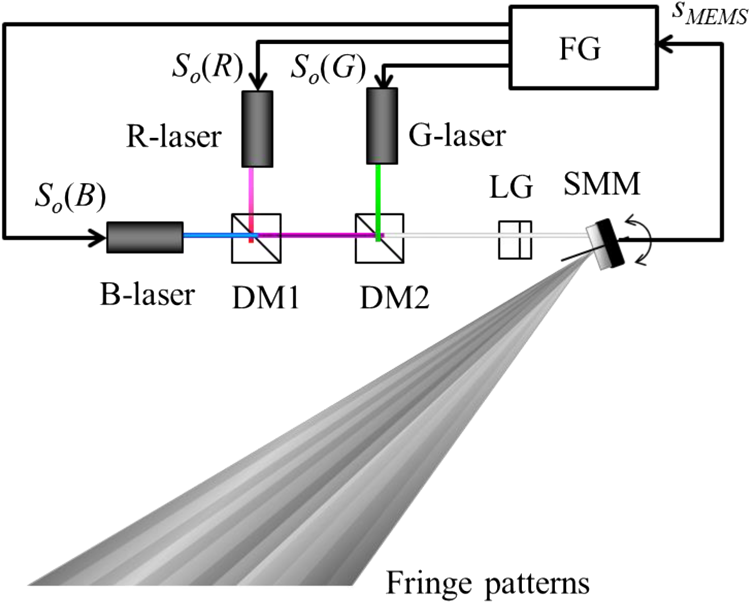 This scanning is used to transform from the time to the space domain. The phase-shifting technique is illustrated in Fig. 3. Panel (a) plots the signals applied to the laser diodes. These signals are synchronized to the swing of the SMM and are output in binary form. During the positive swing of the mirror, the laser diodes are modulated at a frequency , whereas during the return swing no signal is applied. This technique can thereby independently control the initial phase and the frequency of the signals. The output signals are multiplied by the input signals and , i.e., by both a sinusoidal and a square wave. Here, denotes the wavelength of the laser diodes. These signals are expressed as and where and are the bias and amplitude of the signals, respectively. When the initial phases of the signals are different in each channel, colored fringe patterns result as shown in Fig. 3(b). The overall image then has the colorful pattern depicted in Fig. 3(c).2.2.High Speed 3-D Shape MeasurementsFigure 4 shows the experimental setup for 3-D shape measurements. Using a circuit controller such as a function generator to adjust the amplitude, bias, frequency, and initial phase, colorful periodic patterns can be projected. A 3CCD camera captures the fringe patterns and separates the red, green, and blue channels using an RGB prism inside the camera. The intensity distribution is Here, , , and represent the bias components, , , and the amplitude components of each channel, and , , and the phase distributions including sample height information, respectively. The intensity distributions captured by the three-chip CCD can also be written as andBy controlling the initial phase, frequency, amplitude, and bias of the intensity distributions, it is possible to utilize the phase-shifting technique of Haung and Zhang.3 The technique uses a color fringe pattern with a phase shift between neighboring-colored channels. A three-step phase shift gives values of , , and , where , 1, and 2, respectively. When the amplitude and bias are ideally adjusted so that and with a phase shift of between neighboring color channels, the phase distribution can be obtained from the three-step algorithm as The present technique also provides phase distributions for the 3-D shape measurement in every frame. Figure 5 indicates the analysis procedure for high-speed measurements. The phase distributions can be written as By sliding the timing of the phase shift, the three phase distributions are sequentially obtained in three frames. The phase distribution can be measured in every frame. It is possible to obtain the phase distributions for all frames, including sample height information, when the fringe patterns have initial phases differing in steps of . This phase shift technique is independent of wavelength because the intensity distributions are routed by internal RGB prisms in the 3CCD camera. That is, there is no color crosstalk because the system uses three laser diodes and a three-chip CCD. It is thus possible to develop various applications not only for high-speed measurements but also over a wide range for the gray code technique. In the latter case, height steps can be determined by analyzing the binary patterns after illumination with color patterns. 3.Experimental Setup and Performance CheckFast measurements of 3-D shapes having height steps are performed. The laser diode wavelengths and output powers are: red (R) at and 100 mW, green (G) at and 50 mW, and blue (B) at and 30 mW. The laser beams are mixed together and expanded by an LG. The expansion angle of the lens is 75 deg. The line beam is incident on the SMM (LSM-500CL, Venture Forum Mie, Mie, Japan) driven at 500 Hz. The sinusoidal and rectangular waves are applied as the signal voltages at different frequencies to the laser diodes using a circuit controller. The properties of the signals at each colored channel are individually controlled. The red channel has a 40-kHz sinusoidal wave applied to it, the blue channel a 10-kHz sinusoidal wave, and the green channel a rectangular wave at 2.5, 5, or 10 kHz. A 3CCD camera (IK-TF5C, Toshiba, Tokyo, Japan) synchronously captures the image with a periodic pattern at a frame rate of 60 fps. A painting on plasterboard serves as the sample. The size of the painting is . Figure 6 shows an image measured using a digital camera. It does not capture the fringes because the period of the phase shift is 10 ms. The projected patterns are separately illuminated with two sinusoidal fringe sequences having different frequency and binary code patterns. Figure 7 presents the composite images captured by the 3CCD camera, and those separated into individual RGB channels. The blue and red channels consist of low-frequency and high-frequency fringe patterns, respectively. In contrast, the green channels are modulated using a gray code technique. Fig. 7Captured images using 3CCD camera and separated images at each wavelength, (a) composite images, (b) blue images, (c) green images, and (d) red images. 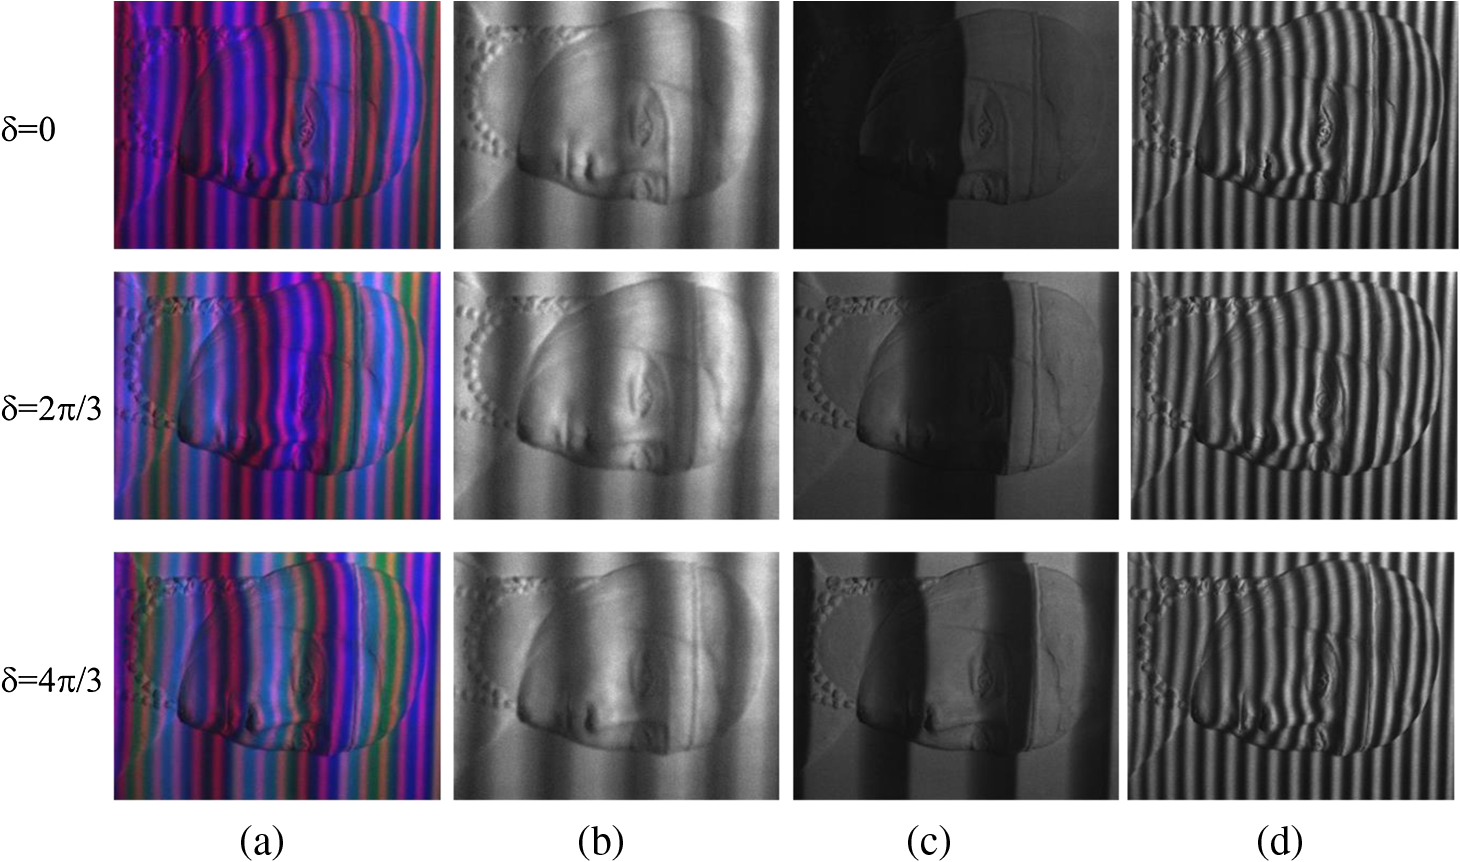 Figure 8 shows details of the gray code using the green channel. Panels (a) to (c) are binarized so that the bright area is “0” and the dark area is “1.” Panel (d) is an image encoded by the gray code listed in Table 1, whose scale ranges from to . An additional gray code “3” is required to determine the height information in the area indicated by the values , , and . One can interpolate the height information using the low-frequency sinusoidal patterns. Figures 9(a) and 9(b) show the wrapped phase distributions at low and high frequencies, respectively. Both distributions are discontinuous in steps of , but the low-frequency phase can be deduced using the gray code as shown in Fig. 8(d). The 3-D shape can then be precisely recovered from the high-frequency-wrapped phase distribution, as demonstrated in Fig. 10. Using a calibration and a phase-coordinate conversion, the phase distribution can be obtained in terms of coordinates.15 In Fig. 10, the 3-D shape is presented at three different angles. The height step measurement is performed using gray-code-structured patterns. This experiment yields that the measurement has the accuracy of 0.5 mm within . In addition, the measurement time is less than . When we precisely control the sinusoidal shape of fringe pattern, it is possible to measure 3-D shape with high accuracy as same as the above-mentioned P3D. This technique has the potential not only to achieve high-speed 3-D and height-step measurements, but also to capture textured images from the RGB channels. Fig. 8Gray code sequence for , (a) gray code “0,” (b) gray code “1,” (c) gray code “2,” and (d) encoding by gray codes.  Table 1Gray code.
4.ConclusionsWe have developed a 3-D shape measurement system using a multiwavelength spatiotemporal phase-shifting technique and demonstrated its performance and applications. The key technology is a digital device using a SMM for pattern projection rather than a DLP or LC. The system employs laser diodes with a red, green, and blue channel. Two different sinusoidal waves are applied to the red and blue laser diodes, whereas a rectangular wave is input to the green laser. The modulated fan beams are converted into periodic patterns, specifically two sinusoidal patterns and a binary pattern following a time-space transformation using a SMM. A commercial digital projector with a one-chip DMD cannot simultaneously project different color periodic patterns. The 3CCD camera used here can individually capture the images because RGB prisms can completely separate the composite into three color channels. Specifically, the present projection method can sequentially determine the phase distributions of the RGB channels. Three-dimensional shape measurements with height steps were performed using the combination of two different frequency fringe and gray code patterns. The experimental results indicate that the technique can measure the 3-D shapes of slowly moving objects, which is difficult to attain using the traditional phase-shifting technique of commercial DLP projectors. ReferencesHandbook of Optical Metrology, Principles and Applications, CRC Press, New York, NY
(2009). Google Scholar
K. Yamataniet al.,
“Three-dimensional surface profilometry using structured liquid crystal grating,”
Proc. SPIE, 3782 291
–297
(1999). http://dx.doi.org/10.1117/12.369195 PSISDG 0277-786X Google Scholar
P. S. HaungS. Zhang,
“Fast three-step phase shifting algorithm,”
Appl. Opt., 45
(21), 5086
–5091
(2006). http://dx.doi.org/10.1364/AO.45.005086 APOPAI 0003-6935 Google Scholar
T. YoshizawaT. WakayamaH. Takano,
“Applications of a MEMS scanner to profile measurement,”
Proc. SPIE, 6762 67620B1
(2007). http://dx.doi.org/10.1117/12.733048 PSISDG 0277-786X Google Scholar
M. Fujigakiet al.,
“High-speed height measurement by a light-source-stepping method using a linear LED array,”
Opt. Express, 21
(20), 23169
–23180
(2013). http://dx.doi.org/10.1364/OE.21.023169 OPEXFF 1094-4087 Google Scholar
G. Yanget al.,
“High-speed scanning stroboscopic fringe-pattern projection technology for three-dimensional shape precision measurement,”
Appl. Opt., 53
(2), 174
–183
(2014). http://dx.doi.org/10.1364/AO.53.000174 APOPAI 0003-6935 Google Scholar
B. Panet al.,
“Phase error analysis and compensation for non-sinusoidal waveforms in phase-shifting digital projection profilometry,”
Opt. Lett., 34
(4), 416
–418
(2009). http://dx.doi.org/10.1364/OL.34.000416 OPLEDP 0146-9592 Google Scholar
S. Zhang,
“Recent progresses on real-time 3-D shape measurement using digital fringe projection techniques,”
Opt. Laser Eng., 48
(2), 149
–158
(2010). http://dx.doi.org/10.1016/j.optlaseng.2009.03.008 OLENDN 0143-8166 Google Scholar
S. ZhangD. Van Der WeideJ. Oliver,
“Superfast phase-shifting method for 3-D shape measurement,”
Opt. Express, 18
(9), 9684
–9689
(2010). http://dx.doi.org/10.1364/OE.18.009684 OPEXFF 1094-4087 Google Scholar
Y. WangS. Zhang,
“Superfast multifrequency phase-shifting technique with optimal pulse width modulation,”
Opt. Express, 19
(6), 5149
–5155
(2011). http://dx.doi.org/10.1364/OE.19.005149 OPEXFF 1094-4087 Google Scholar
P. Ouet al.,
“Flexible real-time natural 2D color and 3D shape measurement,”
Opt. Express, 21
(14), 16736
–16741
(2013). http://dx.doi.org/10.1364/OE.21.016736 OPEXFF 1094-4087 Google Scholar
Y. Wanget al.,
“3D absolute shape measurement of live rabbit hearts with a superfast two-frequency phase-shifting technique,”
Opt. Express, 21
(14), 5822
–5832
(2013). http://dx.doi.org/10.1364/OE.21.005822 OPEXFF 1094-4087 Google Scholar
T. YoshizawaT. Wakayama,
“Compact camera system for 3D profile measurement,”
Proc. SPIE, 7513 751304
(2009). http://dx.doi.org/10.1117/12.838298 PSISDG 0277-786X Google Scholar
T. WakayamaT. Yoshizawa,
“A palm-top camera for 3D profilometry incorporating a MEMS scanner,”
Proc. SPIE, 7855 78550D
(2010). http://dx.doi.org/10.1117/12.870827 PSISDG 0277-786X Google Scholar
T. WakayamaT. Yoshizawa,
“Compact camera for three-dimensional profilometry incorporating a single MEMS mirror,”
Opt. Eng., 51
(1), 013601
(2012). http://dx.doi.org/10.1117/1.OE.51.1.013601 OPEGAR 0091-3286 Google Scholar
H. Aoki,
“Potable 3D shape measurement system “P3D” and its applications,”
O plus E, 36
(1), 32
–36
(2014). Google Scholar
P. S. HuangC. ZhangF. P. Chiang,
“High-speed 3-D shape measurement based on digital fringe projection,”
Opt. Eng., 42
(1), 163
–168
(2003). http://dx.doi.org/10.1117/1.1525272 OPEGAR 0091-3286 Google Scholar
J. PanP. S. HuangF. P. Chiang,
“Color-coded binary fringe projection technique for 3-D shape measurement,”
Opt. Eng., 44
(2), 023606
(2005). http://dx.doi.org/10.1117/1.1840973 OPEGAR 0091-3286 Google Scholar
Z. ZhangC. E. TowersD. P. Towers,
“Time efficient color fringe projection system for 3D shape and color using optimum 3-frequency selection,”
Opt. Express, 14
(14), 6444
–6455
(2006). http://dx.doi.org/10.1364/OE.14.006444 OPEXFF 1094-4087 Google Scholar
T. WakayamaT. Yoshizawa,
“Color pattern projection method for three-dimensional measurement,”
Proc. SPIE, 8133 81330A
(2011). http://dx.doi.org/10.1117/12.894183 PSISDG 0277-786X Google Scholar
BiographyToshitaka Wakayama received his BS, MS, and PhD in mechanical systems engineering from Tokyo University of Agriculture and Technology, Japan. From 2003 to 2005, he became a Fellow of Japan Society for the Promotion of Science (JSPS). He joined Saitama Medical University in 2006, and he is presently an associate professor from 2012. His current research interests are optical engineering, polarization sciences, and biomedical engineering. Toru Yoshizawa received his BS, MS, and DEng degrees in precision engineering from the University of Tokyo. He was a professor at Yamanashi University for 10 years, Tokyo University of Agriculture and Technology for 25 years, and Saitama Medical University for 6 years. He also worked for industrial companies and currently is serving as director of the nonprofit organization, 3D Associates. |