|
|
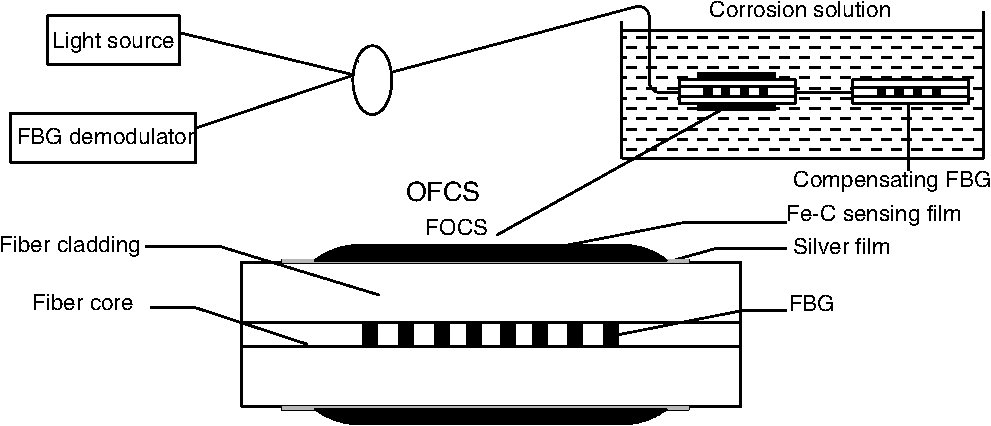
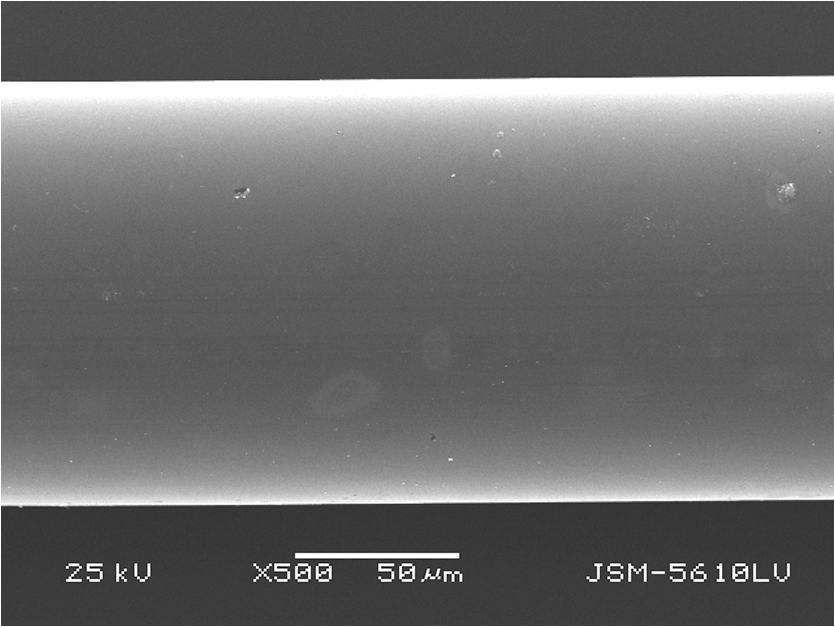
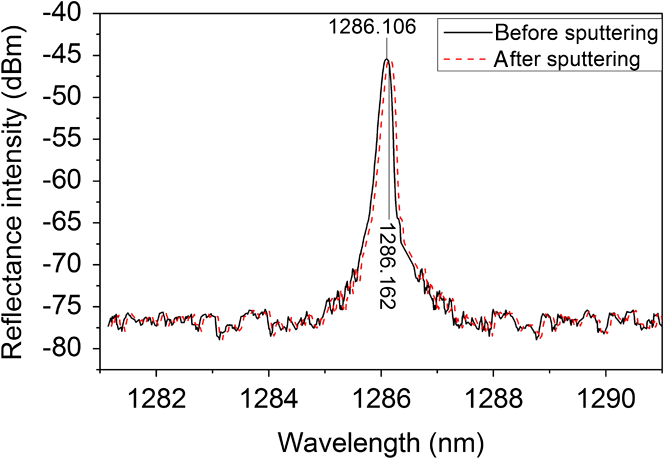
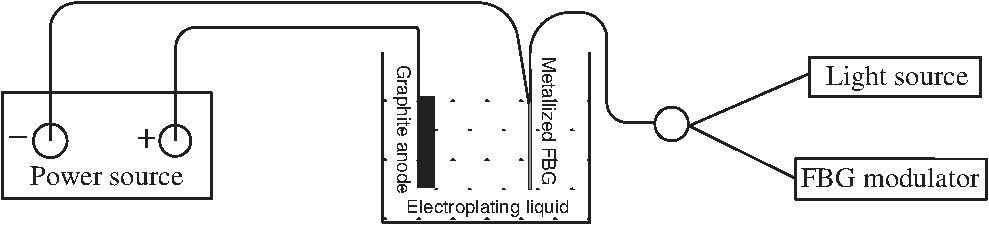
1.IntroductionSteel corrosion in concrete leads to cracking, reduction of bond strength, reduction of steel cross section, and loss of serviceability. Health degradation by corrosion of steel in civil engineering, especially in rough environments, is a persistent problem.1–3 Furthermore, environment pollution and global warming will exacerbate this problem. Structural health monitoring involves timely detection of corrosion. There are many traditional methods available in corrosion detection, such as open circuit potential measurement, surface potential measurement, linear polarization resistance measurement, etc.4,5 But these electrochemical techniques have many disadvantages, such as chemical interference, manipulating complex, inability to perform long-term and real-time monitoring, etc., which limit their application in the field. Optical fiber sensors have undergone rapid development due to their excellent characteristics such as small volume, high sensitivity, anti-electromagnetic interference, and being distributed or quasidistributed.6–8 A Fe-C film coated fiber Bragg grating (FBG) sensor is developed in this study. The longitudinal change of the sensing film induced by its rusting reaction causes the strain of FBG and consequently a Bragg central wavelength shift, which is detected with an FBG demodulator. The optical fiber corrosion sensor (OFCS) is light and micron-sized and can withstand harsh environments. Moreover, it can be easily embedded or surface mounted on concrete structures. 2.PrincipleAs we know, the key principle used in FBG-based sensors is monitoring the wavelength shift of Bragg grating due to the changes of the environment (e.g., strain, temperature). The Bragg wavelength can be given by the expression9 where is the Bragg wavelength, is the effective refractive index of the FBG, and is the grating period. Here, and are sensitive to strain, temperature, etc.Fe-C sensitive film has similar composition to carbon steel; the corrosion products are mainly iron hydroxide [], iron trihydroxide [], goethite (), akaganeite (), lepidocrocite (), feroxyhite (), hematite (), maghemite (), and ,10,11 which will increase the volume. The expansion of corrosion film results in the strain of grating period in FBG to change the central wavelength. A second FBG was used for compensating for the effect of temperature. By monitoring the shift of the light output from the fiber, the procession, rate, and degree of corrosion can be estimated. A schematic illustration of the OFCS is shown in Fig. 1. The optical fiber is a single-mode fiber (SMF) with a diameter of 125 μm, in which the core is 8 to 10 μm in diameter. FBGs are fabricated by inscribing periodic variation of the refractive index into the core of SMF using the phase mask technique with the length of 8 mm. A light-emitting diode was worked as the light source; its output power and wavelength are stable; and the central wavelength was measured by FBG demodulator (TGW-300D). 3.Experiment3.1.Metallization of Fiber by Magnetron SputteringA BESTECH Company (Berlin, Germany) sputtering system (ION’ X-3_902X) was used for the magnetron sputtering of a conductive layer silver film. It has a turbo pump and allows a basic vacuum pressure down to . Polyimide coating was removed on the section of FBG and ultrasonically cleaned in ethyl alcohol before sputtering. The pretreated optical fiber was located at a position with substrate-target 150 mm away. Meanwhile, a silicon piece with the dimensions of was used as monitoring sample in order to later characterize the deposited layer. Sputtering power for silver target was 100 W with a deposition rate about . The thickness of silver was monitored by quartz crystal method to be 130 nm. Comparatively, uniform TbDyFe film () was deposited using two-step reverse operation.12 The conducting Ag medium is in nanometer scale, and is approximately 200 times (Ag 130 nm, Fe-C 22.5 μm) thinner compared to the sensing film Fe-C; as a result, its coating is roughly uniform. A metalized fiber of silver single layer is showed in Fig. 2. The reflective spectra of FBG before and after sputtering were measured by optical spectrum analyzer (AQ6370B, Yokogawa). Figure 3 shows that the central wavelength increased 56 pm after sputtering. Residual stress in the film was produced from the process of deposition, and has a large impact on coating mechanical properties and durability. Shen et al.13 studied the relationship between residual stress and sputtering-gas pressure in magnetron sputtering, and concluded that high sputtering pressure about 60 mTorr completely relaxes the residual stresses. In this experiment, argon gas pressure was 5 mTorr and had residual stress with the wavelength shift of 56 pm. 3.2.Fe-C Film ElectroplatingElectroplating method was chosen to deposit the Fe-C sensitive film, shown in Fig. 4. The deposition area of metalized FBG had a length of 2 cm and a square of about . Graphite electrode was used as anode and a metalized fiber was cathode. The electroplating liquid and plating meters are shown in Table 1.14 The chemical reaction in cathode is Table 1Electroplating solution and parameters for Fe-C film.
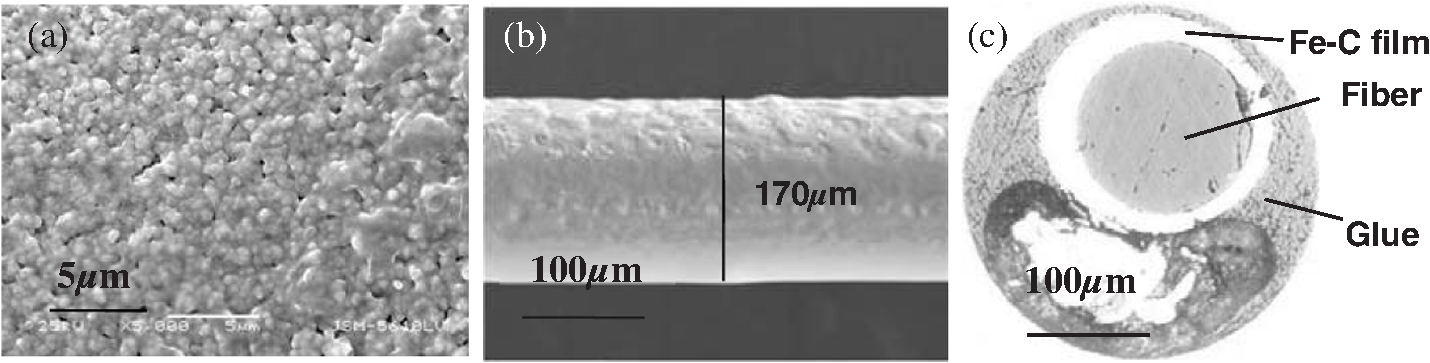
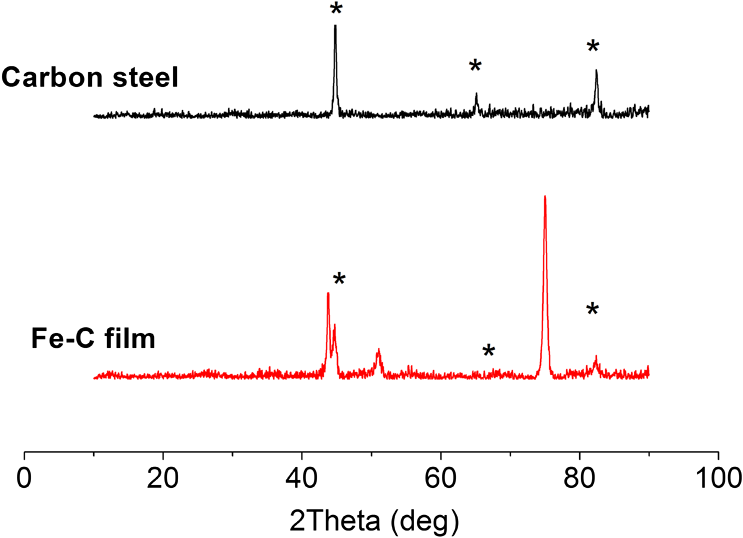
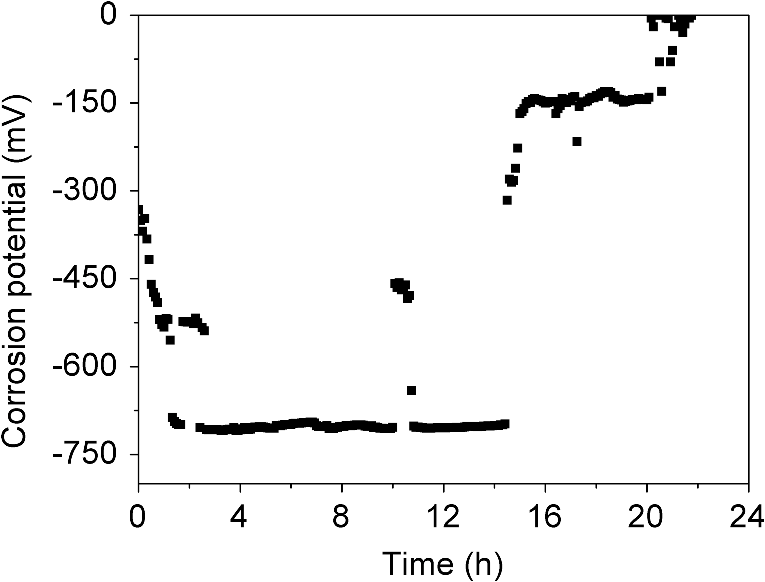
Parallel FBGs were prepared for analyzing the thickness of Fe-C film, which were investigated with an optical microscope (Model VHX-100 by Keyence). As is depicted in Fig. 5(a), at the beginning of plating thickness increased quickly, and then slowed down. According to Faraday’s law of electrolysis, the volume (or mass) of a Fe-C has a linear relationship with time in constant-current electroplating. Due to the cylindrical shape of FBG, the thickness has an exponential relationship with volume, the same with time. Nevertheless, the average deposition rate is approximately , and the electroplating time of the sensor used in this experiment is 40 cm. Fig. 5The graph of Fe-C film thickness coated on FBG (a) and central wavelength shift in the electroplating process (b). 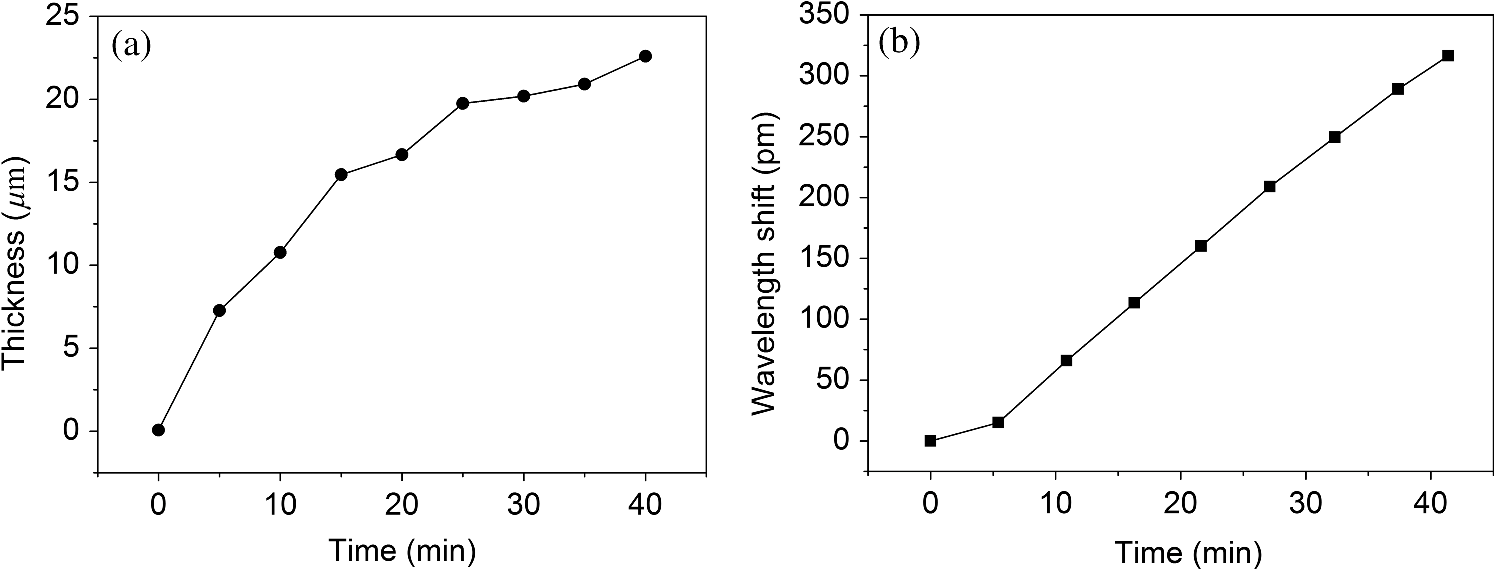 Figure 5(b) shows the wavelength shift in the electroplating process. The FBG shifts to longer wavelength with the increase of time. Compared to the magnetron sputtering, there is a higher wavelength shift in electroplating, which reflects higher residual stress in Fe-C than in Ag. Residual stress can be relaxed by annealing15,16 to avoid the cracks of film. However, appropriate stress may enhance the adherence between film and fiber. 4.Results and Discussion4.1.Morphology AnalysisThe surface morphology of Fe-C coated fiber was observed by scanning electron microscopy (SEM), JSM-5610LV from Japan electron optics laboratory Co., Ltd. (Tokyo, Japan.). Figure 6(a) shows the microphotography of Fe-C film. The particles have an average diameter of 300 nm, and they are evenly arranged. However, holes and pores are seen in the film. In the electroplating process, is the side reaction product at the cathode. Many papers discussed the effects of hydrogen on the properties of various metal deposits.17–19 Hydrogen bubbles are attached to the fiber in an absorbed state, which lead to growth pores as the deposit film around bubbles.20 Figure 6(b) displays the SEM image of Fe-C film coated fiber. It has a diameter of 170 μm, which shows the thickness of 22.5 μm. Generally, the film is even, compact, and without cracks, but there are few bump-like structures. As is depicted in Fig. 6(a), the microstructure of the film consists of some irregularly shaped and big size particles. The cross-section image of the Fe-C coated FBG is shown in Fig. 6(c). The ferrule was glued to the surface of the sensor with EPO-TEK 353ND to facilitate polishing of the cross section. The Fe-C film is not a standard circular shape. The thickness averages 22.5 μm, in which the maximum thickness is 30 μm, and the minimum one is 15 μm. As the metalized FBG is cylindrical, the distribution of electric field and current density in the cylindrical cathode is uneven,21 resulting in the uniformity of film thickness. 4.2.Composition and Structure AnalysisThe elemental analysis of Fe-C thin film and carbon steel was carried out by energy dispersive x-ray analysis (EDAX, FE-SEM S-4800, Hitachi, Japan). Energy dispersive x-ray (EDX) results (Fig. 7) show both Fe-C film and carbon steel, which have the same main elements of Fe and C, and the mass percentage of C is 4.28% and 1.47%, respectively. The Fe-C has higher content of carbon than carbon steel. Fig. 7Energy dispersive x-ray patterns of (a) Fe-C film coated on FBG and (b) carbon steel, which show the mass percentage of C is 4.28% and 1.47%, respectively. 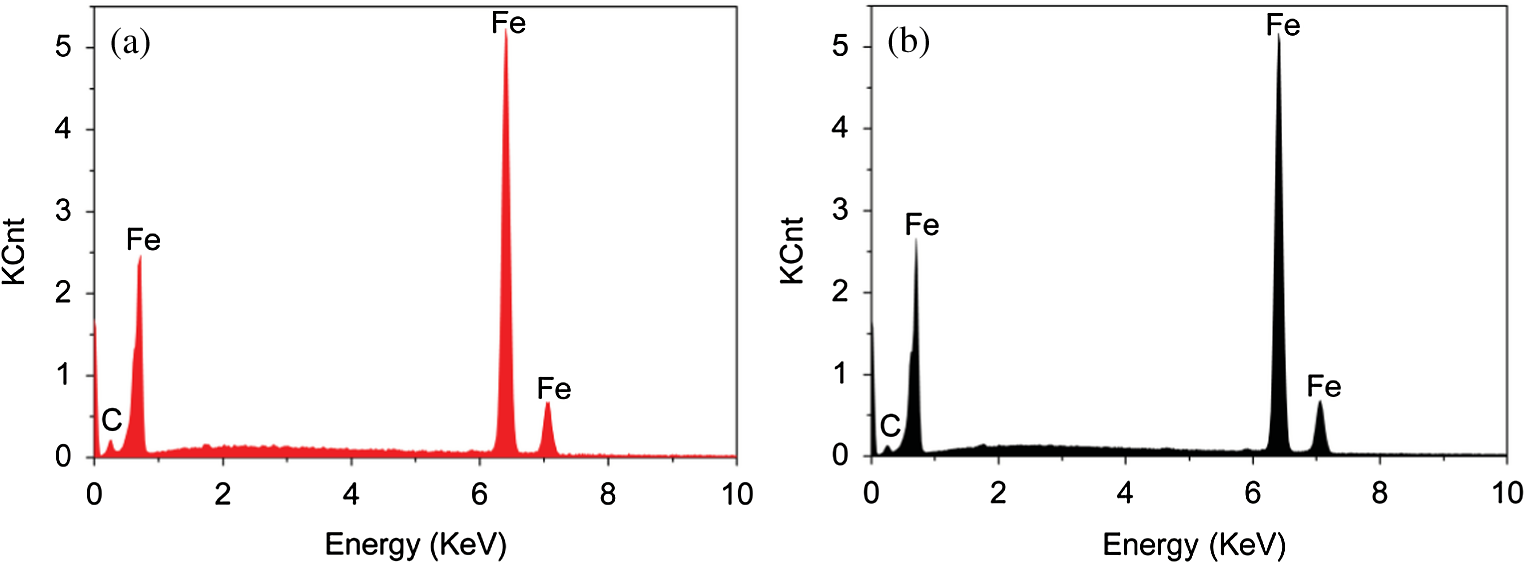 X-ray diffraction pattern was obtained on an x-ray diffractometer (XRD D8 Advance, Brucher, Germany) using Cu radiation source operating at 40 kV and 40 mA. The diffused peaks of carbon steel occurred at 44.673, 65.021, and 82.333 deg 2Theta values shown in Fig. 8, assigned to the cubic phase (1 1 0), (2 0 0), and (2 1 1) crystal planes (JCPDS 06-0696). The crystalline phases are , , and . Compared to carbon steel, Fe-C film peaks are at the similar Thetas, but the peaks become weakened; especially the peak of 65.021 deg hardly appears. The intensity of peak reflects the degree of crystallinity, so the Fe-C contains amorphous states. Moreover, the high content of C in Fe-C film changed the lattice size, resulting in the wide peaks at 44.673 and 82.333 deg. Through EDX and XRD analyses, it can be concluded that although the content of C in Fe-C is higher than in carbon steel, the crystalline phase still resembles that of carbon steel. Therefore, the corrosion of Fe-C coated on FBG can reflect the carbon steel situation, making it precisely monitor structure corrosion. 4.3.Corrosion MonitoringA corrosive solution of 3.5 wt.% NaCl was prepared for accelerated corrosion. The temperature of the solution constantly changed, and this caused the wavelength shift of FBG, leading to the reduction of the sensor’s accuracy. However, this adverse effect can be avoided by using a reference FBG.22,23 The reflected wavelength was collected with a TGW-300D FBG demodulator, which has a resolution of 1 pm (Fig. 9). Meanwhile, the Fe-C film corrosion potential was obtained by using Model 2000 Digital Multimeter (Fig. 10). Fig. 9Central wavelength shift of optical fiber corrosion sensor compensated for by temperature FBG in corrosive solution. 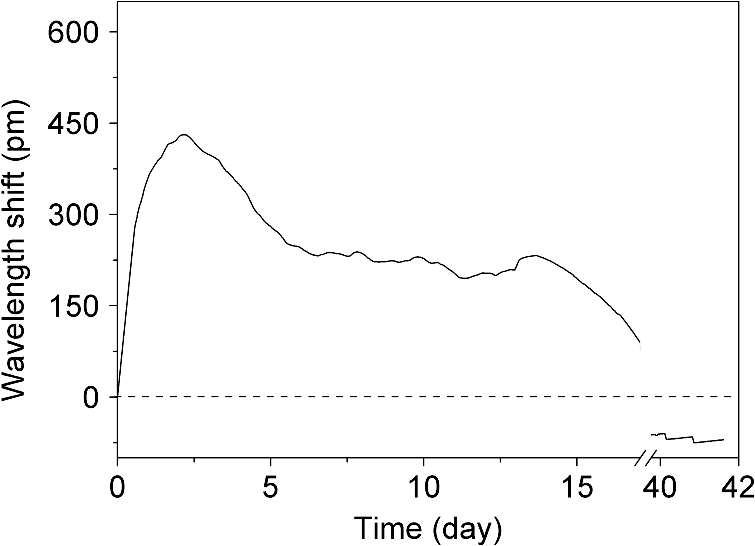 The optical fiber corrosion sensor was immersed in corrosive solution; oxygen, water, and chloride were the corrosion factors.24 Pitting corrosion first happened on the surface of Fe-C film; seen from the 1-h corrosion image [Fig. 11(a)], there were many granular products. Figure 9 shows the drift of FBG wavelength in time scale during the increase of corrosion. Since a pure FBG sensor was employed to compensate for the surrounding effect such as the temperature change, the drift of measured FBG wavelength can be solely regarded as the effect of Fe-C film expansion due to corrosion. Then the initial granular products connected and produced lumpy rust, leading to a higher wavelength shift. After corroding for 2.5 days, the rust totally replaced Fe-C film shown in Fig. 11(b), which corresponded to the highest volume expansion. The wavelength reached the maximum values about 430 picometer; this stage may be used as a critical signal for severe corrosion of the steel. As shown in Fig. 11(b), the rust has loose and porous structures; further, corrosion would lead to cracks and shedding of the coating film and consequently, the decrease of FBG wavelength after 2.5 days due to stress release. Figures 11(c) and 11(d) show the corrosion images of film with cracks and shedding at 10 and 40 days, respectively. The final wavelength shift is below zero, because of the release of prestress in Fe-C during electroplating [Fig. 5(b)]. Therefore, the correlation of corrosion level, volume expasion stress, and shift of FBG wavelength is maintained. Fig. 11SEM images of Fe-C film after being corroded for 1 h, 2.5 days, 10 days, and 40 days, respectively. 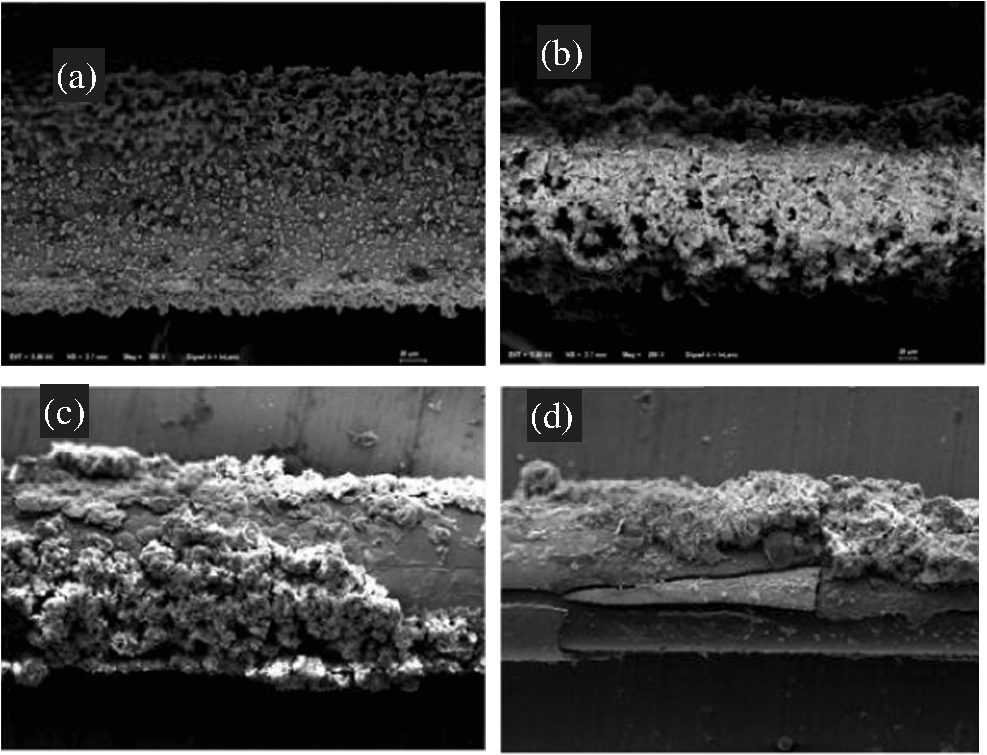 There are three stages in the optical monitoring of corrosion: initial phase, metaphase, and anaphase; the central wavelength performed an evolution of initial increasing, midterm decreasing, and final stabilizing, respectively (Fig. 9). In the initial phase, the slope of the curve was positively correlated with corrosion speed, while the value of wavelength shift corresponded to the corrosion level. Fe-C film was corroded greatly in metaphase and anaphase, decreasing the adherence to FBG and reducing the central wavelength, which were a critical signal for severe corrosion of the steel. Therefore, the corrosion speed, level, and time were monitored. Electrochemical monitoring was investigated for evaluating the precision of the fiber optical sensor (Fig. 10). The corrosion rate increased with an accompanying shift of the corrosion potential to a lower level. The potential drifted to lowest value of at time 2.6 to 14.4 h, as the corrosion was steady. In this period mainly occurred pitting corrosion, Fe-C film was intact. Afterward, cracks may reduce the conductivity of film, leading the potential signal to go back. After 20 h, corrosion potential was back to zero; the electric signal is completely missing. In the electric monitoring, only a few 20-h corrosion messages were obtained, much shorter than that by fiber optic corrosion sensor. 5.ConclusionThe fabrication of a novel OFCS based on Fe-C film was researched in this paper. The serious corrosion has the wavelength shift of 430 pm at 2.5 days. Compared to traditional electrochemical methods, OFCS has a good ability of long-term monitoring and obtaining the complete corrosive signal. Since Fe-C film has a similar structure to carbon steel, the sensor has the potential for the measurement and sensing of carbon steel corrosion monitoring. AcknowledgmentsThis work is supported by the Project of National Science Foundation of China (NSFC) (No. 51208398) and the Fundamental Research Funds for the Central Universities (WUT:2012-II-010). ReferencesM. F. MontemorA. M. P. SimõesM. G. S. Ferreira,
“Chloride-induced corrosion on reinforcing steel: from the fundamentals to the monitoring techniques,”
Cem. Concr. Compos., 25
(4–5), 491
–502
(2003). http://dx.doi.org/10.1016/S0958-9465(02)00089-6 CCOCEG 0958-9465 Google Scholar
M. Raupach,
“Chloride-induced macrocell corrosion of steel in concrete theoretical background and practical consequences,”
Constr. Build. Mater., 10
(5), 329
–338
(1996). http://dx.doi.org/10.1016/0950-0618(95)00018-6 CBUMEZ 0950-0618 Google Scholar
J. G. Cabrera,
“Deterioration of concrete due to reinforcement steel corrosion,”
Cem. Concr. Compos., 18
(1), 47
–59
(1996). http://dx.doi.org/10.1016/0958-9465(95)00043-7 CCOCEG 0958-9465 Google Scholar
S. Ahmad,
“Reinforcement corrosion in concrete structures, its monitoring and service life prediction—a review,”
Cem. Concr. Compos., 25
(4–5), 459
–471
(2003). http://dx.doi.org/10.1016/S0958-9465(02)00086-0 CCOCEG 0958-9465 Google Scholar
H. W. SongV. Saraswathy,
“Corrosion monitoring of reinforced concrete structures—a review,”
Int. J. Electrochem. Sci., 2
(1), 1
–28
(2007). IJESIV 1452-3981 Google Scholar
B. SutapunM. Tabib-AzarA. Kazemi,
“Pd-coated elastooptical fiber optic Bragg grating sensors for multiplexed hydrogen sensing,”
Sens. Actuators B, 60
(1), 27
–34
(1999). http://dx.doi.org/10.1016/S0925-4005(99)00240-3 SABCEB 0925-4005 Google Scholar
M. SedlarL. Pust,
“Preparation of cobalt doped nickel ferrite thin films on optical fibers by dip-coating technique,”
Ceram. Int., 21
(1), 21
–27
(1995). http://dx.doi.org/10.1016/0272-8842(95)93267-7 CINNDH 0272-8842 Google Scholar
W. B. Huet al.,
“Fe-C-coated fibre Bragg grating sensor for steel corrosion monitoring,”
Corros. Sci., 53
(5), 1933
–1938
(2011). http://dx.doi.org/10.1016/j.corsci.2011.02.012 CRRSAA 0010-938X Google Scholar
A. D. Kerseyet al.,
“Fiber grating sensors,”
J. Lightwave Technol., 15
(8), 1442
–1463
(1997). http://dx.doi.org/10.1109/50.618377 JLTEDG 0733-8724 Google Scholar
S. J. OhD. C. CookH. E. Townsend,
“Characterization of iron oxides commonly formed as corrosion products on steel,”
Hyperfine Interact., 112
(1–4), 59
–66
(1998). http://dx.doi.org/10.1023/A:1011076308501 HYINDN 0304-3843 Google Scholar
J. KassimT. BairdJ. R. Fryer,
“Electron microscope studies of iron corrosion products in water at room temperature,”
Corros. Sci., 22
(2), 147
–158
(1982). http://dx.doi.org/10.1016/0010-938X(82)90075-0 CRRSAA 0010-938X Google Scholar
Y. Daiet al.,
“Magnetic field sensor based on fiber Bragg grating with a spiral microgroove ablated by femtosecond laser,”
Opt. Express, 21
(14), 17386
–17391
(2013). http://dx.doi.org/10.1364/OE.21.017386 OPEXFF 1094-4087 Google Scholar
Y. G. Shenet al.,
“Residual stress, microstructure, and structure of tungsten thin films deposited by magnetron sputtering,”
J. Appl. Phys., 87
(1), 177
–187
(2000). http://dx.doi.org/10.1063/1.371841 JAPIAU 0021-8979 Google Scholar
X. M. Liet al.,
“Fiber optic corrosion sensor fabricated by electrochemical method,”
Proc. SPIE, 3330 126
–133
(1998). http://dx.doi.org/10.1117/12.316965 PSISDG 0277-786X Google Scholar
X. F. Chenet al.,
“Relaxation of residual stresses in SiC wafers by annealing,”
Rare Metals, 25
(6), 704
–708
(2006). http://dx.doi.org/10.1016/S1001-0521(07)60016-3 RARME8 1001-0521 Google Scholar
S. M. Naet al.,
“Residual stress change by thermal annealing in amorphous Sm-Fe-B thin films,”
J. Magn. Magn. Mater., 239
(1–3), 570
–572
(2002). http://dx.doi.org/10.1016/S0304-8853(01)00668-0 JMMMDC 0304-8853 Google Scholar
E. M. K. HillierM. J. Robinson,
“Hydrogen embrittlement of high strength steel electroplated with zinc–cobalt alloys,”
Corros. Sci., 46
(3), 715
–727
(2004). http://dx.doi.org/10.1016/S0010-938X(03)00180-X CRRSAA 0010-938X Google Scholar
M. A. V. DevanathanZ. StachurskiW. Beck,
“A technique for the evaluation of hydrogen embrittlement characteristics of electroplating baths,”
J. Electrochem. Soc., 110
(8), 886
–890
(1963). http://dx.doi.org/10.1149/1.2425894 JESOAN 0013-4651 Google Scholar
M. Monevet al.,
“Effect of brighteners on hydrogen evolution during zinc electroplating from zincate electrolytes,”
J. Appl. Electrochem., 28
(10), 1107
–1112
(1998). http://dx.doi.org/10.1023/A:1003443219874 JAELBJ 0021-891X Google Scholar
D. R. Gabe,
“The role of hydrogen in metal electrodeposition process,”
J. Appl. Electrochem., 27
(8), 908
–915
(1997). http://dx.doi.org/10.1023/A:1018497401365 JAELBJ 0021-891X Google Scholar
C. HiroseT. Masaki,
“A theory of electric field and charge density distributions inside a cylindrical hollow cathode,”
Appl. Spectrosc., 42
(5), 811
–815
(1988). http://dx.doi.org/10.1366/0003702884429157 APSPA4 0003-7028 Google Scholar
K. S. ChiangR. KanchetiV. Rastogi,
“Temperature-compensated fiber-Bragg-grating-based magnetostrictive sensor for dc and ac currents,”
Opt. Eng., 42
(7), 1906
–1909
(2003). http://dx.doi.org/10.1117/1.1576533 OPEGAR 0091-3286 Google Scholar
Y. S. Hsuet al.,
“Temperature compensation of optical fiber Bragg grating pressure sensor,”
Photonics Technol. Lett., 18
(7), 874
–876
(2006). http://dx.doi.org/10.1109/LPT.2006.871832 IPTLEL 1041-1135 Google Scholar
H. H. UhligD. N. TriadisM. Stern,
“Effect of oxygen, chlorides, and calcium ion on corrosion inhibition of iron by polyphosphates,”
J. Electrochem. Soc., 102
(2), 59
–66
(1955). http://dx.doi.org/10.1149/1.2429995 JESOAN 0013-4651 Google Scholar
BiographyXing Zheng is pursuing the master’s degree in materials science and engineering from Wuhan University of Technology. Wenbin Hu has worked at the National Engineering Laboratory for Fiber Optic Sensing Technology, Wuhan University of Technology, since 1998. Her research areas include steel corrosion monitoring and optical fiber linear detection system. |