|
|
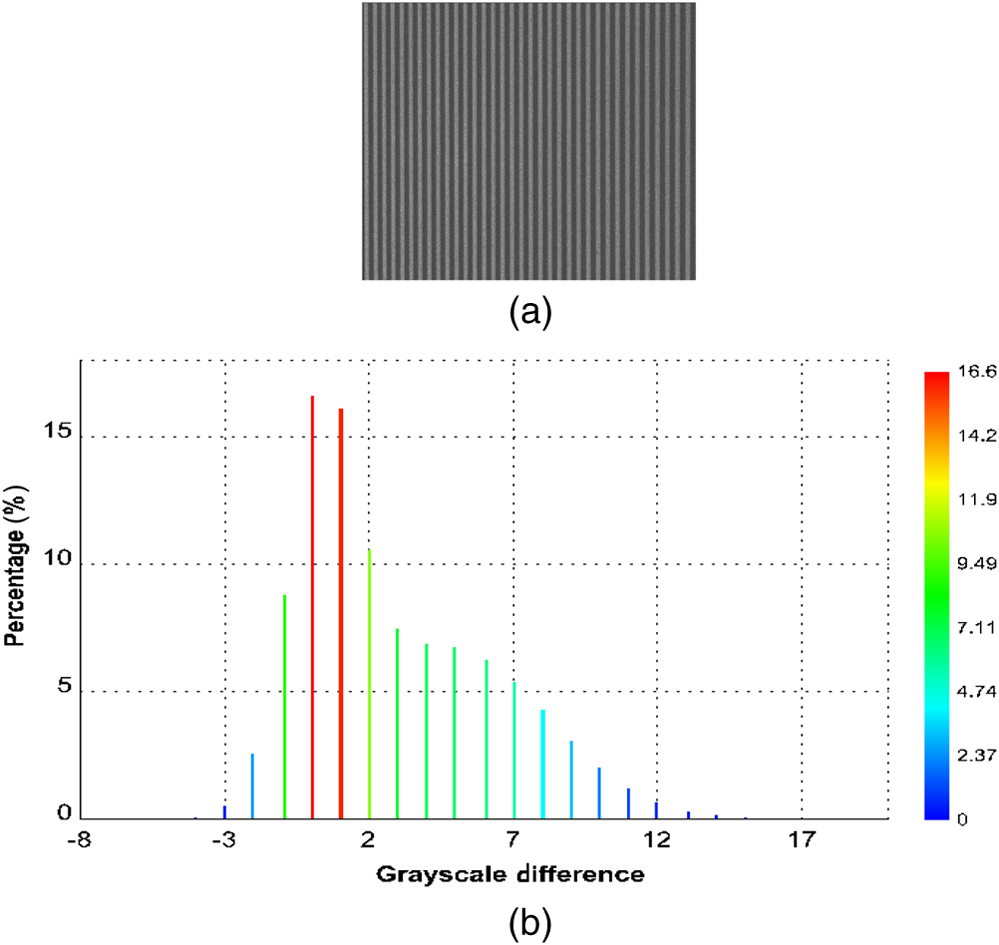
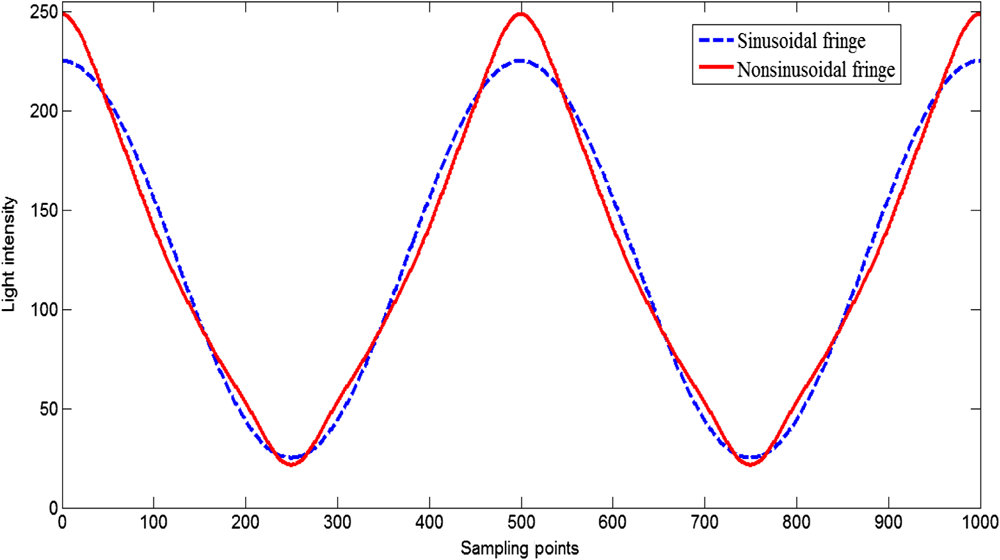
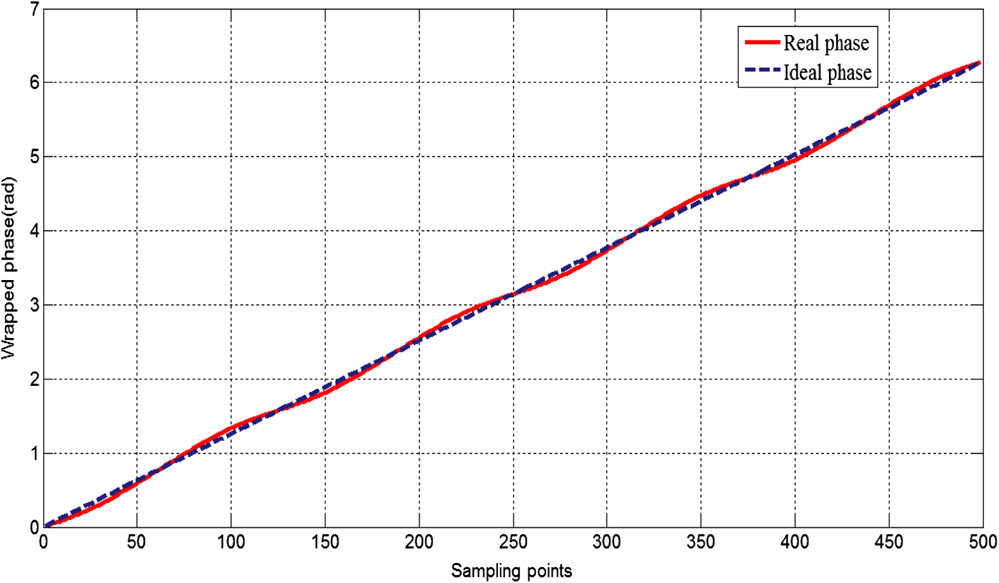
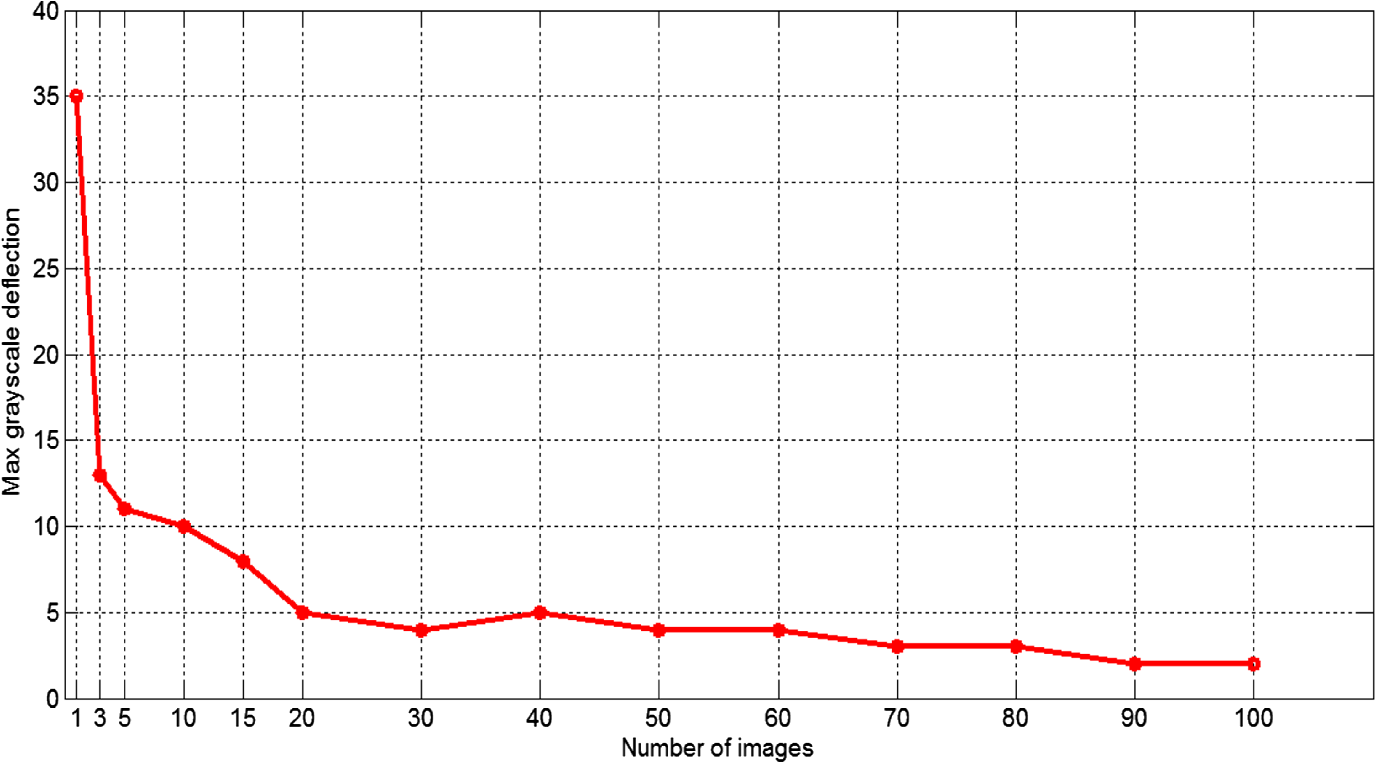
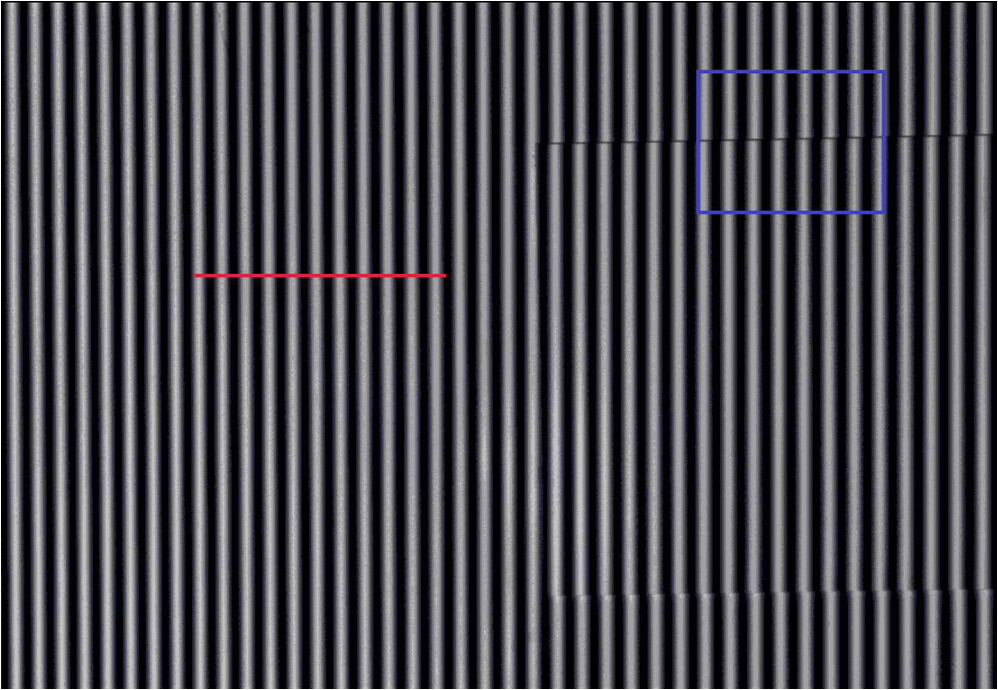
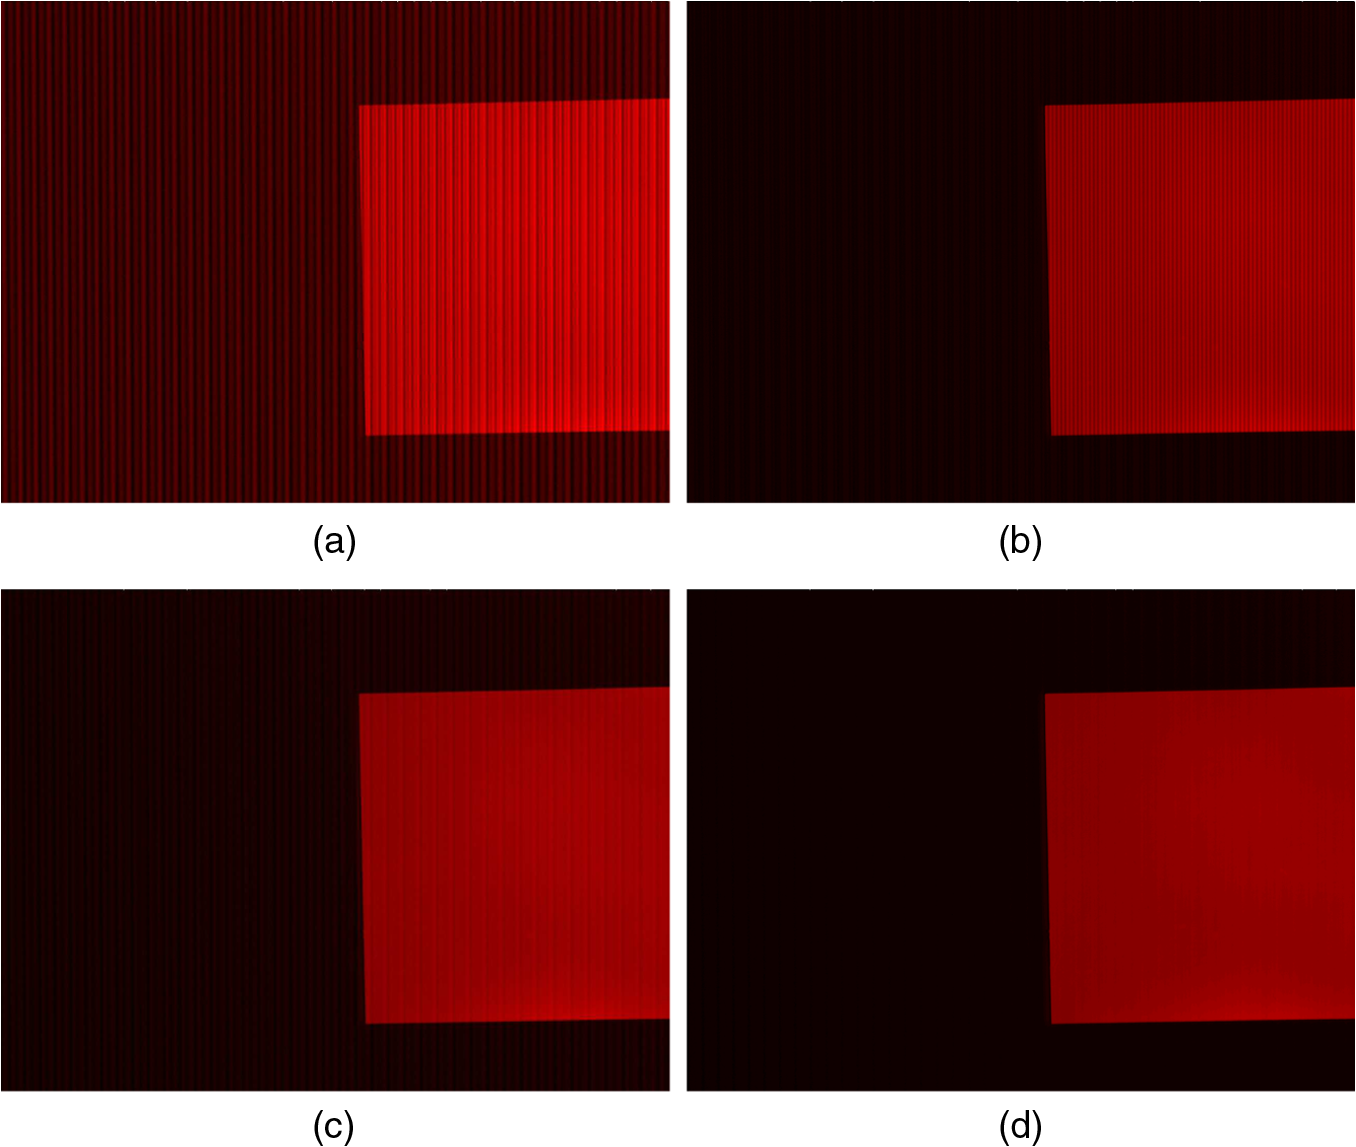
1.IntroductionFringe projection profilometry (FPP) using a digital video projector is one of the most common and effective techniques in fast three-dimesnional (3-D) shape measurement for its low cost, high reliability, high accuracy, and fast speed. It has been widely used in many fields, including biomedical applications,1 human body shape measurement,2 reverse engineering,3 and quality control.4 For phase-shifting methods, a series of sinusoidal fringe patterns generated by the computer are projected on to the object and captured by the camera. Then, the phase distribution that contains the object’s height information is calculated by analysis of the images. Thus, the object shape is reconstructed through phase unwrapping and system calibration.5 However, the commercial projector device used in an FPP system is manufactured to be nonlinear for a better visual effect. The nonlinearity of the projector deforms the ideal sinusoidal fringe patterns to be nonsinusoidal and introduces phase error. This phase error is one dominant error source of measurement because the phase-shift error does not exist because of the digital fringe pattern generation nature.6 For accurate measurement, this kind of phase error is not desirable. Recently, many research efforts have been focused on mitigating the nonsinusoidal phase error to obtain better measurement accuracy. Huang et al. proposed a double three-step phase-shifting algorithm and the error level has been reduced to less than half.7 Pan et al. presented an iterative method and simplified phase error to one order.8 Guo et al. have proposed a gamma-correction technique on the basis of statistical analysis of the fringe images. This technique allows one to estimate the value of gamma from the normalized cumulative histogram.9 However, their phase-error models are too simple to represent the actual gamma effect. Zhang and Yau utilized a look-up-table to alleviate the phase error.6 Liu et al. developed a method based on their model of the harmonic coefficients of the gamma value.10 The method works well for their purpose. However, it is time consuming to calibrate the gamma value. Besides of the gamma nonlinearity, system vibration and noise are nonnegligible. As the system vibration and noise exist, the captured images have a grayscale deflection from the true value and this will introduce a significant error to the result. In this paper, a method is proposed to reduce the phase error considering the system vibration, noise, and gamma nonlinearity. In this method, four-step phase-shifting is done four times with an initial phase offset of 22.5 deg and four phase maps are averaged to reduce the phase error introduced by the gamma nonlinearity. Every phase-shifting image is replaced by the average of multiple fringe images captured continuously at the same state to eliminate the phase error caused by system vibration and noise. Experimental results show that this method can effectively eliminate the measurement error. In Sec. 2 a detailed phase error analysis is performed. The proposed phase error elimination method is discussed in Sec. 3. Section 4 shows the experimental results, and the conclusions are given in Sec. 5. 2.Phase Error Analysis2.1.System Vibration and NoiseIn the phase-shifting method, a series of phase-shifted fringe images are used to calculate the phase. However, the grayscale of the captured images deviate from the true value because of the system vibration and noise. For example, if we capture two fringe images of one object with a time interval of 0.5 s. Due to system vibration and noise, these two images are not exactly the same. Figure 1(a) shows the grayscale difference between them and the histogram is plotted in Fig. 1(b) The maximum value of the grayscale difference is 20. It is obvious that both these two captured images could not represent the real situation. As a consequence, phase error will occur in the next phase-shifting calculation using these images. 2.2.Gamma NonlinearityTypically, the ideal intensity of a projected fringe pattern, regardless of the gamma nonlinearity, is expressed as where is the background intensity, is the intensity modulation, is the user defined phase for each pixel, is the fringe frequency, represents the phase-shift value, is the index, and is the number of phase-shifted patterns. Without considering gamma, the intensity of the captured image could be expressed asThe desired phase information can be solved according to Eq. (2) Then, the 3-D coordinates of the object can be derived through triangulation with the projector.11–13 If there exists gamma distortion in the FPP system, the intensity of the captured image will be nonsinusoidal, and the computation for will not be accurate using Eq. (3). Figures 2 and 3 show the simulation results. The intensity of the captured nonsinusoidal fringe pattern could be expressed as where the term is a modulation constant controlling the intensity range, is the gamma value for the projector-camera pair, is the phase-shift value, is the phase information, and and are the normalized average intensity and intensity modulation, respectively, which are related to the factors including reflectivity, uncertain ambient light, sensitive constant of the camera, and gamma value of the projector. Equation (4) can be rewritten as where is the ratio of the intensity modulation to average intensity. Subsequently, the binomial series is applied to Eq. (5) whether is an integer or not, so that it is expressed asAccording to the cosine power equations, Eq. (6) can be expressed as In addition, where is a non-negative integer.To accurately analyze the phase error, the harmonic waves up to the eighth-order are considered (), because the components of the harmonic waves higher than eighth-order are small enough and can be ignored. For the four-step phase-shifting method (), the phase error can be derived from Eq. (7) as14 where , , and . Writing the Taylor expansion of Eq. (10) around , , we obtainSince , , and can be ignored. Equation (11) is simplified as We note that the phase error is determined by the phase and the ratio . 3.Phase Error Elimination MethodBased on the analysis in Sec. 2, it is easily found that the phase error consists of two parts. One is the system vibration and noise, and the other is the gamma nonlinearity. These two factors are independent of each other. 3.1.For System Vibration and NoiseThe phase error introduced by the system vibration and noise can be reduced significantly by replacing every phase-shifting image of the average of multiple images captured continuously at the same state. Figure 4 shows the relationship between the max grayscale deflection (MGD) and the number of images (N) averaged. The max grayscale deflection tapers off with an increase in the of number of averaged images. When , the MGD is less than 5. That means that the average of 20 images is enough to represent the real situation. 3.2.For Gamma NonlinearityFrom the above phase error analysis in Sec. 2.2, we developed a novel algorithm for reducing the phase error introduced by gamma nonlinearity. From Eq. (12), we know that the phase error is determined by the phase and the parameter . If we introduce an initial phase offset into the phase-shifted fringe patterns, the phase error will vary correspondingly. If we introduce three phase maps with initial phase offsets of 22.5, 45, , the phase error becomes It is obvious that . Therefore, if we average the four phase maps, the phase error caused by gamma nonlinearity will disappear. 4.Experiments and DiscussionsOur employed three-dimensional profile measurement system is composed of a Vivitek-D5185HD projector (Taiwan) and Baumer-TXG12 camera (Frauenfeld, Switzerland). The resolution ratio of the projector is and the camera has a resolution of . To verify the effectiveness of the proposed method in reducing measurement errors, we measured a flat board pasted onto the wall. In our experiment, four-step phase-shifting is done four times with an initial phase offset of 225 deg. Table 1 shows the phase shift used each time. For each single phase-shifting fringe image, we continuously capture 20 images at the same state and average them. Figure 5 shows one of the captured fringe images and the result is shown in Fig. 6. Figure 6(a) shows the phase map using the general four-step phase-shifting algorithm. Figure 6(b) shows the phase map after compensation only for the system vibration and noise. Figure 6(c) is the phase map after compensation only for gamma nonlinearity. Figure 6(d) is the result considering both factors. The phase of a cross section (red line in Fig. 5) is shown in Fig. 7. Theoretically, the phase value of these pixels is supposed to be zero as there is no out-of-plane displacement here. Therefore, the phase value represents the phase error. Generally, we use the root-mean-square (RMS) value to evaluate the error. It can be seen that a serious phase error exists before any error elimination in Fig. 7(a). The RMS error is 0.0615 rad. As shown in Fig. 7(b), the RMS error reduces to 0.0121 rad after eliminating the phase error introduced by system vibration and noise. It is approximately five times smaller, which proves that the influence of system vibration and noise on phase error cannot be ignored. The RMS error reduces to 0.0183 rad, while the phase error caused by gamma nonlinearity is eliminated. When both the system vibration and noise and the gamma nonlinearity are considered, the RMS error decreases to 0.0043 rad, which is about 14 times smaller than the result using an ordinary phase-shifting algorithm. Table 2 compares the effectiveness of these four different algorithms. Figure 8 shows the 3-D shape of the blue rectangle area in Fig. 5. It is obvious that the surface of the flat plane is much smoother after phase error elimination. Table 1Phase shift in each time phase shifting.
Fig. 7Phase of a cross section: (a) before any elimination. (b), (c) and (d) after error elimination. 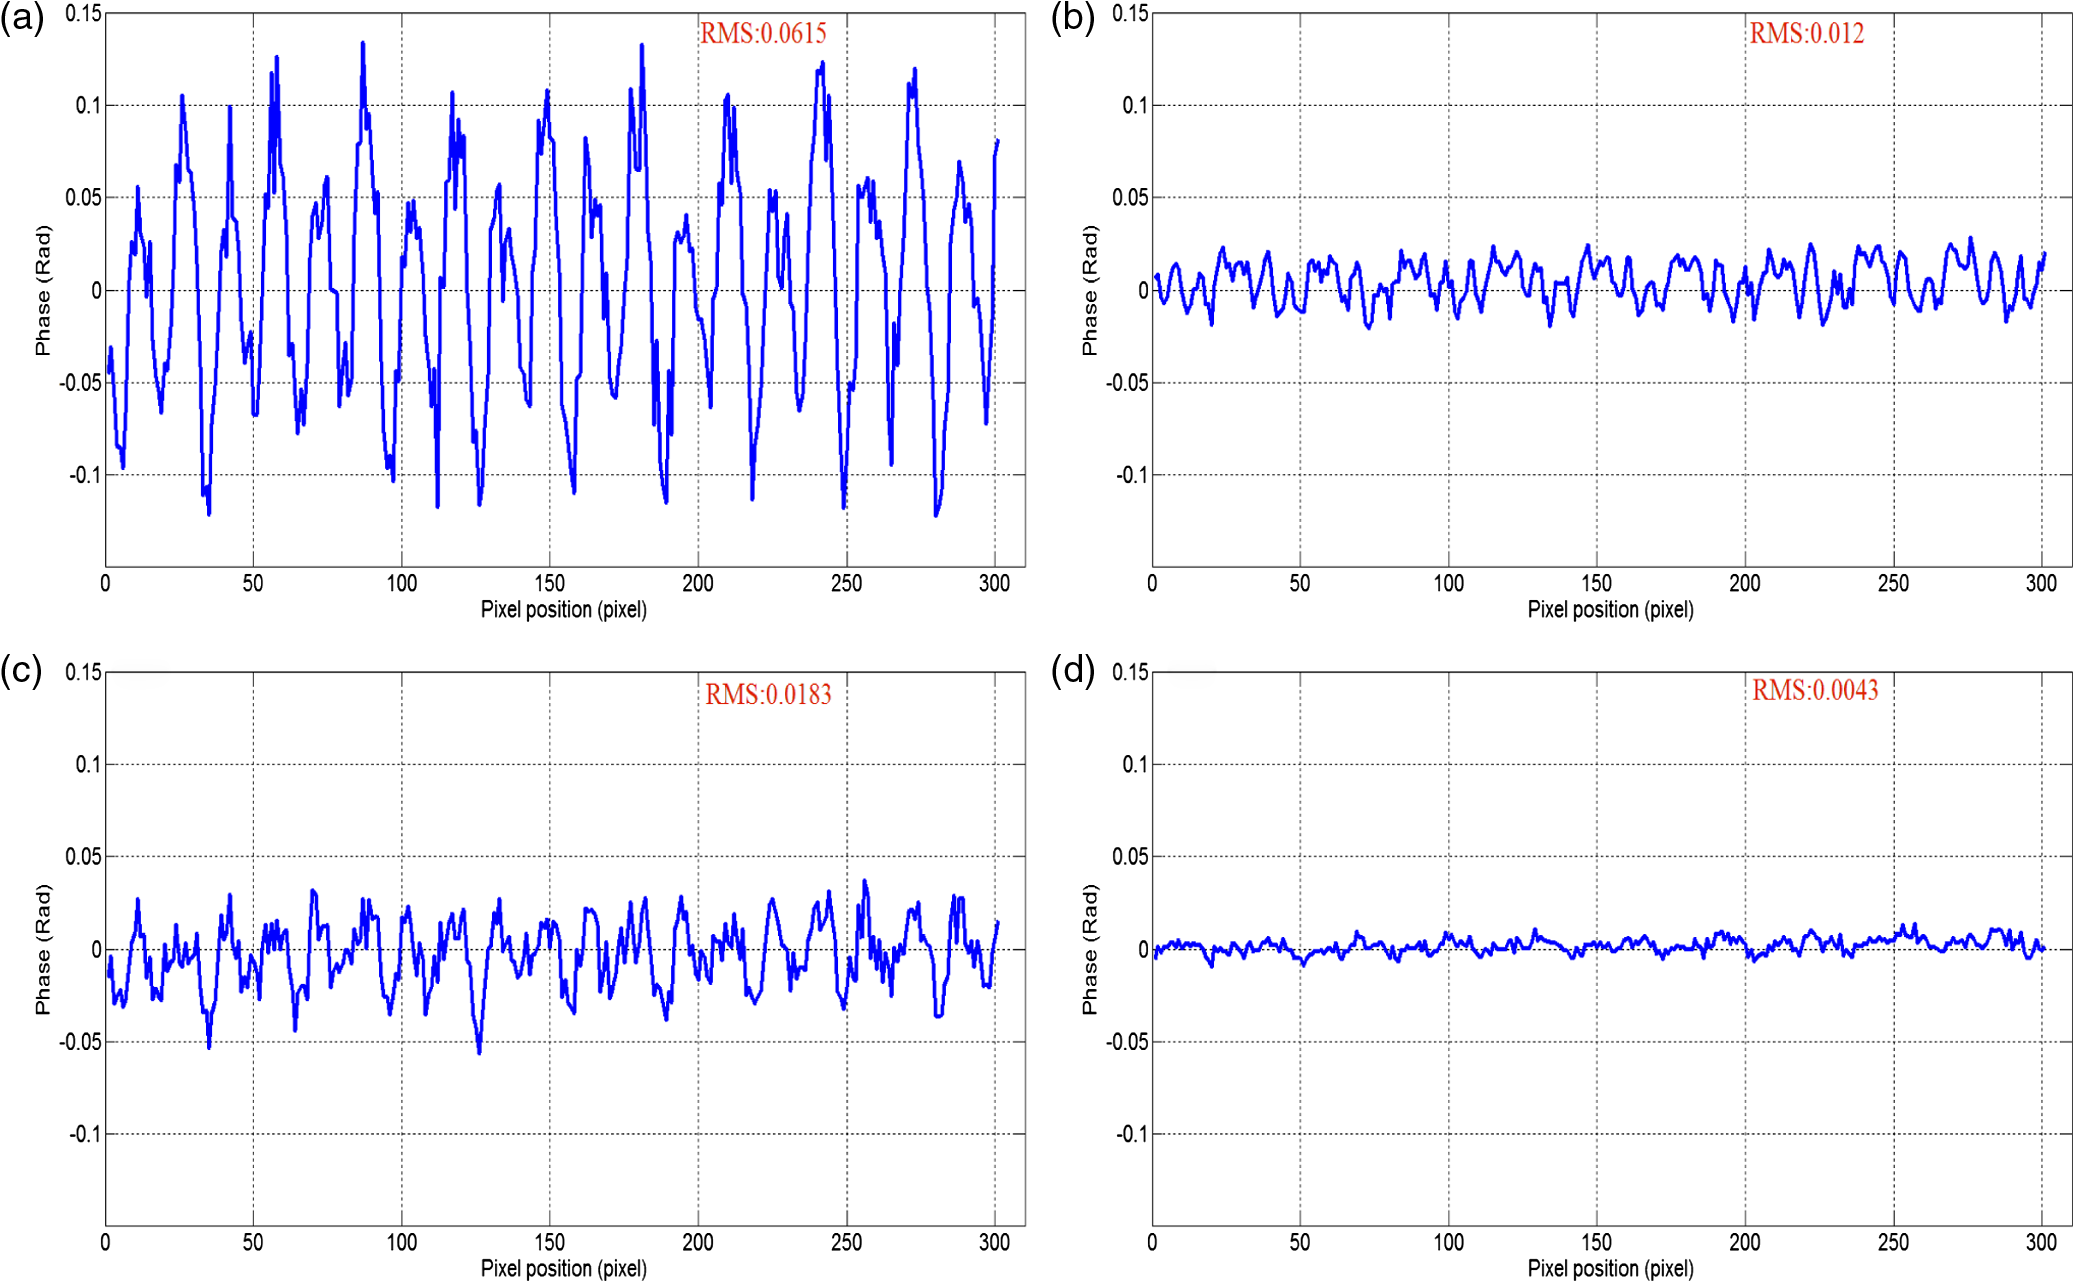 Table 2Phase error RMS value of four different algorithms.
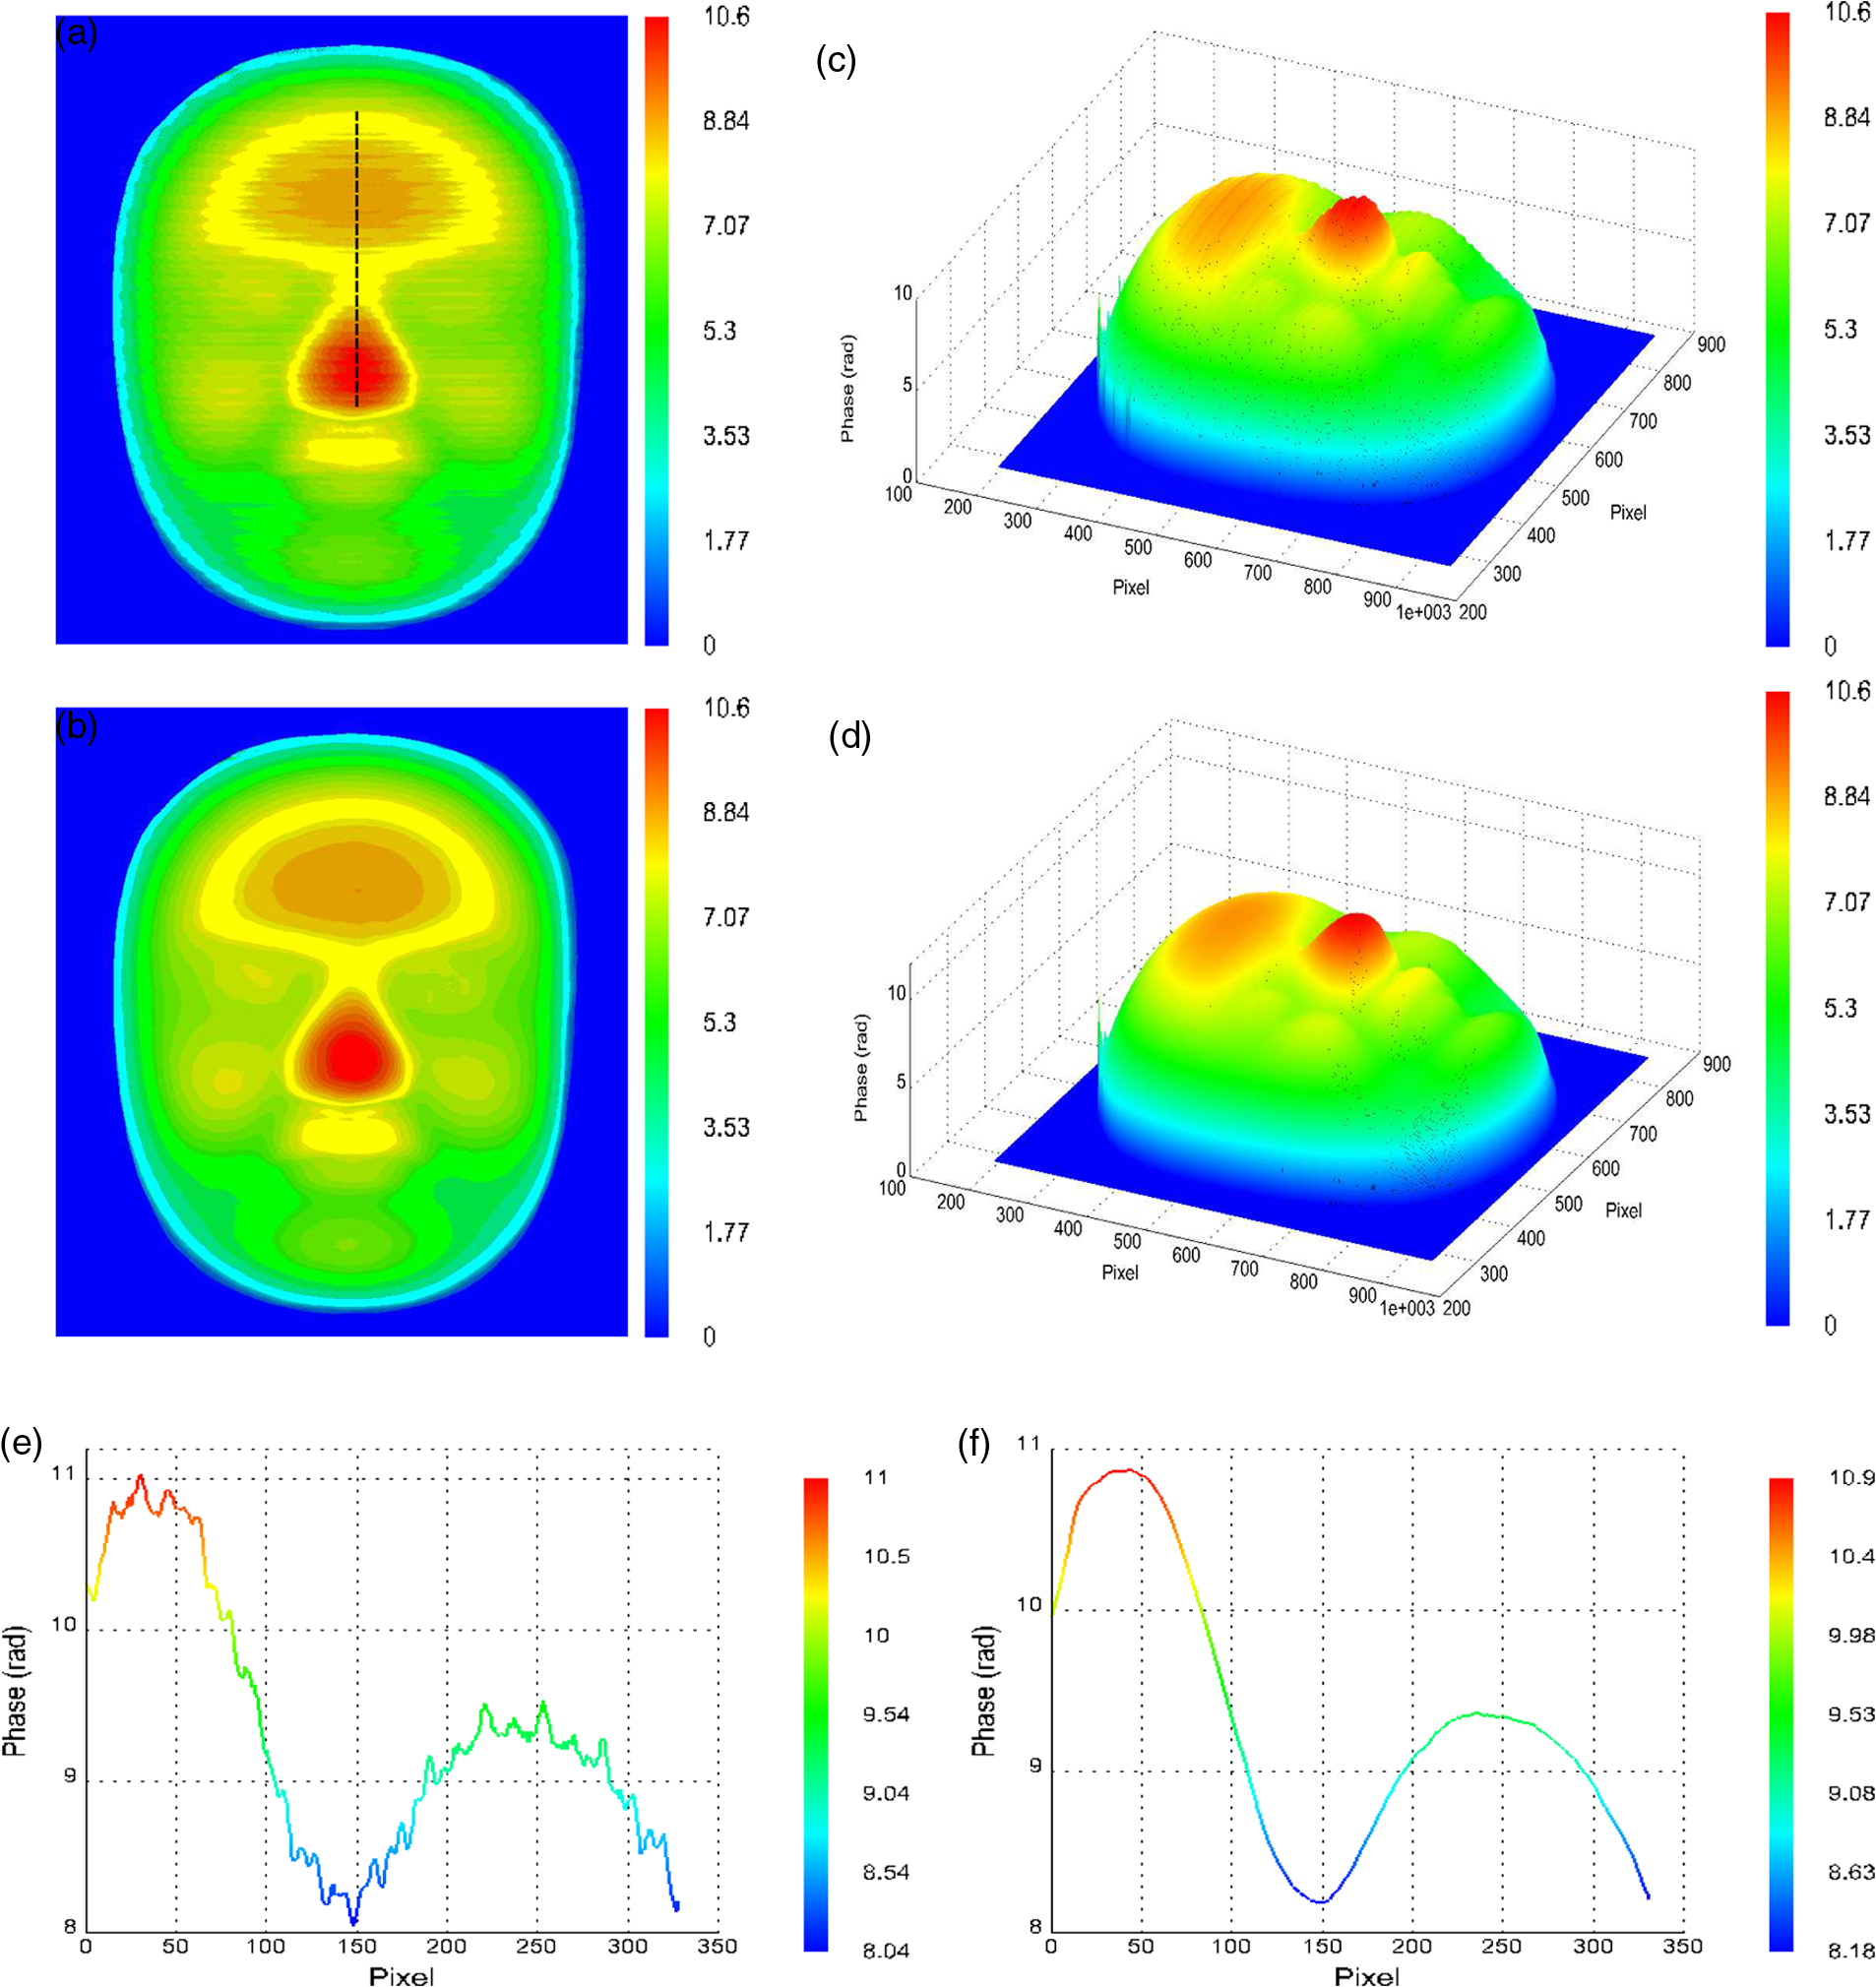
Fig. 8Three-dimensional (3-D) shape of the blue rectangle area in Fig. 5: (a) before any elimination. (b), (c), and (d) after error elimination. 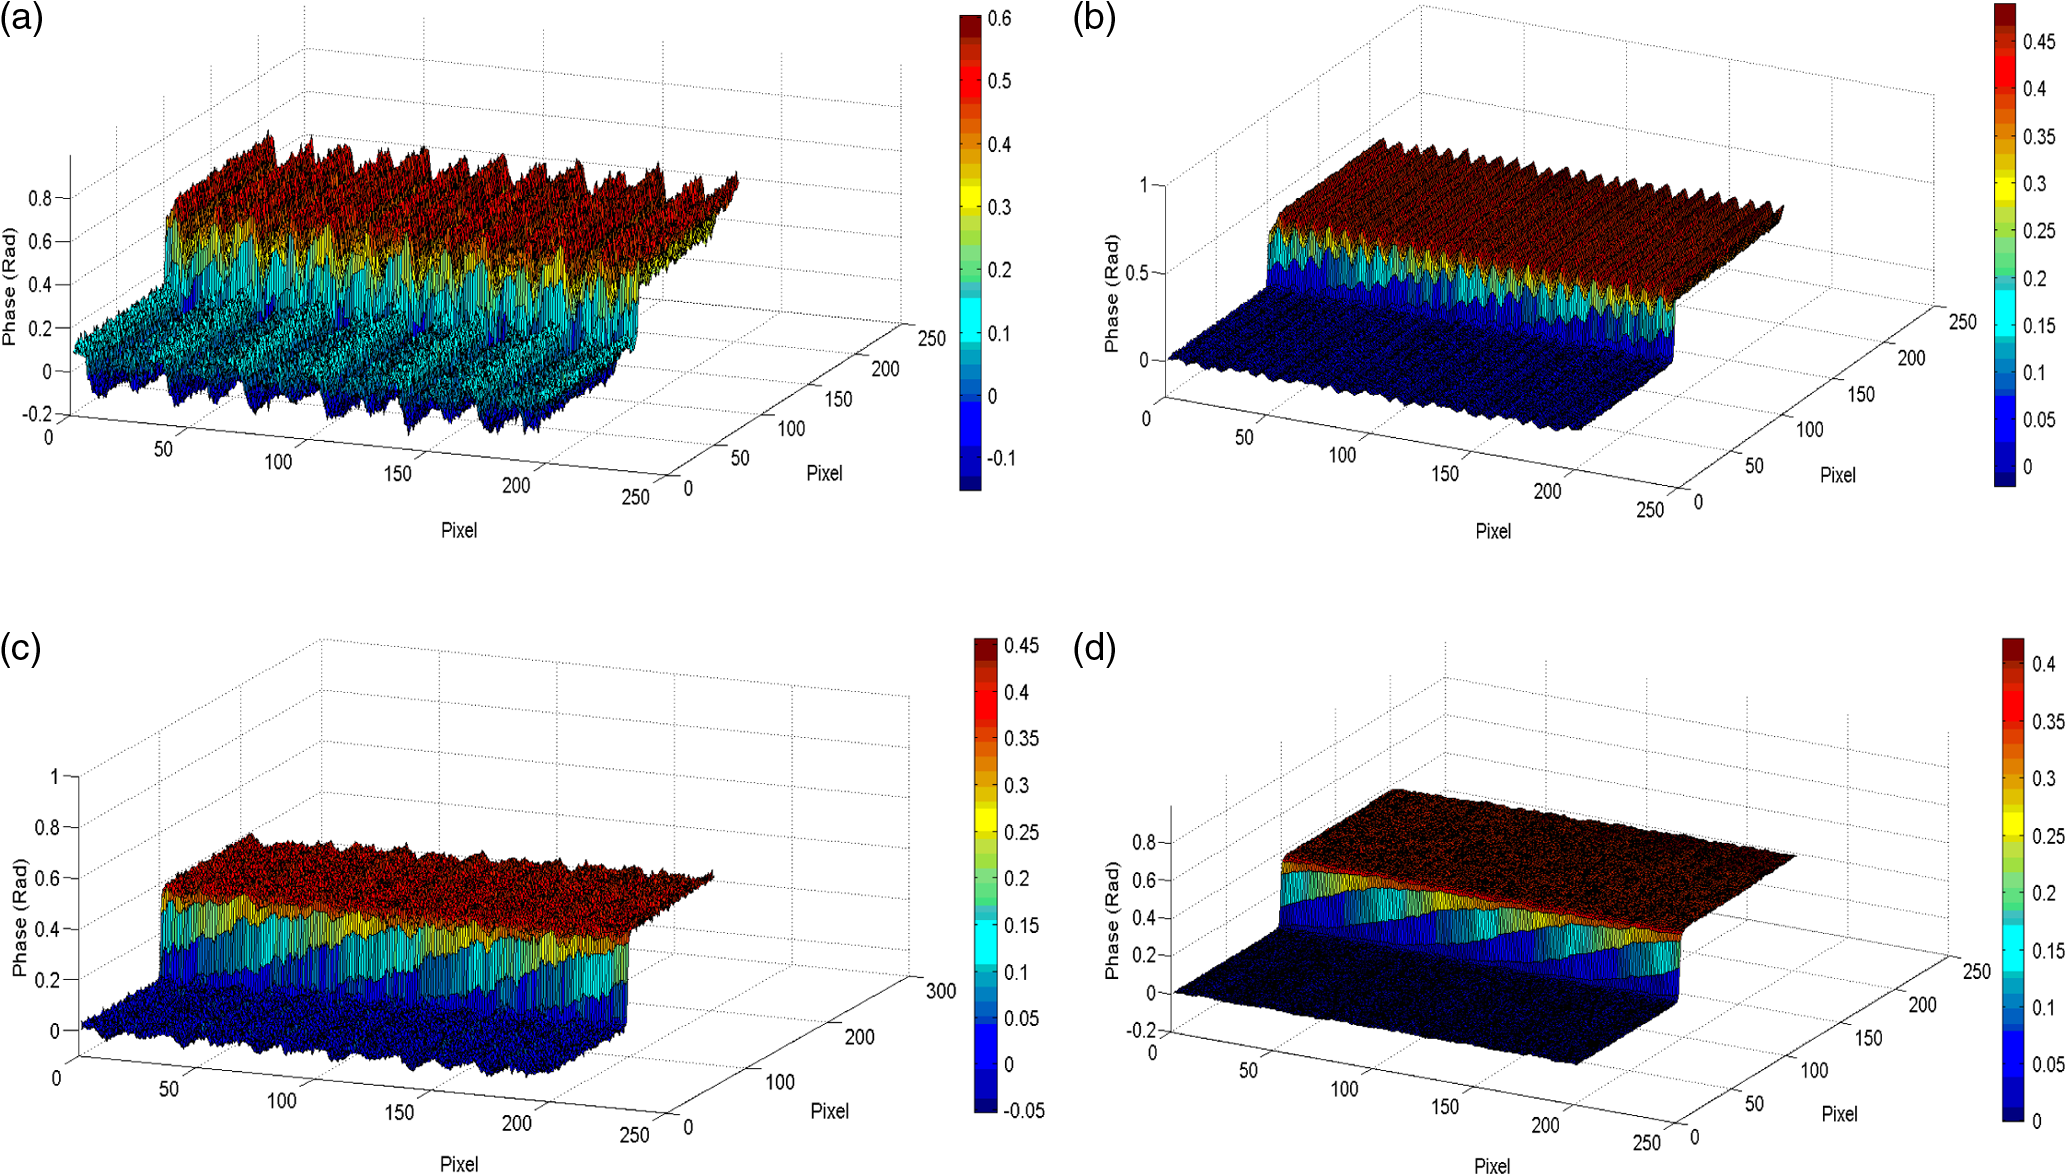 As a practical application of the proposed method, some more complex objects are measured, and one of the experimental results of a reconstructed face is shown in Fig. 9. Figure 9(a) gives the phase distribution of the object using an ordinary four-step phase-shifting algorithm. Figure 9(b) shows the phase distribution after phase error elimination using our proposed method. The 3-D shape maps of Figs. 9(a) and 9(b) are shown in Figs. 9(c) and 9(d). Figures 9(e) and 9(f) plot the data of one same cross section. It is obvious that the reconstructed face after phase error elimination is much smoother with well-retained details. The phase error elimination method proposed in this paper can effectively remove the periodical phase error due to gamma nonlinearity, system vibration, and noise and obtain a more accurate result with a better visual effect. 5.ConclusionsIn this paper, we analyze the influence of system vibration and noise and gamma nonlinearity on phase error. It is proven that system vibration and noise will introduce grayscale deflection in fringe images and result in a nonnegligible phase error. This error can be eliminated by using the average of multiple fringes images continuously captured at the same state. On the basis of theoretical analysis, we proposed a novel algorithm by doing the four-step phase-shifting four time to eliminate the phase error caused by gamma nonlinearity. The effectiveness of the proposed method has been demonstrated by the experimental results. The phase error can be reduced at least 90%. AcknowledgmentsThis research work is supported by National Natural Science Foundation of China, No. 11372182. ReferencesL.-C. ChenC.-C. Huang,
“Miniaturized 3D surface profilometer using digital fringe projection,”
Meas. Sci. Technol., 16
(5), 1061
–1062
(2005). http://dx.doi.org/10.1088/0957-0233/16/5/003 MSTCEP 0957-0233 Google Scholar
F. LilleyM. J. LalorD. R. Burton,
“Robust fringe analysis system for human body shape measurement,”
Opt. Eng., 39
(1), 187
–195
(2000). http://dx.doi.org/10.1117/1.602351 OPEGAR 0091-3286 Google Scholar
C.-h. Linet al.,
“Fringe projection measurement system in reverse engineering,”
J. Shanghai Univ., 9
(2), 153
–158
(2005). http://dx.doi.org/10.1007/s11741-005-0069-z JSUNFV 1007-6417 Google Scholar
H.-N. YenD.-M. TsaiJ.-Y. Yang,
“Full-field 3-D measurement of solder pastes using LCD-based phase shifting techniques,”
IEEE Trans. Electron. Packag. Manuf., 29
(1), 50
–57
(2006). http://dx.doi.org/10.1109/TEPM.2005.862632 ITEPFL 1521-334X Google Scholar
V. SrinivasanH. LiuM. Halioua,
“Automated phase-measuring profilometry of 3-D diffuse objects,”
Appl. Opt., 23
(18), 3105
–3108
(1984). http://dx.doi.org/10.1364/AO.23.003105 APOPAI 0003-6935 Google Scholar
S. ZhangS.-T. Yau,
“Generic nonsinusoidal phase error correction for three-dimensional shape measurement using a digital video projector,”
Appl. Opt., 46
(1), 36
–43
(2007). http://dx.doi.org/10.1364/AO.46.000036 APOPAI 0003-6935 Google Scholar
P. S. HuangQ. J. HuF.-P. Chiang,
“Double three-step phase-shifting algorithm,”
Appl. Opt., 41
(22), 4503
–4509
(2002). http://dx.doi.org/10.1364/AO.41.004503 APOPAI 0003-6935 Google Scholar
B. Panet al.,
“Phase error analysis and compensation for nonsinusoidal waveforms in phase-shifting digital fringe projection profilometry,”
Opt. Lett., 34
(4), 416
–418
(2009). http://dx.doi.org/10.1364/OL.34.000416 OPLEDP 0146-9592 Google Scholar
H. GuoH. HeM. Chen,
“Gamma correction for digital fringe projection profilometry,”
Appl. Opt., 43
(14), 2906
–2914
(2004). http://dx.doi.org/10.1364/AO.43.002906 APOPAI 0003-6935 Google Scholar
K. Liuet al.,
“Gamma model and its analysis for phase measuring profilometry,”
J. Opt. Soc. Am. A, 27
(3), 553
–562
(2010). http://dx.doi.org/10.1364/JOSAA.27.000553 JOAOD6 0740-3232 Google Scholar
J. LiL. G. HassebrookC. Guan,
“Optimized two-frequency phase-measuring-profilometry light-sensor temporal-noise sensitivity,”
J. Opt. Soc. Am. A, 20
(1), 106
–115
(2003). http://dx.doi.org/10.1364/JOSAA.20.000106 JOAOD6 0740-3232 Google Scholar
R. Legarda-Saet al.,
“Accurate procedure for the calibration of a structured light system,”
Opt. Eng., 43
(2), 464
–471
(2004). http://dx.doi.org/10.1117/1.1635373 OPEGAR 0091-3286 Google Scholar
S. ZhangP. S. Huang,
“Novel method for structured light system calibration,”
Opt. Eng., 45
(8), 083601
–083601
(2006). http://dx.doi.org/10.1117/1.2336196 OPEGAR 0091-3286 Google Scholar
P. Zhouet al.,
“Phase error analysis and compensation considering ambient light for phase measuring profilometry,”
Opt. Lasers Eng., 55
(13), 99
–104
(2014). http://dx.doi.org/10.1016/j.optlaseng.2013.10.027 OLENDN 0143-8166 Google Scholar
Biography |
||||||||||||||||||||||||||||||||||||||||