|
|
1.IntroductionThe near-infrared and mid-infrared wavelengths offer intrinsic advantages in remote sensing and Lidar operations. The overtone and fundamental rovibrational spectra of gas molecules are in this region, offering the opportunity to optically measure the concentration of trace gases. Unfortunately, sensitive infrared photodetectors in this region are limited and most of them have to be operated at cryogenic temperatures. By contrast, silicon avalanche photodiodes (Si APD) and single-photon counting modules can operate at room temperature with very high detection efficiencies. By using nonlinear frequency upconversion, the infrared radiation can be converted into visible/near-infrared signals and then detected by the sensitive silicon photodetectors. Lasers operating at a wavelength offer many measurement capabilities in remote sensing applications. The ground testing of a Doppler aerosol wind Lidar system has been demonstrated in its early years of development, and the first flight of the system was also demonstrated by measuring the wind speeds inside a hurricane in 2010.1 The wavelength of this laser also matches one absorption band of , which means this Lidar system can be used to monitor the concentration of in the atmosphere.2 Recently, air borne Lidar measurement of the concentration has been demonstrated by a pulsed integrated path differential absorption (IPDA) Lidar developed at the Remote Sensing Branch at NASA Langley Research Center (LaRC). The signal of an IPDA Lidar is inversely proportional to the square of the distance between the Lidar instrument and the Earth’s surface. In the vision to develop a space-borne Lidar to measure global concentration, the distance from the satellite to the surface of earth increases times comparing to that of an air-borne Lidar, resulting in an times weaker signal. It is impossible to increase the laser power up to this order and maintain the same signal to noise ratio. However, we can improve the signal detection performance to measure such a weak signal more efficiently. Currently, the detector in the Lidar system is a Hamamatsu long wavelength type InGaAs PIN detector with a high-noise equivalent power (noise current/photosensitivity) in the region. It is not comparable to the high detection efficiency and low dark current of the Si detector in the visible region. Our approach is to develop a periodically poled lithium niobate (PPLN) based frequency upconversion device to efficiently convert the infrared signals () into visible signals () with the sum frequency technique. Then the signal can be effectively detected by a high-efficiency Si detector. Table 1 shows the performance comparison of a photomultiplier tube (PMT), a Si single-photon avalanche diode (SPAD), and an InGaAs SPAD. The Si SPAD can be operated near room temperature and its figure of merit (ratio of the detection efficiency to the product of the dark count rate and the time resolution, ) is 200 times better than that of the InGaAs SPAD. The detection efficiency peak of the visible-near infrared PMT reaches 40% at , but quickly drops down to 15% at . Thus, the Si SPAD is the best choice for detection. Table 1The comparison of single-photon detectors.3
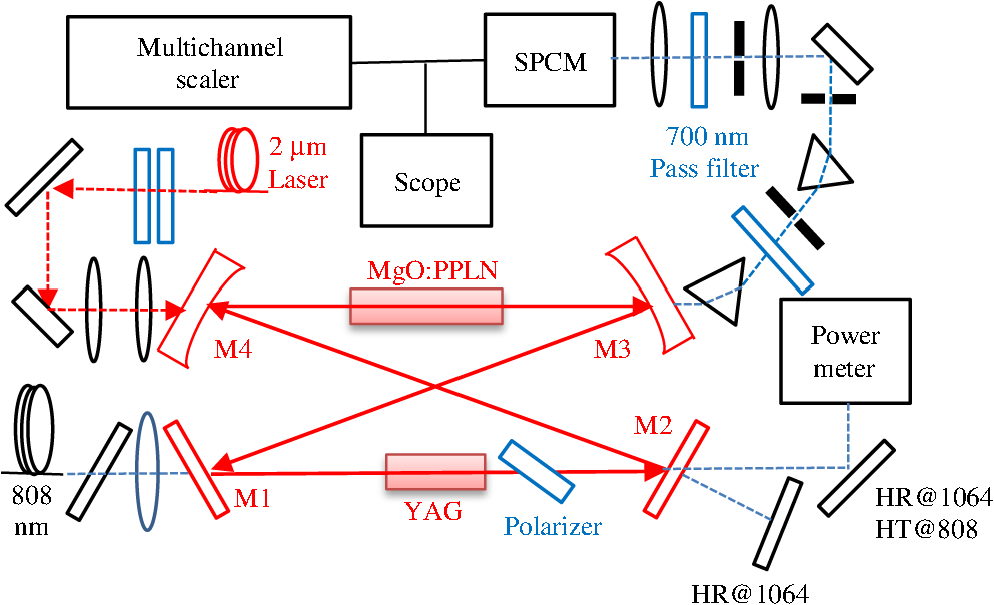
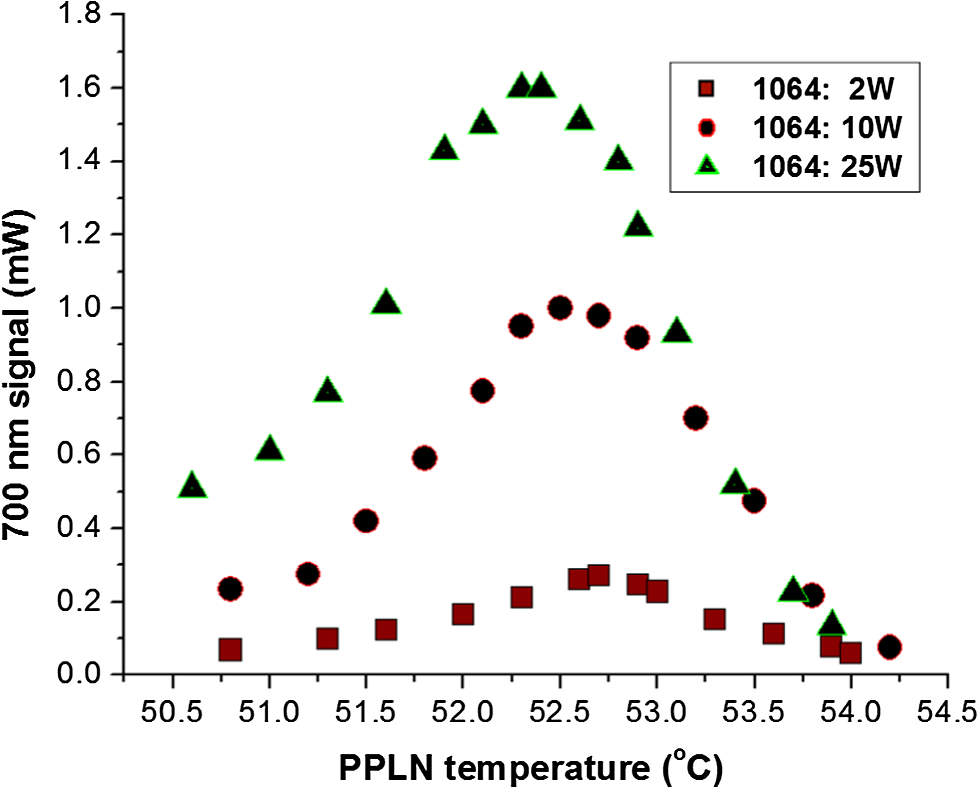
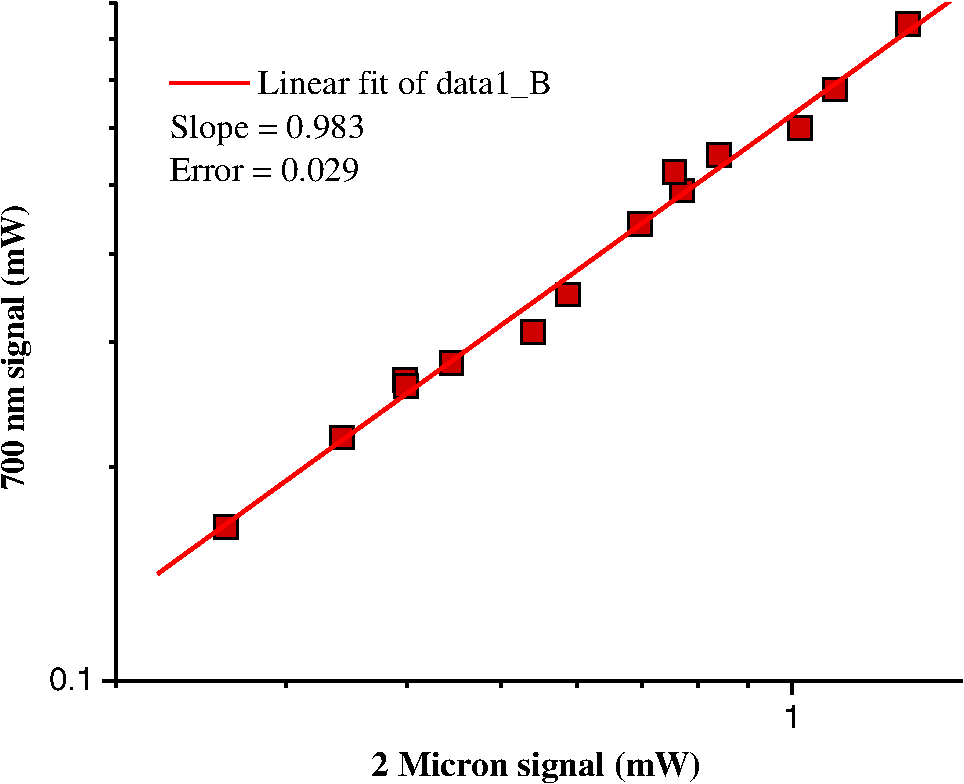
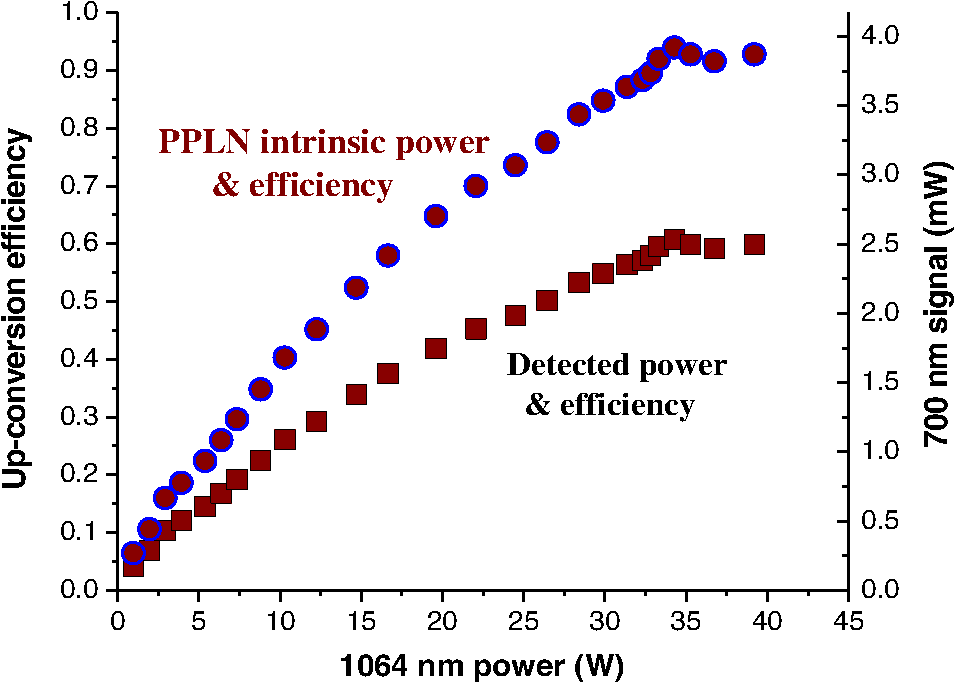
Lithium niobate () has piezoelectric, ferroelectric, electro-optic, and nonlinear optical properties; the ferroelectric property in particular makes it possible to flip the orientation of the electric dipole moment of the crystal within an electrical field applied region. Periodic reversal of the crystal domain structure produced by poling with the correct period can be used to achieve the quasiphase matching condition.4–7 This makes PPLN a highly efficient medium for nonlinear wavelength conversion processes. It has been demonstrated that PPLN can be used for frequency doubling, difference frequency generation, sum frequency generation, optical parametric oscillation, and other nonlinear processes.8–16 In these processes, photon energy and momentum must be conserved. The upconversion process uses the properties of sum frequency generation to combine two input photons at and to generate an output photon at with . For and , the one with the weaker power is called the probe laser and the one with higher power is called the pump laser. The refractive index inside an optical material is dependent on the frequency of light. Thus, the phase relation between two photons of different frequencies will vary as the photons propagate through the material unless the crystal is phase matched for those frequencies. For efficient nonlinear conversion, it is necessary to have a maintained phase relation between the input and generated photons throughout the whole crystal. By inverting the crystal electrical dipole orientation at the moment when photons are going to out of phase, PPLN can avoid the photons slipping out of phase with each other. As a result, the number of generated photons will increase as the light propagates through the PPLN and will reach a high conversion efficiency. This technique is called quasiphase matching. The sum frequency generation to convert a near-IR signal into the visible region can be achieved either by using a bulk PPLN chip or using a PPLN waveguide. Most previous work of upconversion has focused on converting of the communication wavelength into visible light. The upconversion efficiency in the near-IR region achieved 74% to 99%.11–13 Farther into the mid-IR region, the low transmission of the mid-IR inside PPLN and the blackbody radiation in the same spatial region cause low upconversion efficiency.14,15 In this paper, the upconversion of a probe beam with a pump laser into a signal was demonstrated at LaRC and 93% intrinsic conversion efficiency was achieved by using bulk PPLN. PPLN waveguides have a narrow channel along the grating of the PPLN; all the laser beams are confined in this channel over the whole length of the waveguide. The energy density in a waveguide will be much higher and more uniform than the bulk PPLN and the nonlinear mixing efficiency in the waveguide is also better than that of the bulk PPLN. Ideally, the upconversion efficiency can reach 100% in a waveguide PPLN. However, there are also limitations on the detection efficiency using a waveguide PPLN. Shentu et.al.16 studied the upconversion of by using a waveguide. The intrinsic upconversion efficiency was 99.6%, but the inefficient coupling lowered the detection efficiency to 10%. 2.Experimental SetupThe schematic of the experimental setup for intracavity upconversion is shown in Fig. 1. The cavity is composed of four mirrors, M1 to M4. M1 is a flat mirror with an anti-reflection coating at on both surfaces and a high-reflection coating at on the inner surface. M2 is a 98% reflection output coupler for . M3 and M4 are concave mirrors, each with a radius-of-curvature of 150 mm, a high-reflection coating at and a high-transmission coating at 0.7 and on both sides. One periodically poled 5 mol% MgO-doped congruent crystal purchased from HC Photonics Corp. (Hsinchu City, Taiwan) was used in this study. It consists of eight gratings with grating periods ranging from up to ; most of data are taken from the grating. This 50-mm long PPLN crystal is located inside a Teflon oven, which is mounted on top of a , , tilt, and rotation multiaxis stage. A continuous-wave (CW) Coherent FAP diode laser is used to pump a 10-mm long 1% doped Nd:YAG rod in the cavity to generate the 1064-nm beam. The intracavity pumping design significantly increases the system efficiency. One mirror (the same as M1) is mounted between the diode laser and the collimating lens at the opposite angle from M1 for astigmatism correction. A fused silica plate is inserted between M1 and M2 at the Brewster angle to adjust the polarization of the intracavity beam. One 1064 nm HR mirror is mounted at the back of the M2 mirror to reflect the beam back into the cavity to block one circulation direction. The light travels unidirectionally inside the resonator and from left to right through the PPLN. The leakage of light through M2 was used to monitor the circulating pump power with a coherent field master power meter. The mirrors M3 and M4 serve as the output (input) for the () laser. A DFB laser from EM4, Inc. (Bedford, Massachusetts) was also aligned through PPLN and the power was measured at the back of the M4 mirror using a Thorlabs (Newton, New Jersey) power meter equipped with a S302S sensor. Two lenses, both with a 150-mm focus length, were used to focus the probe laser beam into the cavity. 3.Results and DiscussionsWhen the power of the laser is in the mW range, the generated signal will also be in the same range. It can easily be detected by a power meter. To measure this 700 nm signal, a dispersion prism was used to separate the light from the other wavelengths (1.064, 0.532, 0.808 and ) and was measured with a Newport 818-SI (Irvine, California) power meter at the back of the first aperture. A laser line filter () was mounted in front of the detector to avoid any other light getting into the detector. The signal of 0.53 came from the second harmonic generation (SHG) of the strong intracavity laser beam in the PPLN. Even though the grating spacing on PPLN is far away from the SHG optimization grating period, a 0.75% of SHG efficiency was observed in front of the second prism but was not measurable after the second filter. The solitary function of the laser is to pump the YAG crystal to generate a laser beam in the cavity; it is supposed to leak out through M2, but the weak reflection at each mirror still lets part of the signal (0.146 fW) leak through and can only be detected by single-photon counting module. The temperature dependence of the upconversion (Fig. 2) was measured at a fixed signal. The shifting of the peak of the temperature tuning curves from 52.7°C at low pump power to 52.4°C at high power indicates some extra heating inside the PPLN at the high-pump laser power. The optical absorption coefficient of 5 mol% MgO-doped is at , so 2% of the pump laser energy might be turned into heat inside the 50 mm PPLN. The thermal capacity of lithium niboate is . There will be 0.6 W power absorbed by the PPLN at a 30 W pump laser power, which will increase the whole PPLN temperature by 0.36 deg. This number agrees with the experimental result of 0.4 deg. All eight gratings on the PPLN chip were examined under the same conditions. The channel with the spacing gave the best results, which are close to the calculated ideal spacing at this temperature. The measured temperature bandwidth is only 1.63°C as can be seen in Fig. 2. The power dependence of the signal on upconverting the signal was studied at constant 25 W pump laser power. The result is plotted on a log–log graph and is shown in Fig. 3. By power laws, the slope of the plot in the log–log graph should be close to 1 for linear dependence. The progression analysis shows with a coefficient of determination equal to 0.990 by the least square linear fitting. The slope of the fitting 0.983 indicates that the signal strength is linearly dependent on the laser power. Figure 4 shows the results of pump power dependance and the upconversion efficiency for a fixed signal at 1.308 mW. The temperature setting of the PPLN was 52.3°C. The solid squares on the graph are the overall system detection efficiency, and the solid circles are the data after correction of the system transmission. The signal loss comes from the reflection from the coating on the M4 mirror and absorption in the prism and band pass filter. The intrinsic upconversion efficiency of PPLN can be as high as 93% when the pump laser power is over 34 W. The overall detection efficiency is 60%. When the laser was attenuated to the pico watt level or even lower, then the signal was too weak to be measured by the power meter. A single-photon counting module (SPCM) AQRH-14 from Excelitas (Waltham, Massachusetts) was used to detect this weak signal in the single-photon counting region, and the output of the SPCM was sent to a Stanford Research Systems SR430-multichannel scaler/average for data acquisition and processing. The overall detection efficiency is the ratio of the photon counting rate at to the photon counting rate of the probe laser. In this upconversion case, that is the photon counting rate of divided by the photon counting rate of . Due to the losses through the optics of the prism, optical filter, and mirrors that the signal photons experienced on the way to the detector, and with the limited quantum efficiency of the detector, the signal photon rate detected by the detector will be weaker than the signal photon rate generated by the nonlinear crystal. The intrinsic upconversion efficiency can be calculated from the overall detection efficiency, signal power loss, and detector quantum efficiency. The laser output was 0.185 mW before it was attenuated with optical fiber couplers or IR neutral density (ND) filters. The fiber of each coupler was wound around a 1″ diameter cylinder to reduce the transmission through each fiber coupler to 1% on average, which can be measured by the power meter. Five fiber couplers connected in series can reduce the laser power by the 10th order without affecting the beam path as long as the position of the fiber collimator was fixed. When using IR ND filters from Newport, the transmission of each piece was carefully calibrated by a Perkin Elmer (Santa Clara, California) IR spectrometer at . Use of the ND filters required precise alignment upon insertion into the beam because the ND filters can affect the beam path, which reduces upconversion efficiency if not properly accounted for. The contribution of the displayed counting rate from each laser was shown in Table 2. It shows the measured counts at four different conditions, no lasers turned on (dark count), probe laser on only, pump laser on only, and both probe and pump lasers on to generate the signal. The SPCM we used has higher dark count rates than a normal SPCM due to its age. The laser alone did not add to the measured count rates, since the working spectral range of the silicon detector does not extend to the wavelength. Thus, the measured count is still the dark count if only the laser is turned on. In the case of only the pump laser being turned on, the counting rate is increased by 0.594 K, which can be treated as system background. The background noise is confirmed from the photons and not from the . In an effort to reduce the background induced by the laser, two laser line pass filters were used to block the . Since the background noise wavelength is so close to the signal wavelength, it is not easy to completely separate them. However, the induced background can be subtracted in the signal processing. Examples of the contribution from each laser on SR430 are shown in Fig. 5. The axis represents the number of counts and axis represents the time; it shows no more than one count in each time bin (320 ns bin width). It indicates the measurement is in the “single-photon counting” region. Table 2The displayed counting rate on counter.
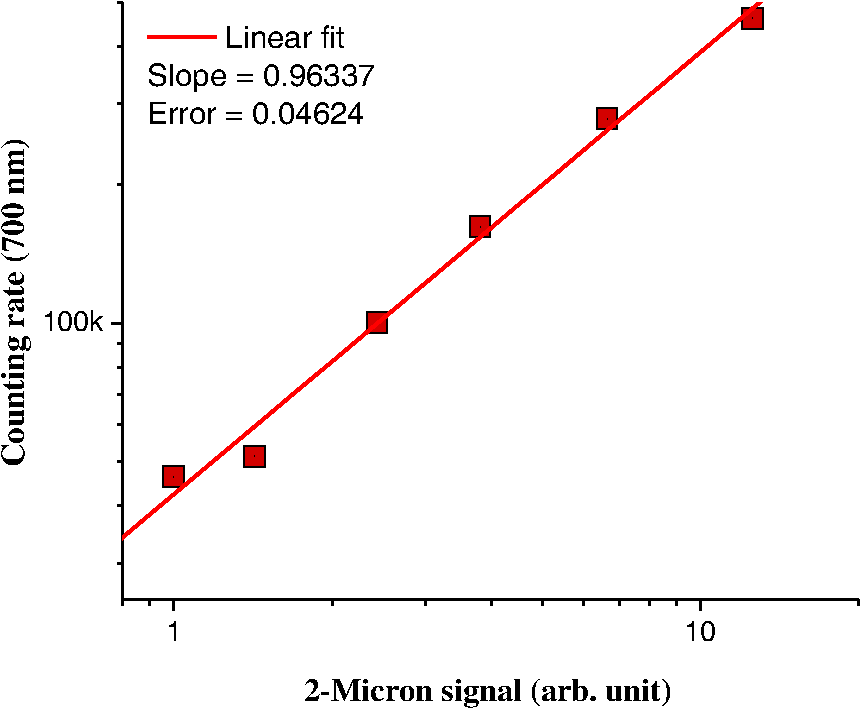
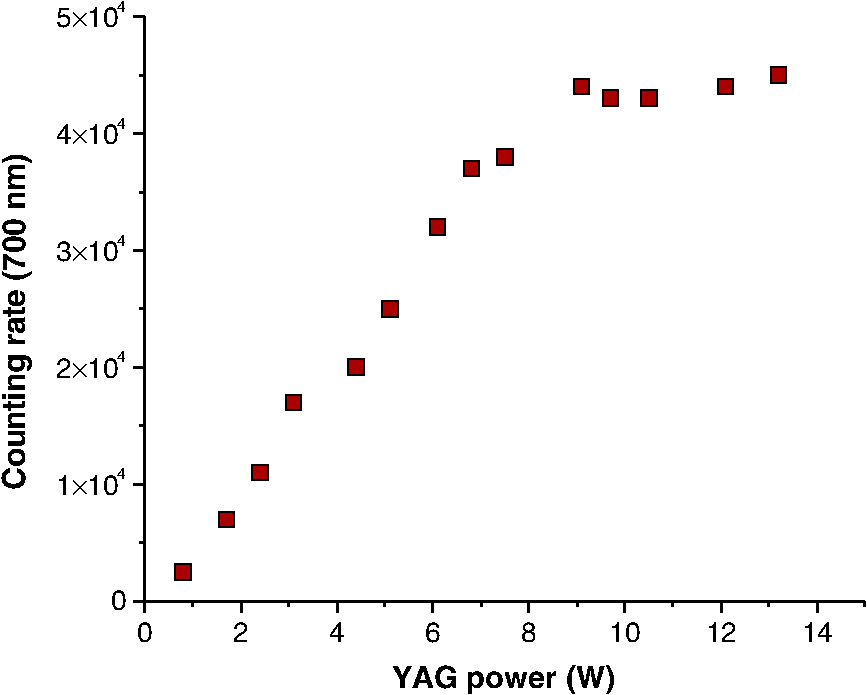
Fig. 5Photon counting signals on Stanford Research SR430 (a) no laser, (b) 2 μm laser only, (c) 0.808 μm laser only, (d) both lasers on. 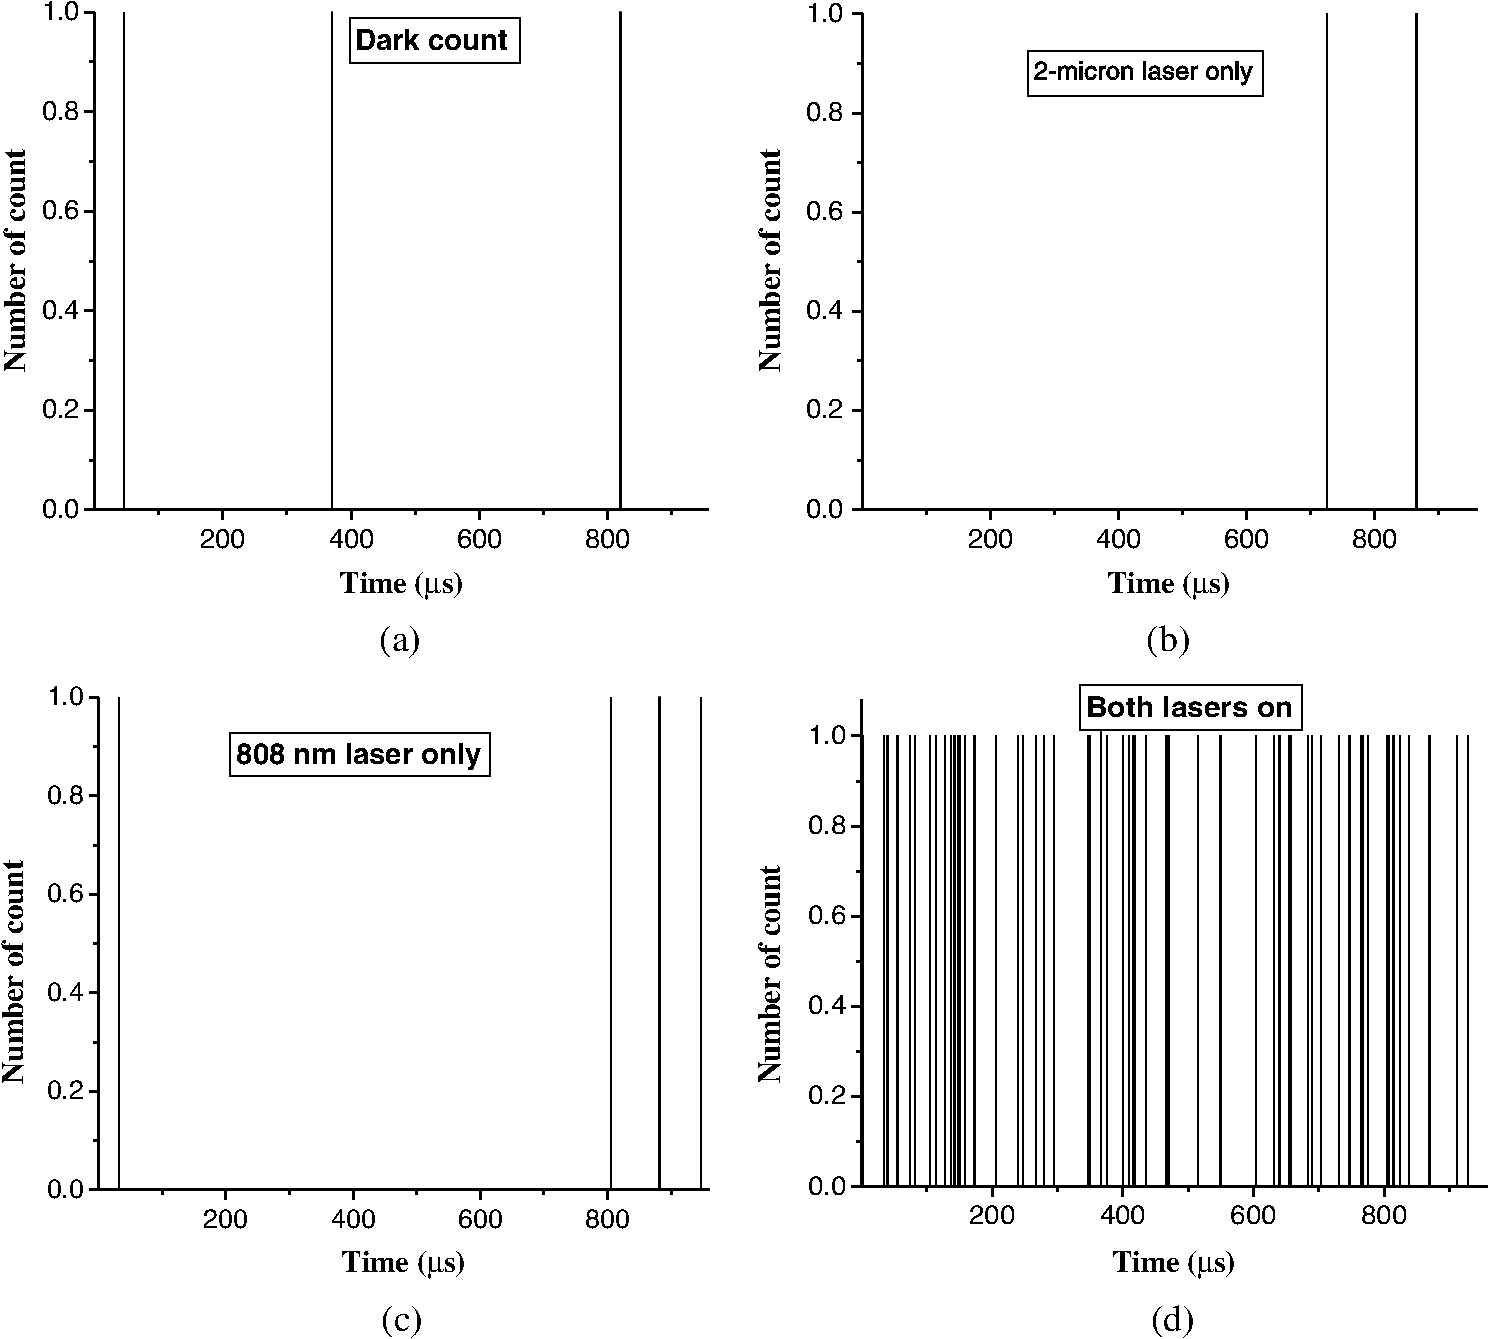 The signal dependence on the laser power was also characterized at this extremely low power (sub pW). Figure 6 shows the relationship of the signal at various signals by arranging the IR ND filters. The progression equation with was obtained by linear fitting. The 0.963 slope in the log–log plot indicates the linear dependence of the signal on the sub pW range power. Figure 7 shows the power dependence of the signal on the YAG laser power at a fixed signal; saturation is observed at a 9W YAG laser power. The generated has to pass through the M3 mirror before it can be detected. The M3 mirror is a concave mirror used for focusing the laser beam into the PPLN, but it acts as a diverging lens for the transmitted beam. The beam passes through M3 at non-normal incidence which causes the output beam to have an elliptical shape. The beam size on the detector surface was measured with the knife edge method; the full width at half maximum along the and directions is 76.3 and , respectively. The diameter of the detector active area is only . Since the 700 nm partially overfills the active detector area, 89% of the photons are actually incident on the active detector area. The total detection efficiency of of the SPCM system (also including prisms, mirrors, 700-nm pass filters and the quantum efficiency of SPCM) will be 24.02%. The initial power is 0.1855 mW and is attenuated by a factor of by the IR ND filters. Thus, the incoming photons are at . The detected counting rate of is on the counter. So the intrinsic upconversion efficiency at a 9 W YAG power is 94% in the single-photon counting region, with an overall detection efficiency of 22.58%. 4.ConclusionIn conclusion, upconversion detection by using bulk PPLN is a promising technique to extend the use of well-developed silicon detectors into remote sensing applications. We have demonstrated the upconversion detection of a signal for the first time using the PPLN converter technique. A high-intrinsic conversion efficiency of to 94% of the bulk PPLN was achieved for the mW level and pW level of the probe laser and the overall detection efficiencies are 59.97% and 22.58%, respectively. This is limited by propagation losses of the optics, especially the laser line pass filter. The linearity of the signal on the probe laser () was demonstrated at both the mW and pW levels, showing that the signal size is directly related to the probe photons over a wide probe power range. The good signal to noise ratio in the single-photon counting region also indicated potential applications in quantum optics. ReferencesM. J. Kavayaet al.,
“The Doppler aerosol wind (DAWN) airborne, wind-profiling coherent-detection Lidar system: overview and preliminary flight results,”
J. Atmos. Oceanic Technol., 31
(4), 826
–842
(2014). http://dx.doi.org/10.1175/JTECH-D-12-00274.1 JAOTES 0739-0572 Google Scholar
J. Yuet al.,
“A 2-micron pulsed integrated path differential absorption lidar development for atmospheric concentration measurements,”
in Reviewed and Revised Papers of the 26th Int. Laser Radar Conf.,
219
–222
(2012). Google Scholar
M. D. Eisamanet al.,
“Single-photon sources and detectors,”
Rev. Sci. Instrum., 82
(7), 071101
(2011). http://dx.doi.org/10.1063/1.3610677 RSINAK 0034-6748 Google Scholar
L. E. Myerset al.,
“Quasi-phase-matched optical parametric oscillators in bulk periodically poled ,”
J. Opt. Soc. Am. B, 12
(11), 2102
–2116
(1995). http://dx.doi.org/10.1364/JOSAB.12.002102 JOBPDE 0740-3224 Google Scholar
N. G. R. Brodericket al.,
“Hexagonally poled lithium niobate: a two-dimensional nonlinear photonic crystal,”
Phys. Rev. Lett., 84
(19), 4345
–4348
(2000). http://dx.doi.org/10.1103/PhysRevLett.84.4345 PRLTAO 0031-9007 Google Scholar
L. E. Myerset al.,
“Multigrating quasi-phase-matched optical parametric oscillator in periodically poled ,”
Opt. Lett., 21
(8), 591
–593
(1996). http://dx.doi.org/10.1364/OL.21.000591 OPLEDP 0146-9592 Google Scholar
O. Gayeret al.,
“Temperature and wavelength dependent refractive index equations for MgO-doped congruent and stoichiometric ,”
Appl. Phys. B, 91
(2), 343
–348
(2008). http://dx.doi.org/10.1007/s00340-008-2998-2 APBOEM 0946-2171 Google Scholar
G. D. Milleret al.,
“42%-efficient single-pass CW second-harmonic generation in periodically poled lithium niobate,”
Opt. Lett., 22
(24), 1834
–1836
(1997). http://dx.doi.org/10.1364/OL.22.001834 OPLEDP 0146-9592 Google Scholar
J. Yuet al.,
“Intra-cavity pumped PPLN OPO with double ring configuration,”
in Advanced Solid-State Photonics Conf.,
(2004). Google Scholar
H. Y. Clarket al.,
“Difference frequency generation in periodically poled lithium niobate and its use in the detection of atmospheric methane,”
Chem. Phys. Lett., 399
(1–3), 102
–108
(2004). http://dx.doi.org/10.1016/j.cplett.2004.09.146 CHPLBC 0009-2614 Google Scholar
M. A. AlbotaF. N. C. Wong,
“Efficient single-photon counting at by means of frequency upconversion,”
Opt. Lett., 29
(13), 1449
–1451
(2004). http://dx.doi.org/10.1364/OL.29.001449 OPLEDP 0146-9592 Google Scholar
A. P. VanDevenderP. G. Kwiat,
“Quantum transduction via frequency upconversion (Invited),”
J. Opt. Soc. Am. B, 24
(2), 295
–299
(2007). http://dx.doi.org/10.1364/JOSAB.24.000295 JOBPDE 0740-3224 Google Scholar
H. Zenget al.,
“Generation and detection of infrared single photons and their applications,”
Front. Phys. China, 1
(1), 1
–18
(2006). http://dx.doi.org/10.1007/s11467-005-0019-z 1673-3487 Google Scholar
X. Guet al.,
“Efficient mid-infrared single-photon frequency upconversion detection with ultra-low background counts,”
Laser Phys. Lett., 10
(5), 055401
(2013). http://dx.doi.org/10.1088/1612-2011/10/5/055401 1612-2011 Google Scholar
G. Temporaoet al.,
“Mid-infrared single-photon counting,”
Opt. Lett., 31
(8), 1094
–1096
(2006). http://dx.doi.org/10.1364/OL.31.001094 OPLEDP 0146-9592 Google Scholar
G.-L. Shentuet al.,
“Upconversion detection near at the single photon level,”
Opt. Lett., 38
(23), 4985
–4987
(2013). http://dx.doi.org/10.1364/OL.38.004985 OPLEDP 0146-9592 Google Scholar
BiographyTeh-Hwa Wong received his master’s degree in theoretical physics from National Cheng Kung University (Taiwan) and a PhD degree in physics from the University of Iowa. His previous work experience includes National Cheng Kung University (Taiwan), University of Iowa, Columbia University, Old Dominion University, and University of Virginia. Now he is a senior research scientist at Science Systems and Application, Inc. His research covers atomic and molecular physics, physical chemistry, nanomaterial, nondestructive inspection, and laser application. Jirong Yu received his BS and MS degrees in electronic engineering at Southeast University, China, in 1978 and 1981, respectively. He received his PhD in electrical engineering from Colorado State University in 1994. His research focuses on innovative solid-state laser techniques which include efficient laser generation, laser line narrowing, accurate wavelength tuning and controlling, as well as novel laser wavelength generation by nonlinear optical techniques. Yingxin Bai received his PhD degree in optics from Shanghai Institute of Optics and Fine Mechanics, the Chinese Academy of Sciences, in 1994. Then he worked for Tsinghua University (Beijing) until he joined the Institute for Ultrafast Spectroscopy and Lasers, the City College of New York, in 1997. From 2001 to present, he has worked at Science Applications International Corporation, Science Systems and Applications Incorporation as a senior optical engineer for supporting NASA developing wind/CO2 lidar. William Johnson is a research scientist at Michigan Aerospace Corporation. He has years of experience in all aspects of the design and development of LIDAR systems. During his graduate education, he developed an infrared scanning differential absorption LIDAR for identifying carbon dioxide leakages at sequestration sites. He was also invited to be a key member in the development of an infrared integrated path differential absorption LIDAR at NASA LaRC for airborne CO2 measurement. Songsheng Chen received his MS in electrical engineering from Southeast University, China, in 1988 and PhD in physics from Colorado State University in 1999. He worked in Southeast University, Colorado State University, Science Applications International Corporation, and Science Systems and Applications Incorporation before he joined NASA. Now he is a senior engineer at Langley Research Center. His research covers lasers and their applications, nonlinear optics, laser remote sensing, and optical signal detection and analysis. Upendra N. Singh is an associate director at the Engineering Directorate (ED), NASA Langley Research Center (LaRC) and is an internationally recognized atmospheric scientist and remote sensing expert with 28 years’ experience as a university researcher, chief scientist with industry, and high-performing civil servant at NASA Langley Research Center. During 2001 to 2013, he served as the chief technologist at the Engineering Directorate, providing technical leadership to more than 350 highly qualified professionals in the area of science, aeronautics, and exploration. |