|
|
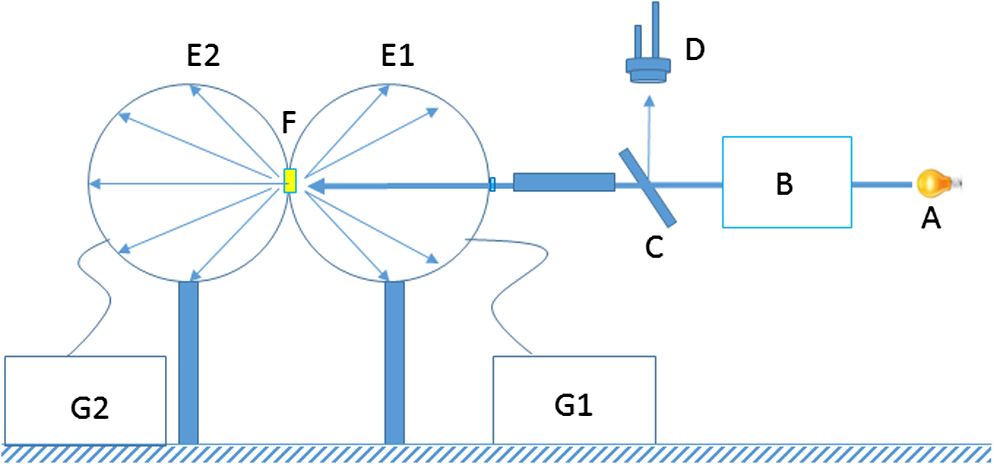
1.IntroductionLight-emitting diodes (LEDs) are becoming widely accepted due to their exceptional energy efficiency and low maintenance cost. The global high-brightness LED market was $12.5 billion in 2011.1 The most efficient and economical way to create white light with LEDs is using phosphors to down-convert the blue light from LED chips and emit longer wavelength light. By carefully controlling the ratio between the blue light and longer wavelength phosphor converted light, the mixture is perceived as white light by human eyes. Phosphor type(s) and phosphor concentration(s) are the key parameters in designing LEDs that emit light within a desired white color bin (chromaticity target). The prevalent method for determining the phosphor recipe is still based primarily on trial and error (package build and test) methodology, which is very time-consuming. It usually takes weeks of effort to develop a phosphor recipe for one specific chromaticity target region for one LED package design. This time-consuming process has become a major bottleneck impeding the application of new phosphors and new LED package designs. A simulation model of phosphors is desired which will accelerate the process of phosphor recipe creation without the need to build many trial LED packages. Presently, the light propagation in phosphors is not well quantified since it involves complex volumetric scattering and light down-conversion within the phosphor material layer. Several previous studies have investigated light propagation in a phosphor medium and different assumptions were used in simulating phosphor scattering such as isotropic scattering, random scattering, and Mie scattering.2–7 However, the majority of these studies lack supporting experimental data to validate their models. Among those who supplied experimental results, their experimental setup share similar problems—the incident light only covers several discrete wavelengths; the transmitted light and reflected light are not measured simultaneously so the light source fluctuations were not excluded from the analysis; the cross talk between integrating spheres (if two such spheres were used) was ignored. In addition, the measurement techniques previously reported are not automated, therefore, are not able to support a high volume manufacturing environment. In this paper, we will introduce a novel double integrating sphere spectral measurement system for phosphor characterization which serves to create empirical data sets that are then used to optimize parameters in phosphor models in Monte Carlo ray-trace simulations. 2.Experimental Setup2.1.Phosphor SamplesA new YAG:Ce2+ phosphor made by Intematix Corporation was selected for this study. To collect empirical data, phosphor samples were made into thin layers with the phosphor powder immersed in silicone on top of thin glass slides. YAG phosphor powder was mixed with silicone with a controlled concentration. Then the silicone–phosphor mixture was uniformly applied, either by spin coating or molding, onto thin transparent glass slides and cured. A total of 22 samples were prepared, with four different phosphor concentrations by weight (10%, 20%, 40%, and 80%) and seven thicknesses (ranging from 30 to ). The concentration of the phosphor was controlled by precisely measuring the weight of phosphor particles and weight of silicone prior to mixing. The range of phosphor concentrations and phosphor layer thicknesses is wide enough to cover the desired ranges for LED package design. 2.2.Double Integrating Sphere Measurement SystemA custom double integrating sphere spectral measurement system was constructed by Gamma Scientific Inc., as shown in Fig. 1.8,9 The system consists of control and data acquisition software, a xenon lamp light source (A), a monochrometer (B) for controlling the spectra bandwidth of the incident light, a reference detector for monitoring incident light (D), two 8 in. integrating sphere (E1 and E2) and two spectro-radiometers [G1 and G2, with G1 to measure the integrated spectral power distribution (SPD) of backward (reflected) light and G2 to collect the SPD of forward (transmitted) light]. During measurement, the broadband xenon lamp spectra are first converted into a tunable narrow bandwidth of nearly monochromatic light (FWHM 5 nm) by the monochrometer. This tunable light source has a wavelength range of 380 to 830 nm. This light is then collimated to an 8-mm diameter beam and coupled into the reflectance sphere (E1) from one side, as shown in Fig. 1. This collimated beam irradiates, at normal incidence, a phosphor sample (F) located between the two integrating spheres. The measurement of the reflected light and transmitted light is accomplished by integrating sphere and spectro-radiometer combinations E1–G1 and E2–G2, respectively. The two spectro-radiometers cover the same spectral range as the monochrometer (380 to 830 nm). 2.3.Phosphor Sample CharacterizationMeasurements of each phosphor sample were performed with incident light progressively scanned from 380 to 830 nm in 5-nm increments. At each wavelength increment, light incident on the phosphor samples produces a reflected SPD, which is measured by integrating sphere (E1) and spectro-radiometer (G1). Simultaneously, the SPD of the light transmitted through the phosphor sample is measured by integrating sphere (E2) and spectro-radiometer (G2). At the same time, the detector (D) monitors the incident light. This process is repeated for each phosphor sample. This produces a large quantity of data in the form of reflected and transmitted SPDs. The SPDs are subsequently used to derive radiant flux (RF), luminous flux (LF), and chromaticity (CCT, CRI, ccx, ccy, u′, v′) data. If the incident wavelength band is out of the excitation spectra of the phosphor, the phosphor layer will act like a volume diffuser without introducing a down-conversion wavelength shift. If the incident beam wavelength is within the phosphor excitation spectra, the phosphor will be excited and emit a distribution of longer wavelength light with lower photon energy. The generated long wavelength light mixes with the remaining incident short wavelength light within the phosphor layer. This mixed light will eventually leave the phosphor sample in two directions: forward direction (transmission) and backward direction (reflection). Compared with previously reported methods,2–7 the unique features of our system include:
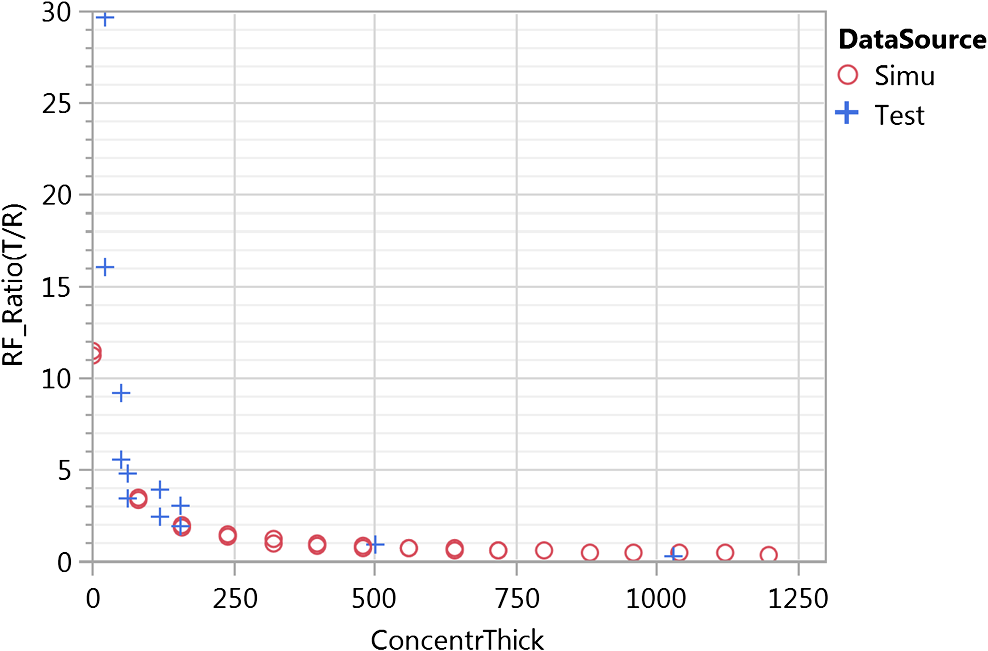
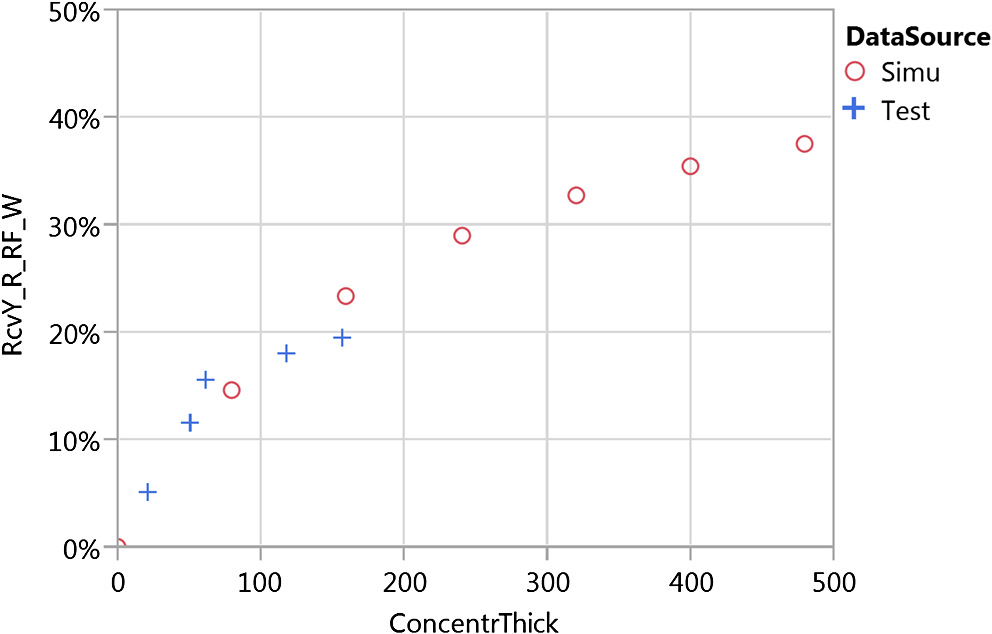
The system enabled us to take reflected and transmitted SPD data and to subsequently determine the excitation spectra, absorption spectra, and emission spectra of the phosphor samples. With these empirical phosphor spectra, we were able to calculate the down-conversion efficiency of each phosphor sample containing a specific concentration and thickness. 3.Modeling the Phosphor in a Monte Carlo Ray-Trace SimulationThe simulation and optimization of the phosphor model were conducted using LightTools® software. In order to model phosphor down-conversion and scattering, it is necessary to input the following parameters into LightTools®: the mean free path (MFP) for rays intersecting the phosphor particles, the emission spectra of the phosphor, the excitation spectra of the phosphor, the absorption spectra of the phosphor, the phosphor particle size, and the scattered light intensity distribution function for nondown-converted rays. We obtained the excitation, emission, and absorption spectra by analyzing the sample data obtained in Sec. 2. The MFP of rays within the phosphor layer of each sample was left as a free variable in our phosphor model parameterization optimization. The scattered light intensity distribution for nondown-converted rays was determined by assuming Mie scattering for the phosphor particles and by leaving the size of the Mie scattering particles as a free variable for parameter optimization. The refractive index of phosphor particles was obtained from the manufacturer’s datasheet. We created a simulation in LightTools® that simulates the input beam, the silicone encapsulated phosphor samples on glass and the double integrating sphere detector system similar to the instrument described in Sec. 2.2. These detectors in the simulation collect the SPDs of reflected and transmitted light for all simulated samples. These SPDs then allowed us to calculate the total reflected and transmitted quantities: RF, LF, average CCT, and average chromaticity coordinates. For simplicity, we present only the transmitted and reflected RF results (calculated from the SPDs) of our measurements and simulations in this paper. The initial attempt at modeling the phosphors based on the manufacturer’s average particle size and assumed MFP was unsuccessful in matching the empirical data collected by the double integrating sphere system. There are multiple potential reasons for the discrepancies: the shapes of the phosphor particles are irregular and cannot be accurately represented by a mathematical model; the suspension of phosphor particles in silicone is not uniform due to phosphor settling during the curing process. Also, the average particle size may not be adequate, and we may need an accurate particle size distribution. We subsequently optimized two parameters in the phosphor model (MFP and Mie particle size) to better represent the real situation. We utilized half of the empirical data from Sec. 2 for optimization and the remaining half for verification (see Sec. 4). The merit function for optimization was based on the ratio of transmitted radiant flux (RF_T) over reflected radiant flux (RF_R), which we call the RF_Ratio (). The merit function variance from the empirical data and the simulated data was minimized during the optimization process. Results of the RF_Ratio () from the optimized simulation and the empirical data used in optimization match well, as shown in Fig. 2. In all the following figures, the horizontal axis, ConcentrThick, is defined as the product of the phosphor concentration (in % by weight) and phosphor thickness (), which is a relevant physical quantity related to the volume of phosphor with which light interacts. 4.VerificationThe remaining half of the empirical data were used to verify the optimized phosphor model obtained in Sec. 3. 4.1.Incident Light Out of Phosphor Excitation RangeThe excitation range of the phosphor used in this study is 370 to 485 nm, so incident light between 490 and 830 nm is out of the excitation range. For simplicity, only 550 nm incident light is shown in this section. Figures 3Fig. 4–5 show the comparison between the optimized phosphor model simulation results and the verification measurement results. As one can see, the simulated data follow the measurement results very well. Fig. 3Optimized simulation result versus empirical data (for verification) of the transmitted radiant flux with 1 W 550 nm monochromatic () incident light. 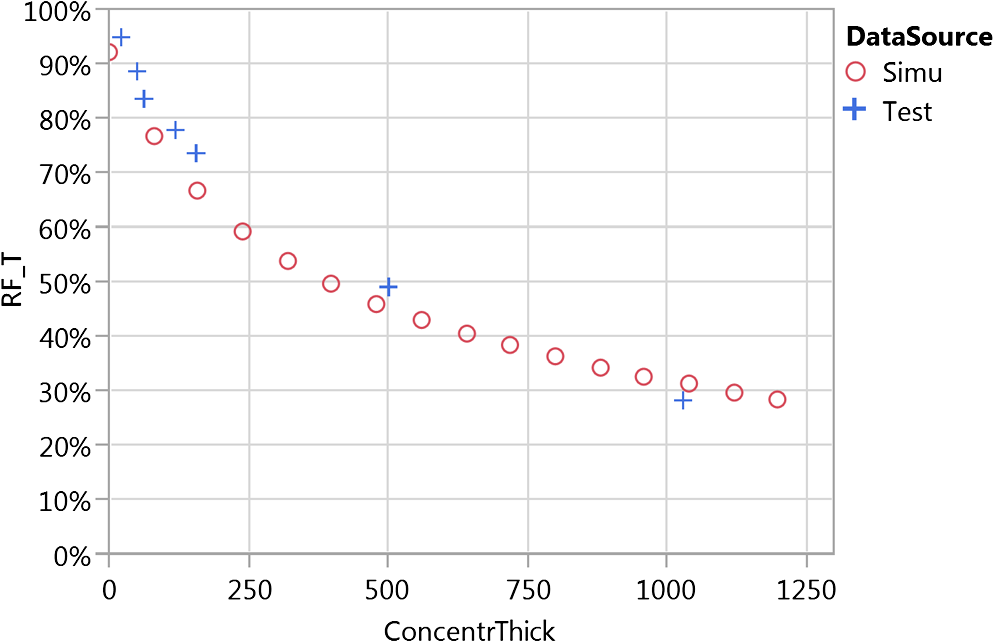 Fig. 4Optimized simulation result versus empirical data (for verification) of the reflected radiant flux with 1 W 550 nm monochromatic () incident light. 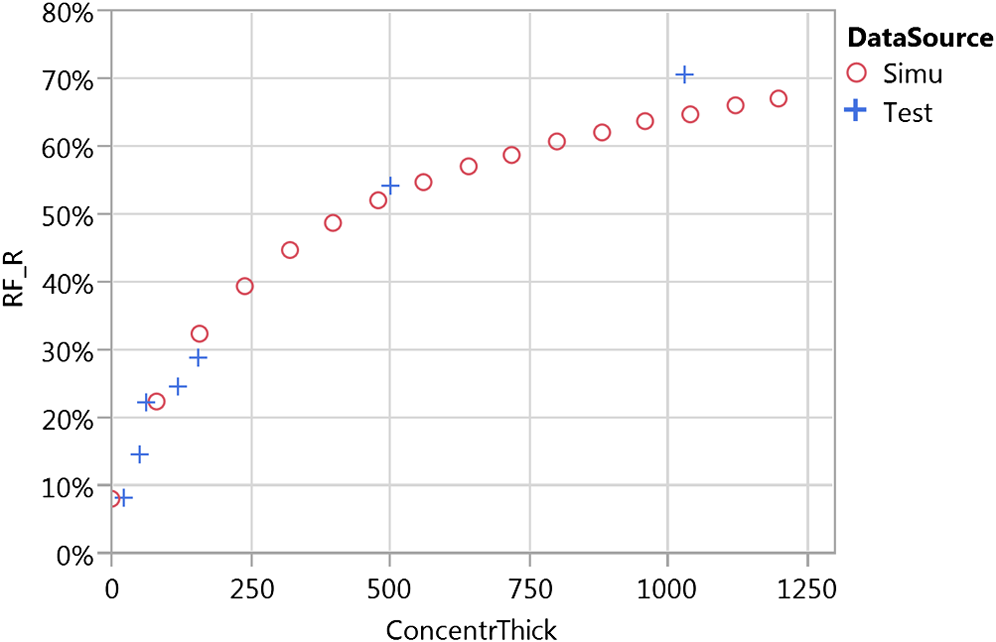 Fig. 5Optimized simulation result versus empirical measured data of the light loss (in terms of radiant flux) with 1 W 550 nm monochromatic () incident light. 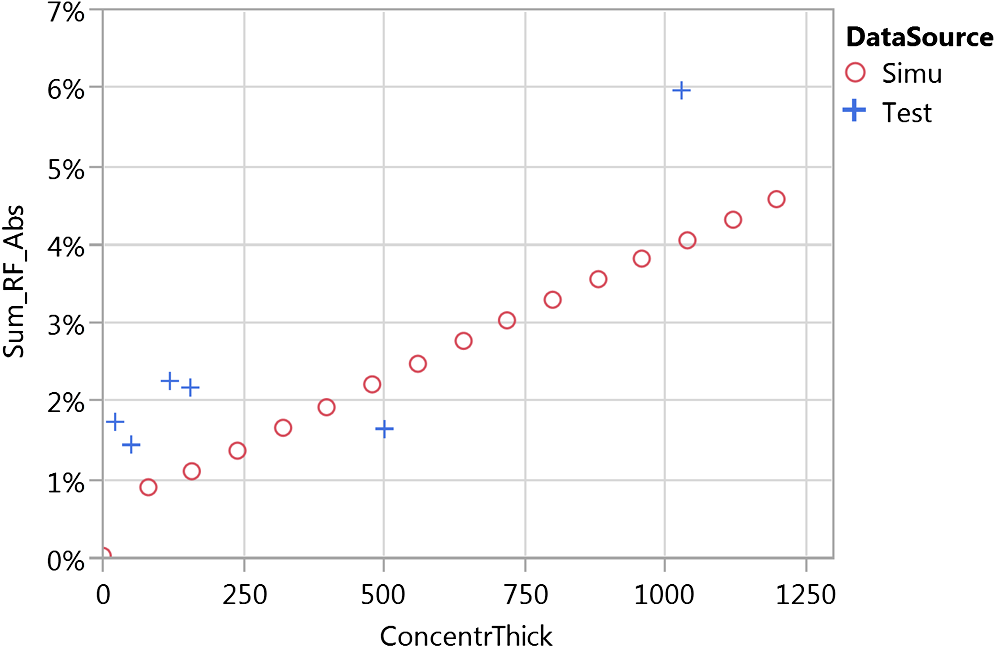 According to Figs. 3 and 4, when increasing the volume of phosphor with which the light interacts, the radiant flux of the transmitted light decreases rapidly and the reflected light increases in a similar fashion. This trend can be qualitatively explained by Mie scattering theory. According to Mie theory, when a 550 nm ray meets a phosphor particle (typically with a size on the order of microns), the scattered light is not isotropic and there is more forward propagated light after the scattering process.10,11 With the volume of phosphor increasing either via higher phosphor concentration or a higher thickness, the forward propagated light will have more chances to be further scattered and change into backward propagated light. Therefore, one should expect the forward transmitting light to decrease and the backward reflected light to increase with a higher phosphor volume. In Fig. 5, Sum_RF_Abs is the light loss due to absorption by the sample materials and due to the equipment. As illustrated in Fig. 5, the total light loss will increase for a higher volume of phosphor. This is because incident light will have a higher probability to be scattered with more phosphor particles, which ends up with a longer optical path inside the phosphor/silicone media. Since the phosphor/silicone layer is not absorption free, the light loss due to material absorption will increase. 4.2.Incident Light Within Phosphor Excitation RangeIf the wavelength of incident light is within the phosphor excitation range, other than the absorption and scattering mentioned in Sec. 4.1, the phosphor will be excited by the incident light and emit longer wavelength light, which induces more energy losses. Any incident light between 370 and 485 nm is within the phosphor excitation range. For simplicity, only 455 nm incident light is presented and discussed in this section. Figures 6 and 7 show the comparison of simulation results and empirical measured results. The simulation result matches reasonably well with the test result. Fig. 6Optimized simulation result versus empirical data of the transmitted radiant flux with 1 W 455 nm monochromatic () incident light. 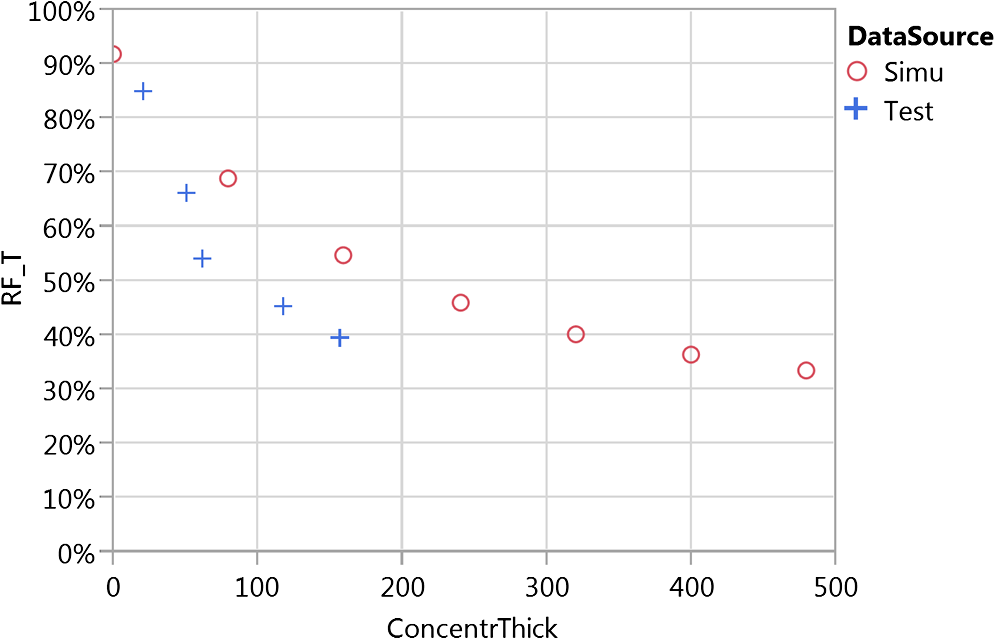 Fig. 7Optimized simulation result versus empirical data of the reflected radiant flux with 1 W 455 nm monochromatic () incident light. 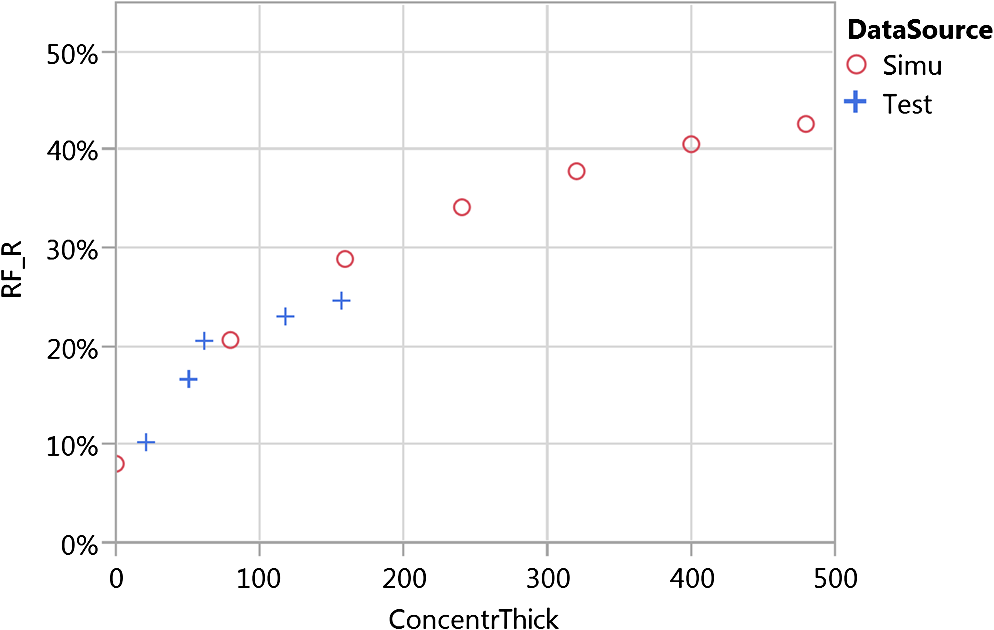 Figures 8 and 9 show the scattering characteristics of phosphor down-converted long wavelength light. When increasing the volume of phosphor, each short wavelength ray has a greater possibility to meet and excite a phosphor particle, therefore, the overall long wavelength light increases. It increases in both the forward (transmitted) and backward (reflected) directions. This trend agrees with Mie theory.10,11 One noteworthy observation of the graphs is that the increasing rate of long wavelength light decreases when the phosphor volume increases and eventually reaches saturation. 5.ConclusionIt is demonstrated that the double integrating sphere measurement system can be used to perform characterization of phosphors without building LED packages or employing a time-consuming trial and error process. This system was used to characterize phosphor absorption, excitation, and absorption spectra for both transmission and reflection modes as a function of input light wavelength. This determination of the absorption, excitation, and emission spectra of the phosphor can serve as input for building a phosphor simulation model. The data are critical to calculate the down conversion efficiency of phosphor and understand the energy budget during LED package design. Also presented is a methodology for optimizing parameters within a phosphor Monte Carlo simulation model, with which the phosphor performance could be predicted. A simulation model of YAG phosphor was optimized and verified to match with data collected from the double integrating sphere system in reflection and transmission modes for input light either within or outside the excitation spectra of the phosphor. Once a collection of such models for many phosphors is assembled, it is possible to easily determine the phosphor recipe for a given blue LED batch to produce white light that has predictable chromaticity and efficiency performance, which can save development time in LED packaging design and manufacturing. AcknowledgmentsThe authors would like to thank Gamma Scientific Inc. for customizing the double integrating sphere system for this project. ReferencesThe Worldwide Market for LEDs Market Review and Forecast 2012, California
(2012). Google Scholar
Y. ZhuN. NarendranY. Gu,
“Investigation of the optical properties of YAG:Ce phosphor,”
Proc. SPIE, 6337 63370S
(2006). http://dx.doi.org/10.1117/12.682056 PSISDG 0277-786X Google Scholar
K. YamadaY. ImaiK. Ishii,
“Optical simulation of light source devices composed of blue LEDs and YAG phosphor,”
J. Light Visual Environ., 27
(2), 70
–74
(2003). http://dx.doi.org/10.2150/jlve.27.70 JLEVDQ 0387-8805 Google Scholar
H. Luoet al.,
“Analysis of high-power packages for phosphor based white-light-emitting diodes,”
Appl. Phys. Lett., 86 243505
(2005). http://dx.doi.org/10.1063/1.1949282 APPLAB 0003-6951 Google Scholar
S. FujitaA. SakamotoS. Tanabe,
“Luminescence characteristics of YAG glass–ceramic phosphor for white LED,”
IEEE J. Sel. Top. Quantum Electron., 14
(5), 1387
(2008). http://dx.doi.org/10.1109/JSTQE.2008.920285 IJSQEN 1077-260X Google Scholar
S. Tanabeet al.,
“YAG glass-ceramic phosphor for white LED (II): luminescence characteristics,”
Proc. SPIE, 5941 594112
(2005). http://dx.doi.org/10.1117/12.614681 PSISDG 0277-786X Google Scholar
Z. Liuet al.,
“Measurement and numerical studies of optical properties of YAG:Ce phosphor for white light-emitting diode packaging,”
Appl. Opt., 49
(2), 247
–257
(2010). http://dx.doi.org/10.1364/AO.49.000247 APOPAI 0003-6935 Google Scholar
R. L. AustinT. D. VogtJ. E. Leland,
“Low uncertainty absolute characterization of total phosphor spectral emission as a function of excitation wavelength,”
in Proc. CIE 2014 Lighting Quality & Energy Efficiency, CIE,
(2014). Google Scholar
J. LelandN. JohnsonA. Arecchi,
“Principles of bispectral fluorescence colorimetry,”
Proc. SPIE, 5941 76
–87
(1997). http://dx.doi.org/10.1117/12.284094 PSISDG 0277-786X Google Scholar
G. Mie,
“Beiträgezue Optiktrüber Medien, spezüiellkolloidalermetallösungen,”
Ann. Phys., 330
(3), 377
–445
(1908). http://dx.doi.org/10.1002/andp.19083300302 ANPYA2 0003-3804 Google Scholar
C. F. BohrenD. R. Huffman, Absorption and Scattering of Light by Small Particles, Wiley& Sons, New York
(1983). Google Scholar
BiographyHuiying Wu received an MS degree in lighting from Rensselaer Polytechnic Institute (R.P.I.), Troy, New York, USA, and an MS degree in electronics engineering from Tsinghua University, Beijing, China. She is currently a Reticle Enhancement Technology engineer of Micron Technology Inc., Boise, Idaho, USA. She had previously served as an optical system design engineer for Micron, Inc. and Optical Design & Development engineer in CREE, Inc. Her research interests include nonimaging optical design, simulation, and metrology of LEDs. David R. Jenkins received an MS degree in physics from University of Michigan in 1991. Currently, he is a senior manager of R&D at Synopsys, Inc., Optical Solution Group. He previously served as director of engineering and director of strategic marketing and innovation at Micron, Inc., founder and president for Orb Optronix, Inc., and vice president at Radiant Imaging, now Radiant-Zemax, Inc. He is a member of SPIE, SAE, and SID. |