|
|
1.IntroductionEye blinks occur in the majority of primates, including humans. It happens spontaneously when humans are sneezing and can be consciously used to attract a partner. Eye blink frequency has been studied as a factor in fatigue and drowsiness detection systems to alert drivers.1–4 In other research,5 the eye fatigue measurement is researched in display with the assumption being that people blink more than usual when fatigued.5 Although not associated with drowsiness or fatigue, there are many studies about eye blink. The use of startled eye blink as a physiological measure was researched by Chittaro and Sioni,6 while Tada et al. studied eye blink behavior in 71 primates in terms of their evolution.7 Champaty et al. researched the method of correcting a gait abnormality called foot drop using functional electrical stimulation when people blink their eyes.8 For people who are unable to type on a keyboard, Ashtiani and MacKenzie developed a typing program using eye blink and gaze tracking.9 There have been many previous researches about eye blink detection, and they can be categorized into nonimage-based and image-based methods. In the nonimage-based method, they used two electrode pads to detect the correct electro-oculography (EOG) signal of the eyelid3 and EOG system for eye movement analysis.10 These sensors are attached around the muscles of the eyes and used to classify eye openness and closure by obtaining electronic signals. Other methods use electromyography,6,8 which can analyze muscle signals to classify eye openness and closure. These methods have the advantage that their objective measurements permit detailed numerical analysis. However, they have the disadvantages that the sensor must be attached to the user’s body, and the stimulation signals from a body can disturb the desired signals (i.e., produce noise), which can limit the user action. To overcome these problems, the image-based method can be considered as an alternative. Because this method does not use the attached sensors, the user’s convenience can be enhanced through allowing the natural movement of the head or body. In previous research,11 they explained various methods of eye localization, such as a probabilistic framework, the adaptive boosting (AdaBoost), support vector machine (SVM), and general-to-specific model definitions with comparisons of eye localization results. Image-based methods include video-based and single image-based methods. Video-based methods can detect eye blink based on the information of successive images. Lalonde et al. used the scale invariant feature transform and differences between consecutive images for eye blink detection.12 Mohanakrishnan et al. proposed the method of detecting eye blink based on eyelid and face movement.13 Lee et al. researched eye blink detection using both the cumulative difference of the number of black pixels of the eye area in successive frames and the ratio of height to width of the eye area in an image.14 Although the accuracy of the video-based method is usually high, it takes more processing time to extract the information of eye blink detection from plural images. Single image-based methods can be divided into those with training and without training. The former method detects eye blink based on the trained model. However, the performance of eye blink detection is dependent on the training results and requires the additional procedure of training with a new database. Jo et al. used the SVM based on the sparseness and kurtosis, and the features by principal component analysis (PCA) + linear discriminant analysis for detecting open or closed eyes.2 Bacivarov et al. developed an eye blink detection method that employed feature tracking around the eye using an active appearance model.15 The methods based on user-specific eye template matching also exist.16,17 Wu and Trivedi proposed the method of blink detection based on tensor subspace analysis.18 Lenskiy and Lee used the method using neural network approximation based on skin color histogram, and the probability density functions of the facial feature class is also used.19 Hoang et al. used the PCA method for classifying open and closed eye for blink detection.20 Trutoiu et al. proposed the method using the model based on PCA for animating eye blink.21 As the single image-based method without training, the method based on iris detection was researched by Colombo et al.22 However, the performance enhancement of their method of detecting eye open or close is limited due to using only the simple method of measuring the disparity of the axis of the detected iris. In previous research,23 they propose the method of eye detection based on skin color, rules, and geometrical relationships of facial components. However, their method requires additional lip detection before eye localization because the geometrical relationships are based on lip position. In other research,24 they proposed an eye detection method and the system for monitoring a driver’s state based on the eyes. However, their method requires two camera systems of visible light and near-infrared light. In addition, the image resolution of the eye region is large in their experiment because the Z distance between the camera and driver is not far. Most previous researches were done with eye images of high resolution. However, considering the environment where a user watches TV at a distance, and the camera is positioned close to the TV, the image resolution of the eye image is very low. To overcome the above problems of previous researches and for the accurate detection of eye blink with the images of low resolution, we propose a new fuzzy-based method for classifying eye openness and closure. The proposed method uses and color information from the HSI and CMYK color spaces, respectively, for eye segmentation. The eye region is binarized using the fuzzy logic system based on and inputs, which is less affected by eyelashes and shadow around the eye. Through the fuzzy logic system, the combined image of the and pixels is obtained. In order to reflect the effect by all the inference values (IVs) on calculating the output score of the fuzzy system, we use the revised weighted average method (RWAM), where all the rectangular regions by all the IVs are considered for calculating the output score. Then, the final classification of eye openness or closure is made based on the standard deviation of the vertical pixel length calculated from the binarized image. In our research, the classification of eye openness or closure is successfully made with eye images of low resolution, which are captured in the environment of people watching TV at a distance. By using the fuzzy logic system, our method does not require the additional procedure of training irrespective of the database. In this research, our main contribution is obtaining a more accurate binarized image of the eye region for eye segmentation by combining the and images based on a fuzzy logic system, which can enhance the accuracy of eye-state classification. Any eye-state classification method can be used with our new method of eye segmentation. Table 1 shows the comparisons of previous and the proposed methods for detecting eye blink. Table 1Comparison of previous and proposed eye blink detection methods.
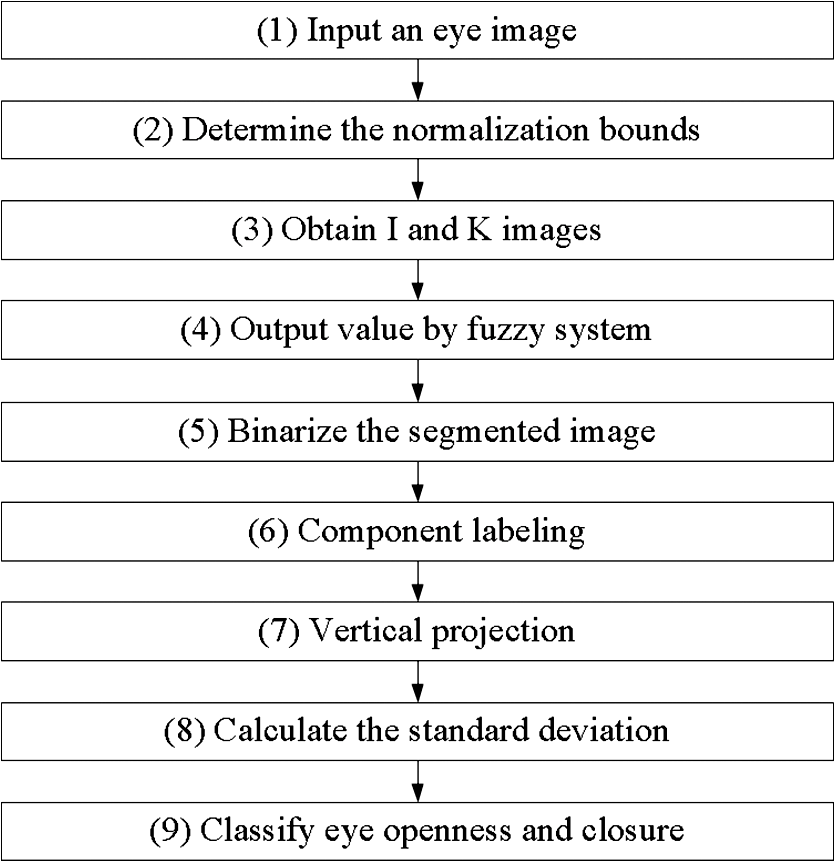
Our paper is organized as follows. The proposed method is explained in Sec. 2. In Sec. 3, we describe and analyze the experimental results. Finally, our conclusions are summarized in Sec. 4. 2.Proposed Method2.1.Overview of the Proposed ApproachFigure 1 shows an overview of the proposed method. First, we obtain an RGB eye image. Then, we normalize the and values to the range [0, 1] in order to use them as inputs to the fuzzy system. Next, we obtain the output image from the fuzzy system combining each pixel of the and images. Each pixel of the output image has a range from 0 to 1, and this image is converted to one where each pixel has the range from 0 to 255 by simple linear scaling. The image is then binarized using a specific threshold and we execute component labeling to select the biggest eye blob area. Then we project black pixels in the vertical direction and calculate the standard deviation of the vertical lengths of the projected black pixels. Finally, the eye openness or closure is classified based on the standard deviation. 2.2.Eye Image Preprocessing2.2.1.Detection of the eye regionTo obtain the eye region from the input image, we should detect the face region in the input image. We use the AdaBoost method, which has been widely used, for face detection.25 The AdaBoost is used to detect the region of interest (ROI) of an eye within a face. We also used the sub-block-based template matching for eye detection26,27 when the eye detection by AdaBoost failed. In our system, if there is no detected result by the AdaBoost method when searching the area of the eye, the eye detection by the AdaBoost method is considered a failure. If the eye detection by sub-block-based template matching fails, the eye region is located by adaptive template matching.28 Sub-block-based template matching involves locating the eye candidate position by scanning a mask of sub-blocks.25,26 At each scanning position of the mask, the sum of the differences between the gray average of the central sub-block and those of the surrounding eight sub-blocks is calculated as the matching value. The position where this matching value is maximized is considered to be the eye position.25,26 If the matching values of all the detected eye regions are less than a given threshold, our system determines that the sub-block-based template matching has failed to detect the eye region and performs adaptive template matching, as follows. Once we have found the eye ROI in the eye detection step, we form an eye template image. In the next frame, we check the similarity between the eye template and the current frame image. If the matching score (similarity) is higher than the threshold, the detected region is regarded as same as the eye template image and the template is adaptively updated by the detected region in the current frame.28 If the matching score is less than the threshold, our system determines that the adaptive template matching has failed to detect the eye region, and the eye ROI detected in the previous frame is determined to be the current one. 2.2.2.Obtaining I and K images from eye regionThe colors of the human pupil and the eyelashes vary from light brown to black—this is usually darker than the color of the skin. To classify dark and bright pixels and detect eye openness and closure, we propose fuzzy-based segmentation. Two features are used as inputs to the fuzzy system. The first input is the intensity () of the hue saturation intensity (HSI) color space.29 The second input is black () from the CMYK color space.30 The two inputs are calculated by Eqs. (1) and (2), respectively: In Eqs. (1) and (2), , , and are the red, green, and blue values of an RGB pixel. The I value is obtained by averaging , , and . The value is obtained by Eq. (2). The input values of a fuzzy system should range from 0 to 1, whereas the range of and is from 0 to 255. Therefore, we perform the normalization of and so as to make their range from 0 to 1. For that, we obtain the histograms of the and values, respectively, and model the histogram as a Gaussian distribution. Then we set the minimum and maximum boundaries of and for normalization based on a three-sigma range (99.7%)31 in order to exclude the noise value in the range for normalization. That is, we obtain and as the min and max bounds from the histogram, and these bounds are obtained for each eye image. If a pixel value of the and image is over the max bound, it is set to 1, and if the pixel value is under the min bound, it is 0. Equation (3) represents this method: where is a pixel value from the or image, and is the normalized pixel value. From Eq. (3), we obtain the two inputs whose ranges are from 0 to 1 for the fuzzy system. Figure 2 shows the examples of and images and their histograms.Fig. 2and images obtained from an RGB image, and their histograms. (a), (f), (k), and (p) RGB images. (b), (g), (l), and (q) images. (c), (h), (m), and (r) images. (d) Histogram of (b) (non-Gaussian shape). (e) Histogram of (c) (non-Gaussian shape). (i) Histogram of (g) (shape similar to Gaussian). (j) Histogram of (h) (shape similar to Gaussian). (n) Histogram of (l) (shape similar to Gaussian). (o) Histogram of (m) (shape similar to Gaussian). (s) Histogram of (q) (shape similar to Gaussian). (t) Histogram of (r) (shape similar to Gaussian). 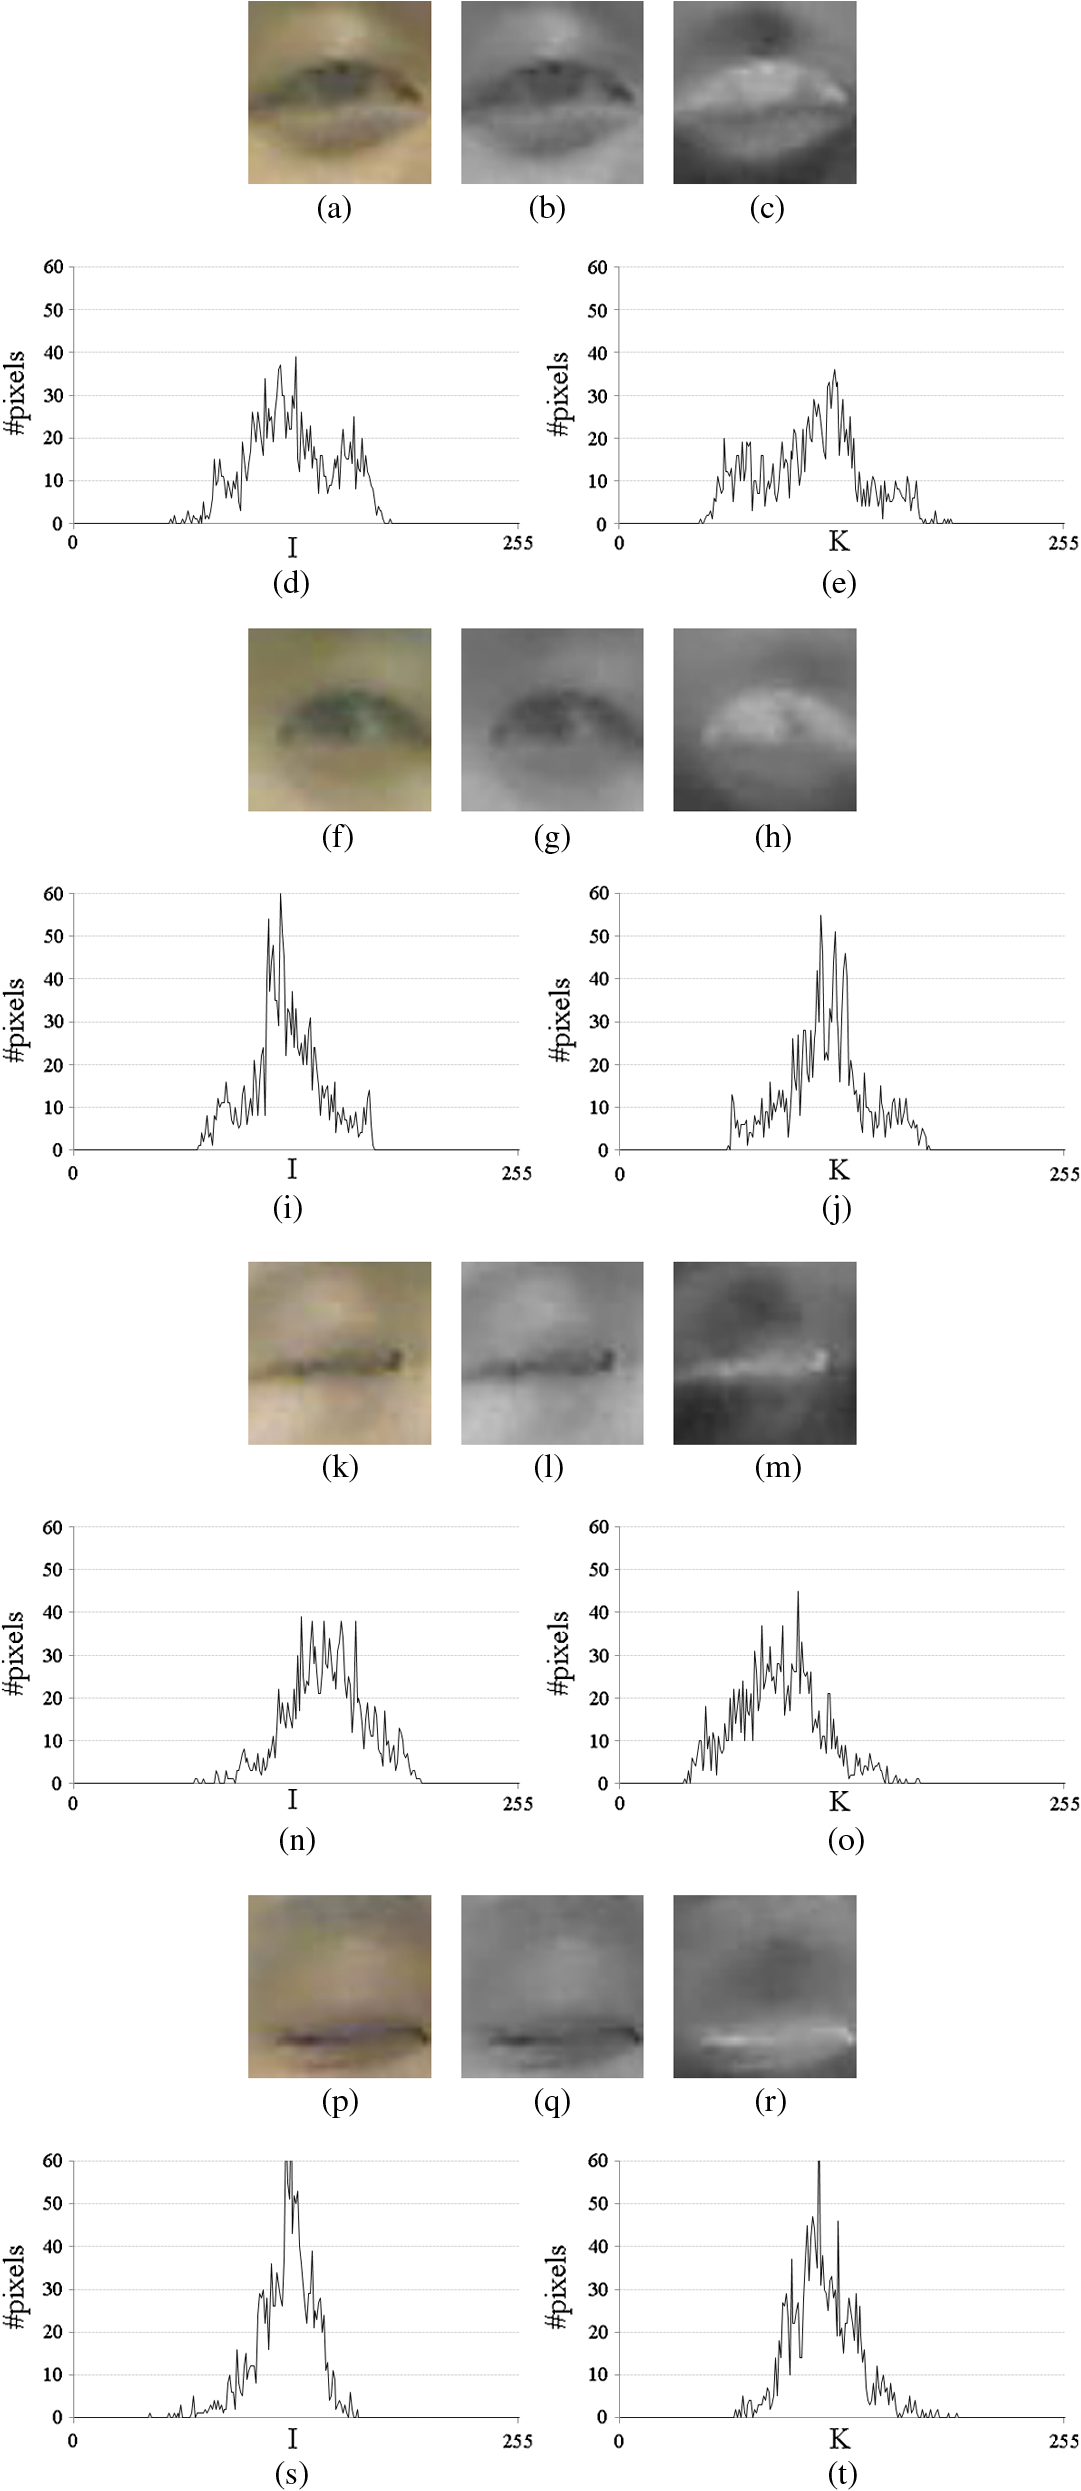 As shown in Figs. 2(d) and 2(e), although the histograms of some images are a little different from the Gaussian shape, most image histograms are quite similar to the Gaussian shape, as shown in Figs. 2(i), 2(j), 2(n), 2(o), 2(s), and 2(t). Therefore, our normalization based on a Gaussian shape does not produce an error. In addition, without this method of setting the minimum and maximum boundaries for normalization based on the assumption of a Gaussian shape, it is difficult to use other theoretical methods to determine the minimum and maximum boundaries. Therefore, we use the normalization method based on the assumption of a Gaussian shape in our research. 2.3.Fuzzy-Based Eye Image Segmentation Method2.3.1.Definition of fuzzy membership functionsIn general, it is difficult to determine an optimal threshold for image segmentation. In this study, we propose a fuzzy-based eye image segmentation method. On the basis of the assumption that the pupil and eyelashes are usually darker than the skin, we use the and values as the two inputs to the fuzzy system. Each of these inputs is in the range [0, 1]. The output value from the fuzzy system also ranges from 0 to 1. The fuzzy membership functions used in this study are shown in Fig. 3. Generally, membership functions are used to represent the distribution of input or output values in a fuzzy system. As shown in Fig. 3, the low (), middle (), and high () areas are usually designed as being overlapped. We use these membership functions and fuzzy rules to obtain an output value through the defuzzification method. Table 2 shows the fuzzy rule table used in this study. Fig. 3Illustrations showing the input and output fuzzy membership functions: (a) the input fuzzy membership function for value; (b) the input fuzzy membership function for value; (c) output fuzzy membership function. 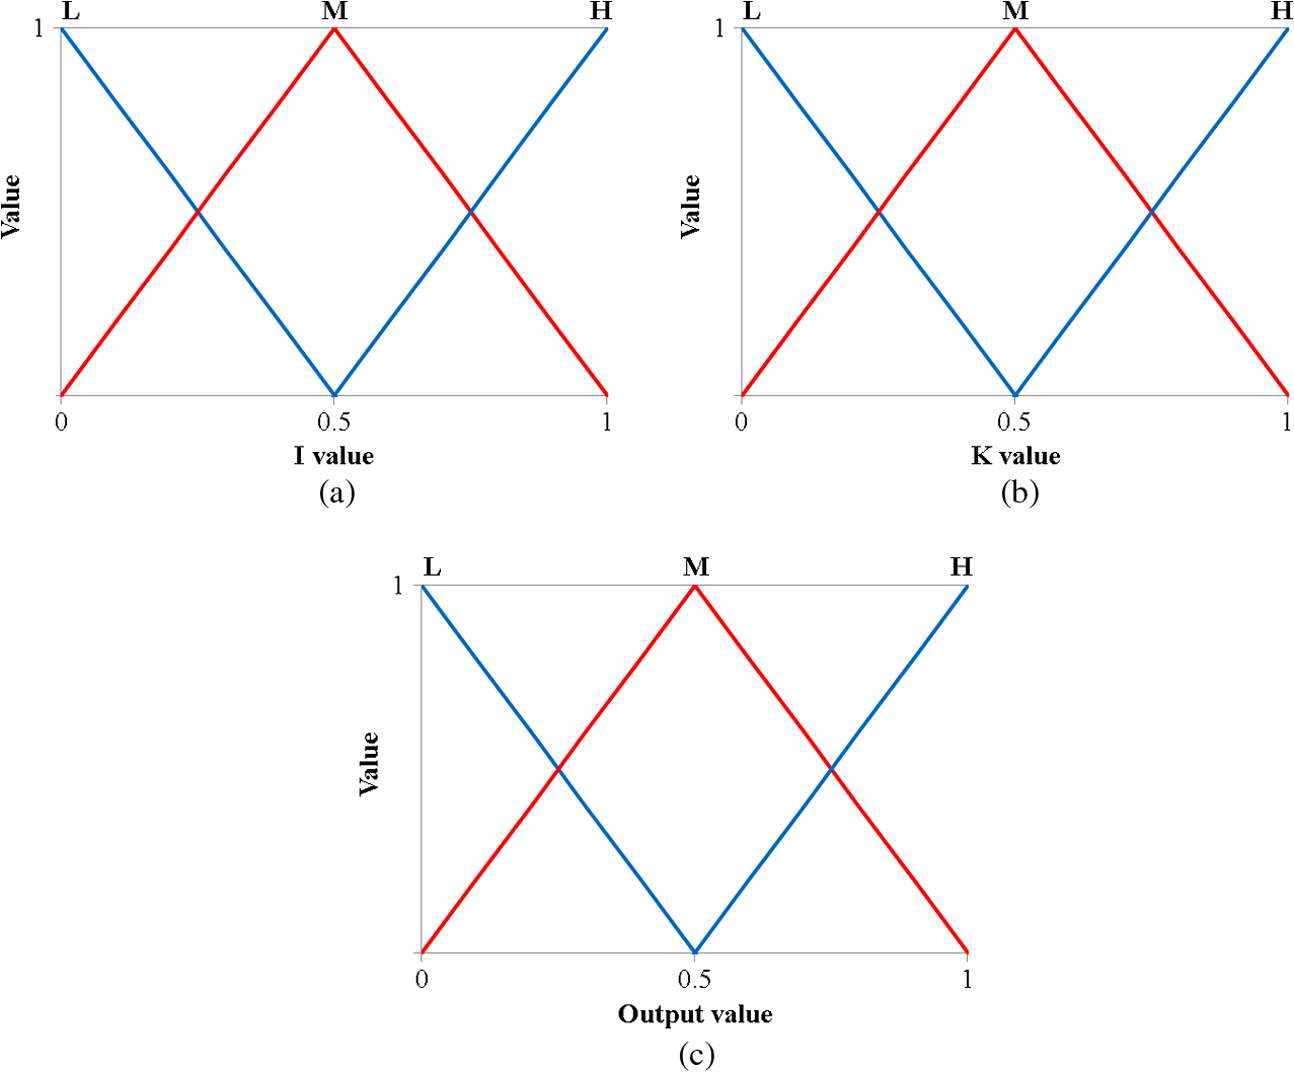 Table 2Fuzzy rule table for obtaining the output value of fuzzy system.
As shown in Fig. 2, the eye region is usually darker than other areas, whose and values are low and high, respectively. Therefore, if the values of the and pixels are shown as lower and higher ones, respectively, the possibility that the given pixel belongs to the eye region is higher (). On the contrary, if the values of the and pixels are shown as higher and lower ones, respectively, the possibility is lower (). Based on these, we design the fuzzy rule table as shown in Table 2. Therefore, when the and values of the pixel are low and high, respectively, the output value is close to 1. In contrast, if the and values of the pixel are high and low, respectively, the output value is close to 0. However, when the environmental illuminator is bright, the value of eye pixels could be brighter than normal. The effect of camera blurring can also cause the value of eye pixels to be brighter than normal. Hence, we design the fuzzy rule table where the value of eye pixels can be or with the value of . 2.3.2.Obtaining the output value of fuzzy system by defuzzification methodAs shown in Fig. 4(a), three outputs are obtained as , , and , respectively, through three membership functions of , , and with input 1 ( value). In addition, three outputs are also obtained as , , and , respectively, through three membership functions of , , and with input 2 ( value). For example, if the input value of is 0.538, , , and are 0.0, 0.924, and 0.076, respectively, as shown in Fig. 4(a). If the input value of is 0.429, , , and are 0.143, 0.857, and 0.0, respectively, as shown in Fig. 4(b). With these two pairs of three outputs, we can obtain the nine combinations of output [(, ], [, ], [, ], [, ], [, ], [, ], [, ], [, ], [, ] as shown in Table 3. Fig. 4Illustrations of obtaining the output of membership function: (a) outputs of input 1 ( value) and (b) outputs of input 2 ( value). 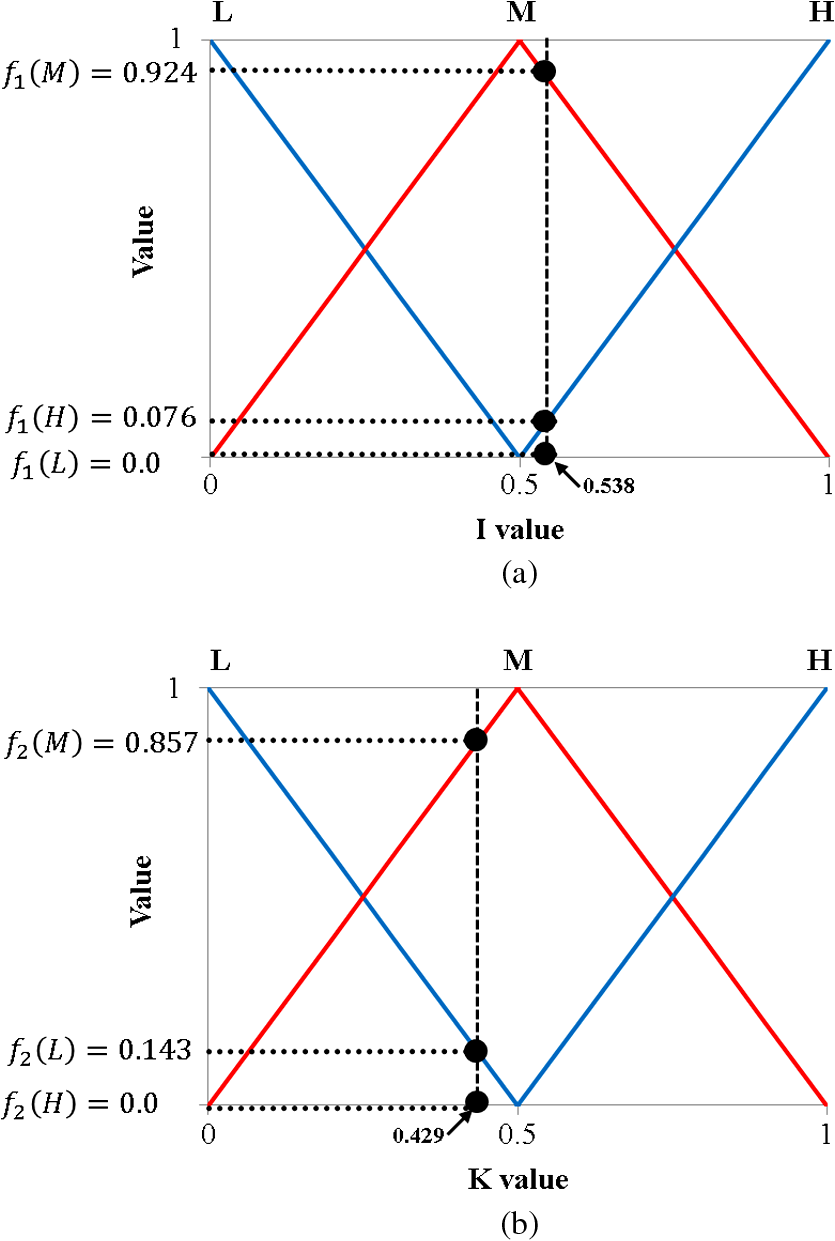 Table 3Illustration of nine combinations of output values and the determined IV by Min or Max rule.
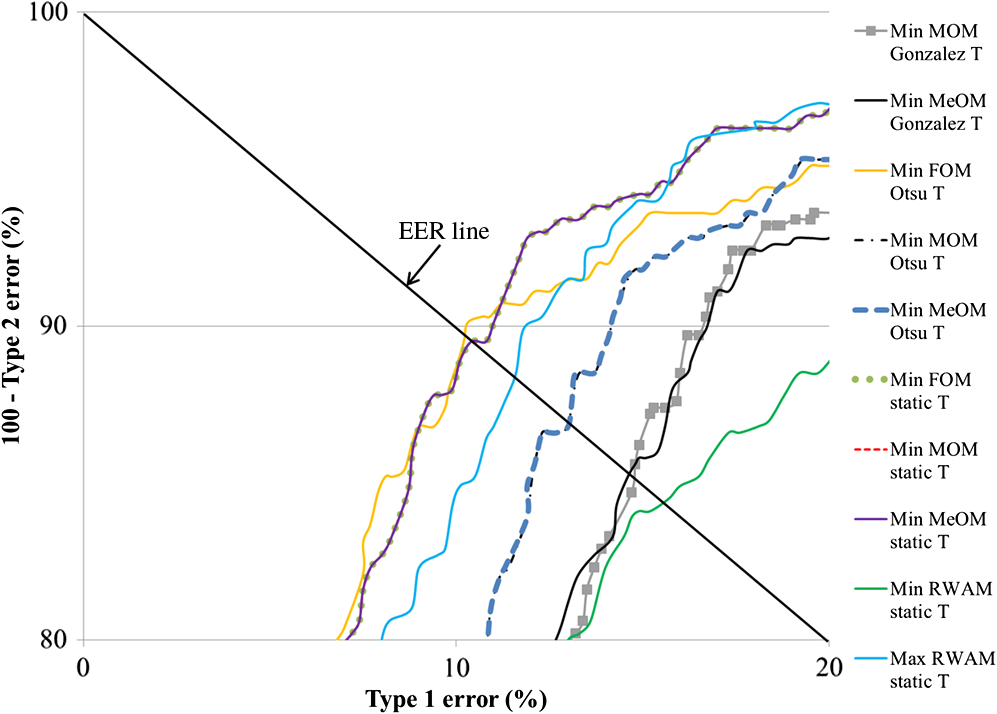
Then, based on the Min or Max rule and Table 2, we can obtain the output values.32–34 For example, in the first row of Table 3, [, ] are 0.0 () and 0.143 (), respectively. We take 0.0 and 0.143, respectively, if we use the Min and Max rule.32–34 According to the fuzzy rule of Table 2, and become . Therefore, we can finally obtain 0.0 () and 0.143 (), respectively, by the Min and Max rule, as shown in Table 3. For convenience, we call these values of 0.0 () and 0.143 () as IVs in our paper.32–34 Like this method, we can obtain the nine IVs as shown in Table 3. Then, the final output score can be calculated using the defuzzification method.32–34,35 Detail explanations of the defuzzification method are as follows with Fig. 5. Fig. 5Illustration of the defuzzification methods used in this study: (a) first of maxima (FOM), last of maxima (LOM), middle of maxima (MOM), and mean of maxima (MeOM) and (b) weighted average method. 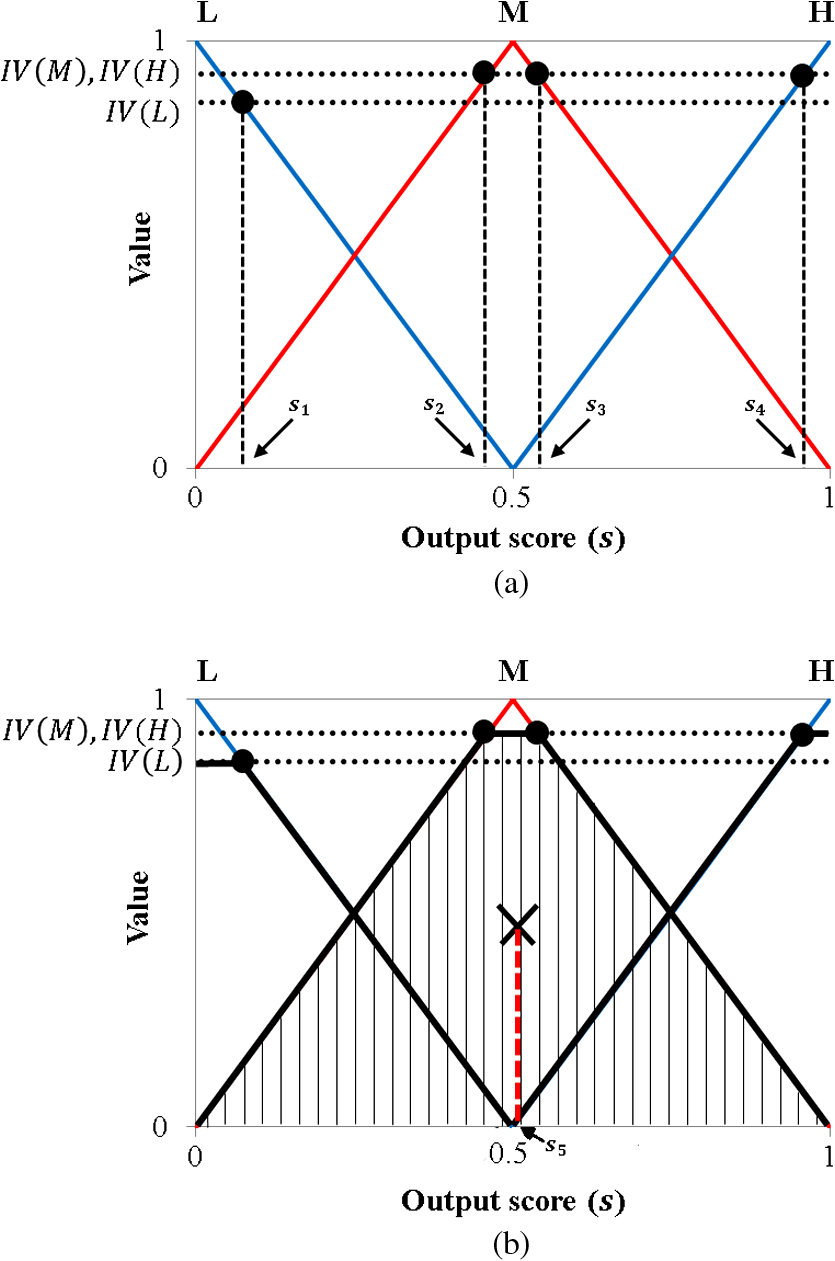 Figure 5 illustrates a number of defuzzification operators. In this study, we consider five defuzzification operators as follows.32–34 Figure 5(a) shows the first of maxima (FOM) operator, which is represented as the smallest output score () obtained by the biggest IVs [ and ]. The last of maxima (LOM) returns the biggest output score () obtained by the biggest IVs [ and ]. To obtain a result using the middle of maxima (MOM) operator, we take the average of the output scores by FOM and LOM as []. The mean of maxima (MeOM) operator is the average of all the output scores by the biggest IVs [ and ] as []. In the original weighted average method, the output score () is calculated by the weighted average method with the rectangles of , , and of Fig. 5(b).35 Although the nine IVs are obtained by the Min or Max rule as shown in Table 3, the original weighted average method considers the rectangular regions defined only by the maximum IVs of each membership function [, , of Fig. 5(b)], which cannot reflect the effect of other IVs. Therefore, we use RWAM, where all the rectangular regions by all the IVs are considered for calculating the output score. The output scores given by defuzzification range from 0 to 1, and we rescale them from 0 to 255 by multiplying by 255. From that, we can obtain the eye image by the defuzzification method. As shown in Fig. 6, different images are produced depending on the selected defuzzification operator, Min or Max rule. Fig. 6Comparisons of images by fuzzy system: (a) original image; (b) by Min rule with FOM; (c) by Min rule with LOM; (d) by Min rule with MOM; (e) by Min rule with MeOM; (f) by Min rule with revised weighted average method (RWAM); (g) by Max rule with FOM; (h) by Max rule with LOM; (i) by Max rule with MOM; (j) by Max rule with MeOM; (k) by Max rule with RWAM.  Examining the images in Fig. 6, we can find certain characteristics. There are the images where the eye regions can be more separable from other areas than the original image, like Figs. 6(b), 6(d), and 6(e). Therefore, in order to classify eye openness and closure, we transform the output image by the fuzzy system of Fig. 6 into the binarized one as shown in Fig. 7. We compared the performances of various binarization methods as shown in Tables 4 and 5 with Figs. 10 and 12. Fig. 7Results of postprocessing step in the case of open eye: (a) by Min rule with FOM; (b) binarized image of (a); (c) result by component labeling and size filtering of (b); (d) vertical histogram of (c). 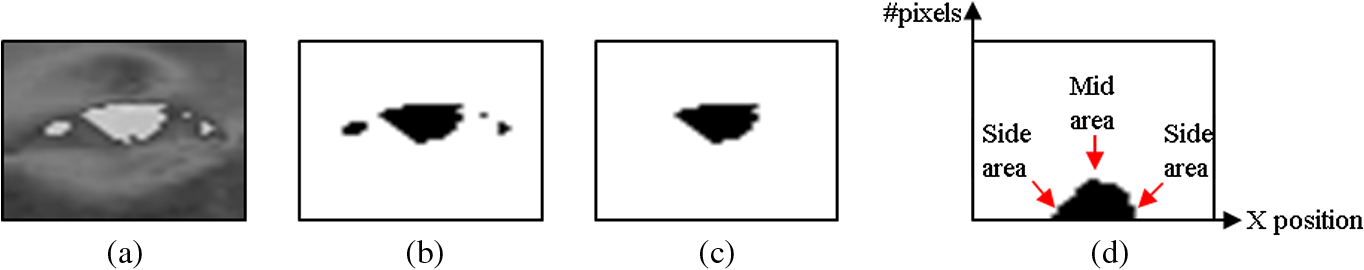 Table 4Classification results table of eye openness and closure using database I (unit: %) (The smallest equal error rate is shown in bold type).
FOM, first of maxima; LOM, last of maxima; MOM, middle of maxima; MeOM, mean of maxima; RWAM, revised weighted average method. Table 5Classification results for eye openness and closure using database II (unit: %) (The smallest equal error rate is shown in bold type).
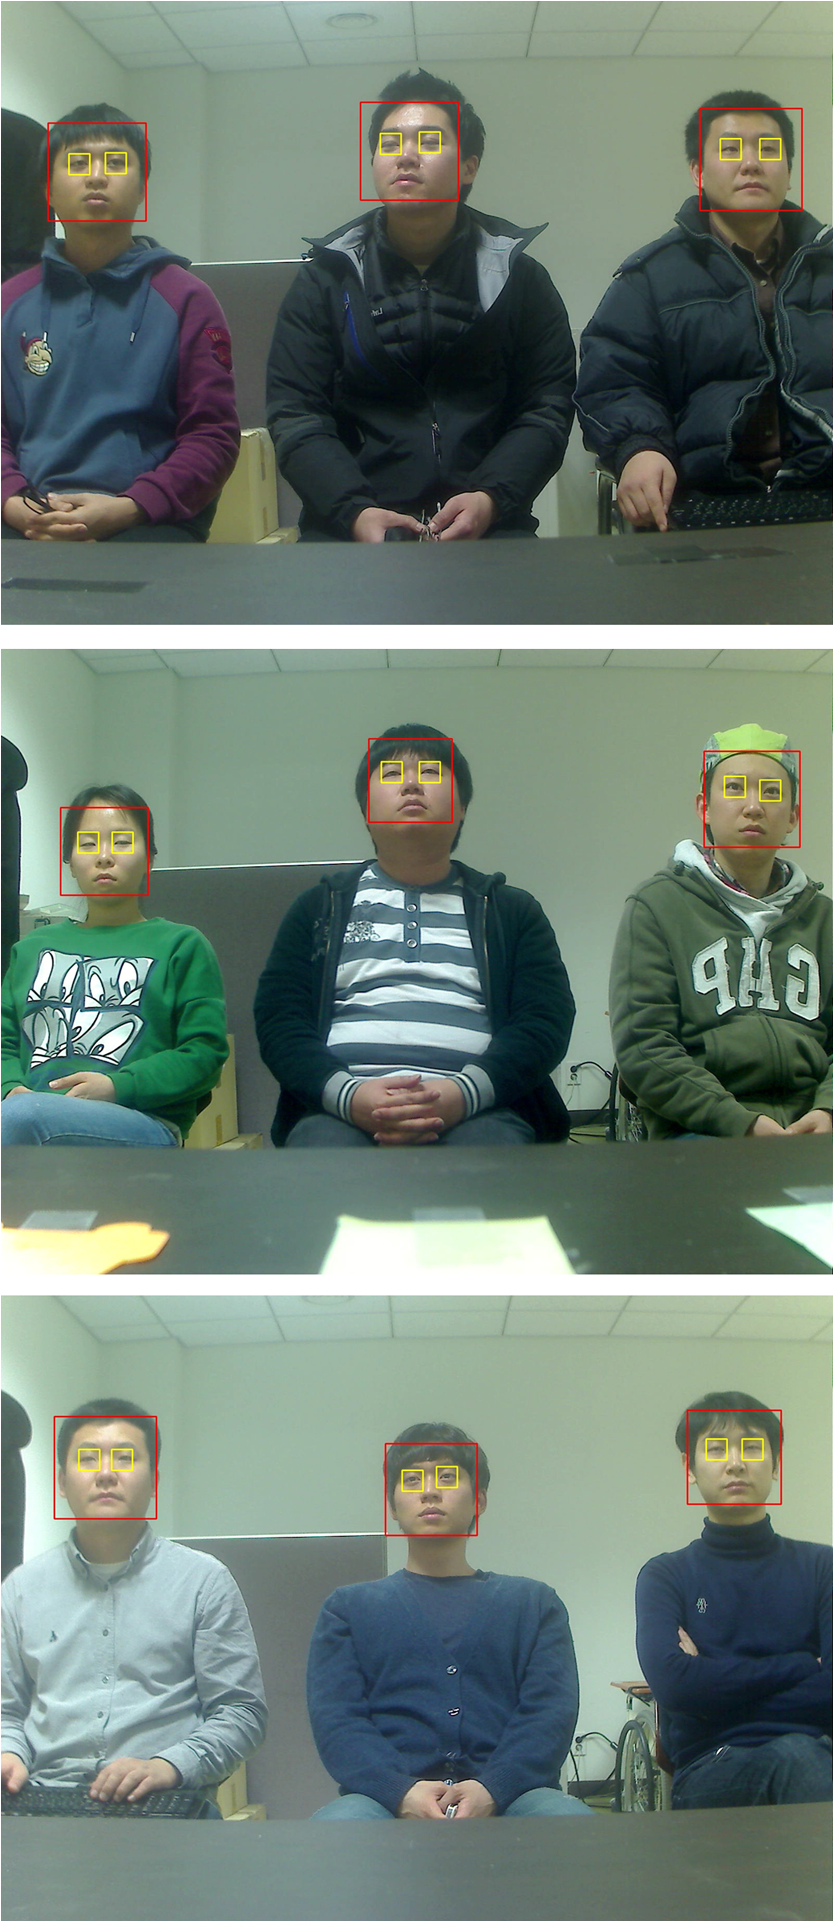
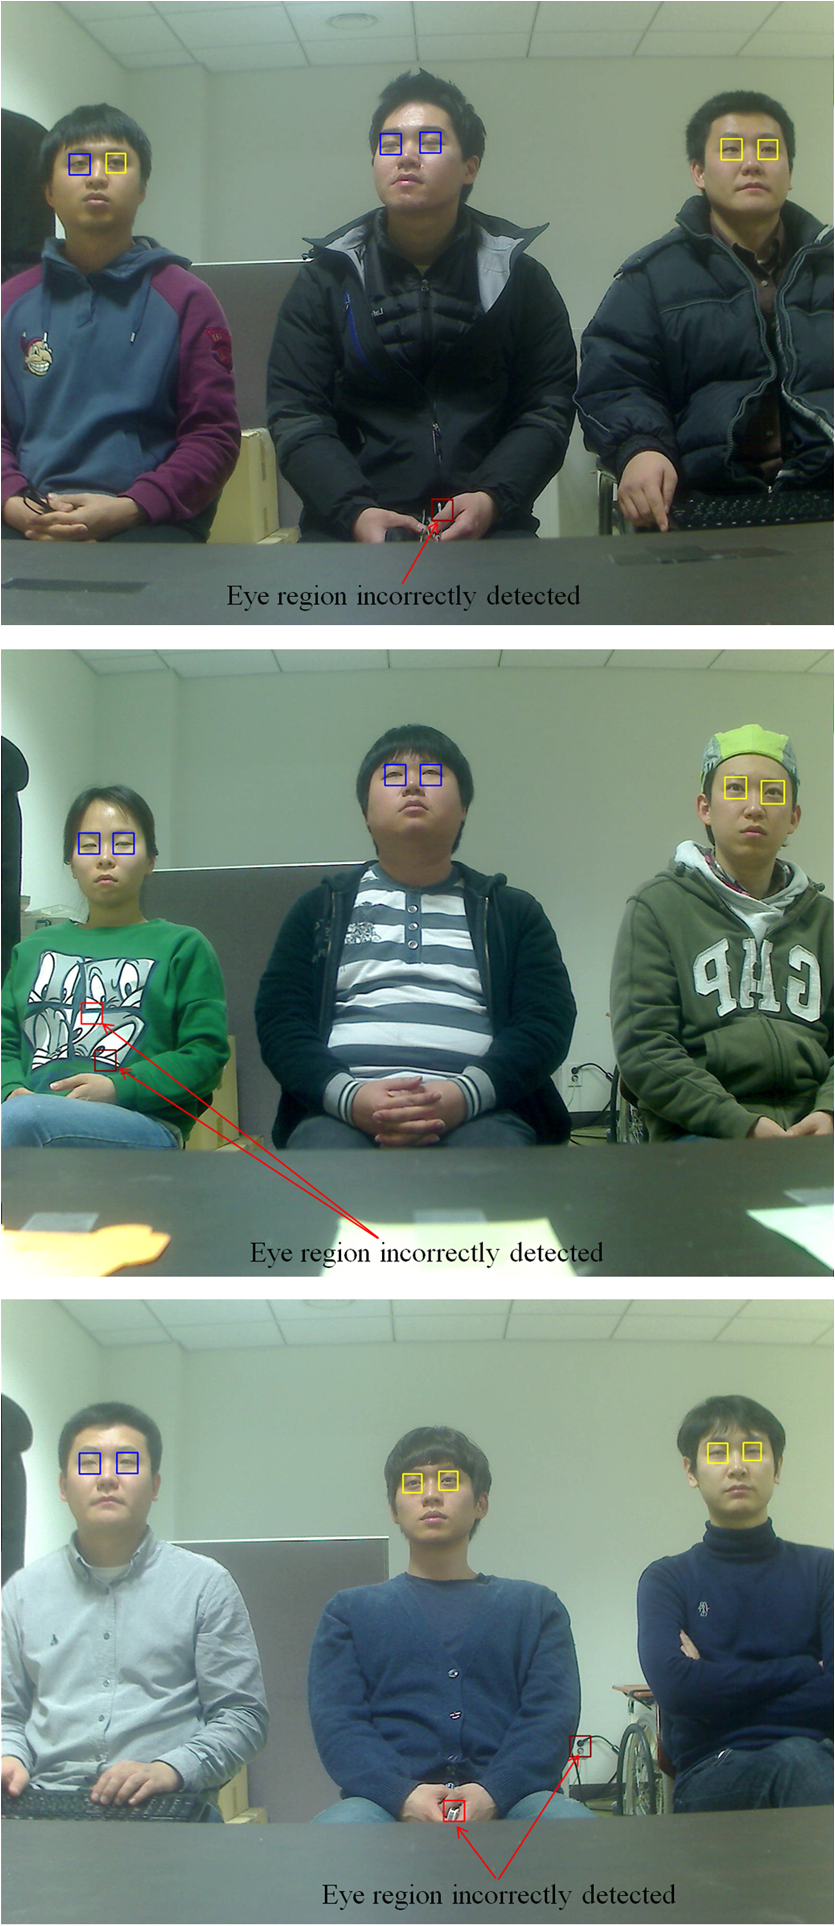
Fig. 8Results of postprocessing step in the case of closed eye: (a) by Min rule with FOM; (b) binarized image of (a); (c) result by component labeling and size filtering of (b); (d) vertical histogram of (c). 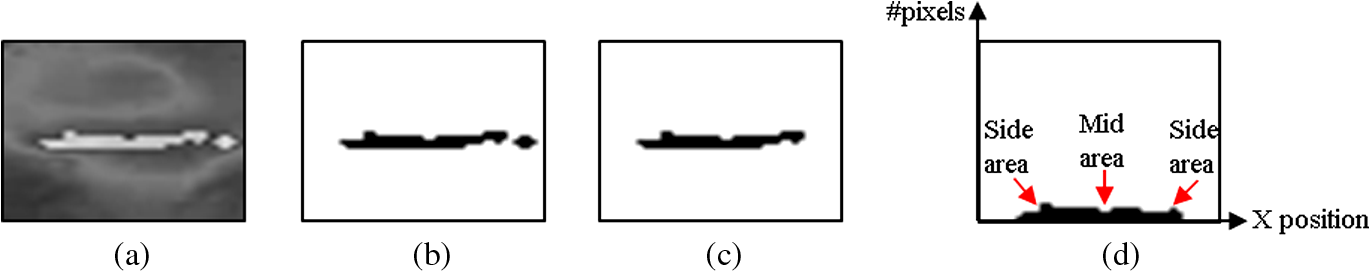 Fig. 9Experimental setup and collected images: (a) experimental setup; (b) collected images (left image is the original one captured at the Z distance of 2 m, and right three images are the cropped face ones from the left image); (c) collected images (left image is the original one captured at the Z distance of 2.5 m, and right three images are the cropped face ones from the left image). 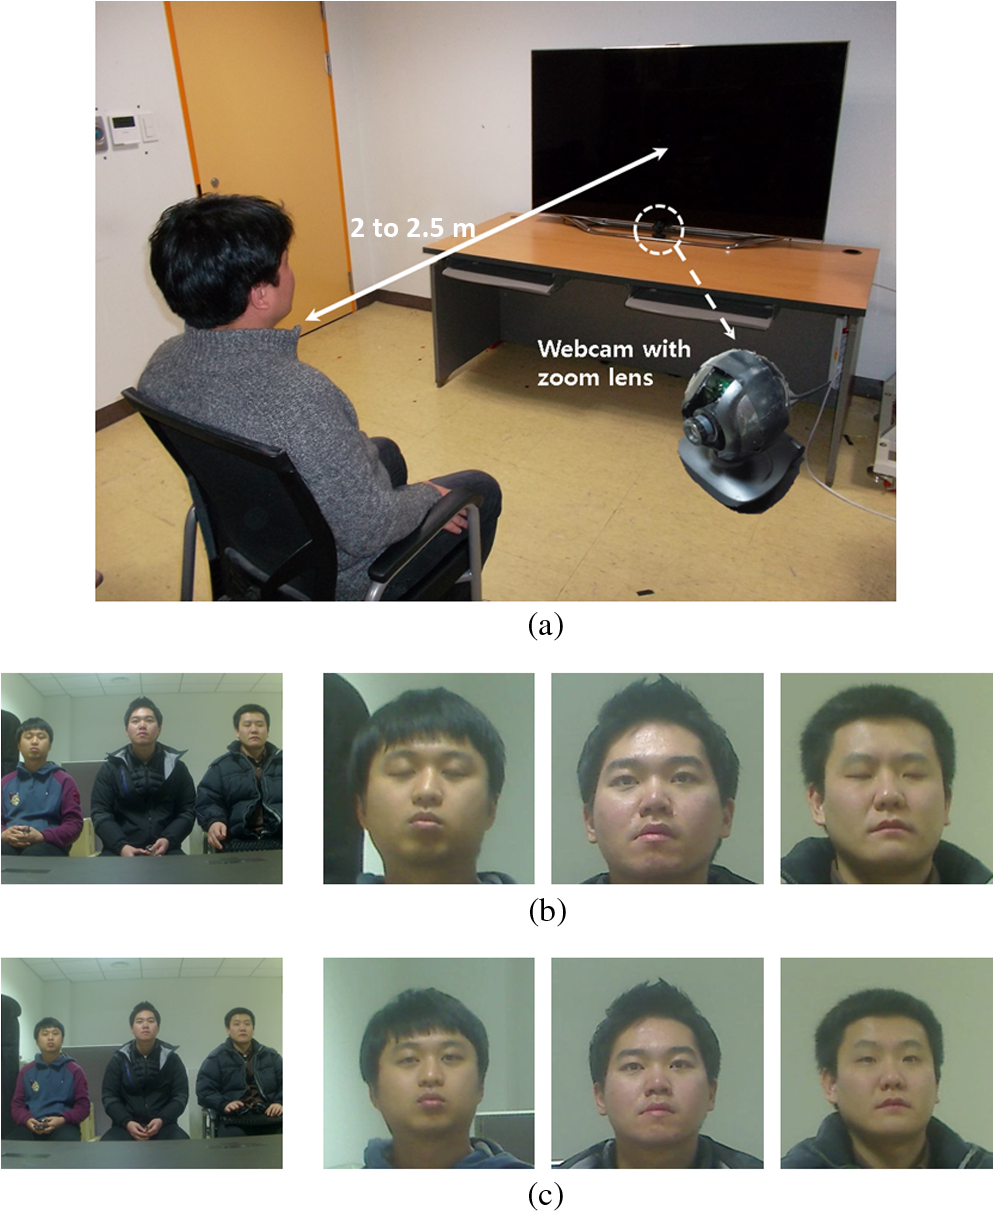 2.4.Classifying Eye Openness and Closure from a Binary Eye ImageWith the binarized image, we perform component labeling. Figure 7(a) shows the image resulting from the Min rule with FOM. The image is easy to separate into regions of eye and skin. Figure 7(b) is a binarized one of Fig. 7(a) by static threshold. As shown in Fig. 7(c), we eliminate small noise areas using component labeling. Next, we obtain the biggest area from the binarized blobs as the eye region. With the binarized image of Fig. 7(c), we can obtain the vertical histogram as shown in Fig. 7(d). As shown in Fig. 7(d), the mid area of the histogram shows a higher value, whereas the side ones show a lower value in the case of an open eye. However, both the mid and side areas of the histogram show the low value in the case of a closed eye as shown in Fig. 8. Based on these, we use the standard deviation of the histogram (the length of the black pixels in the vertical direction) as the features for classifying open and closed eyes. If the standard deviation is above a specific threshold, we determine the state of the eye as openness. Otherwise, the eye is assumed to be closed. 3.Experimental Results3.1.Experimental Results with Database ITo experimentally verify our classification method for eye openness and closure, we collected 6336 open eye images and 6294 closed eye images (database I). We captured the images from a distance of 2 to 2.5 m in an indoor environment, where each person watched TV at a distance. The images of database I were obtained using a Logitech C600 web camera equipped with a zoom lens, and the image resolution is .36 The camera is positioned below the TV. Figure 9 shows the experimental setup and the examples of collected images. To measure the accuracy of the classification of eye openness and closure, we conducted two experiments without and with our fuzzy-based method. As explained in Sec. 2.4, the image is binarized after the fuzzy-based fusion of and images in our research. Therefore, we compared three binarization methods: Gonzalez algorithm,37 Otsu algorithm,38 and static threshold29 in the same image by the fuzzy-based method for fair comparisons. Table 4 lists the complete set of results. We compared the equal error rate (EER) of all methods. The EER is calculated as the error rate at the moment when the type 1 error is most similar to the type 2 error. The type 1 error indicates the error rate of open eye images being incorrectly determined as closed eye images. The type 2 error denotes the error rate of closed eye images being incorrectly determined as open eye images. In the cases of the Min rule with LOM using Gonzalez method and the Max rule with RWAM using Gonzalez method, there exists a large difference between the EER and type 1 (type 2) error. That is because the type 1 and 2 error cases do not occur continuously according to the change of threshold for discriminating open and closed eyes. As the results show, the lowest EER values were obtained by the Min rule with FOM, Min rule with MOM, and Min rule with MeOM using a static threshold through the fuzzy system. From these, we can confirm that the proposed method is superior to others. Figure 10 shows the receiver operating characteristic (ROC) curves for the 10 highest ranked EER results obtained from Table 4. As shown in Fig. 10, the Min rule with FOM and static threshold, Min rule with MOM and static threshold, and Min rule with MeOM and static threshold outperformed the other methods. In case of the images by the Min rule with FOM, Min rule with MOM, and Min rule with MeOM, the same images are obtained through the binarization with static threshold, and consequent ROC curves for classifying the eye openness and closure are same as shown in Fig. 10. Fig. 10Receiver operating characteristic (ROC) curves for the 10 highest ranked equal error rate (EER) results from Table 4. 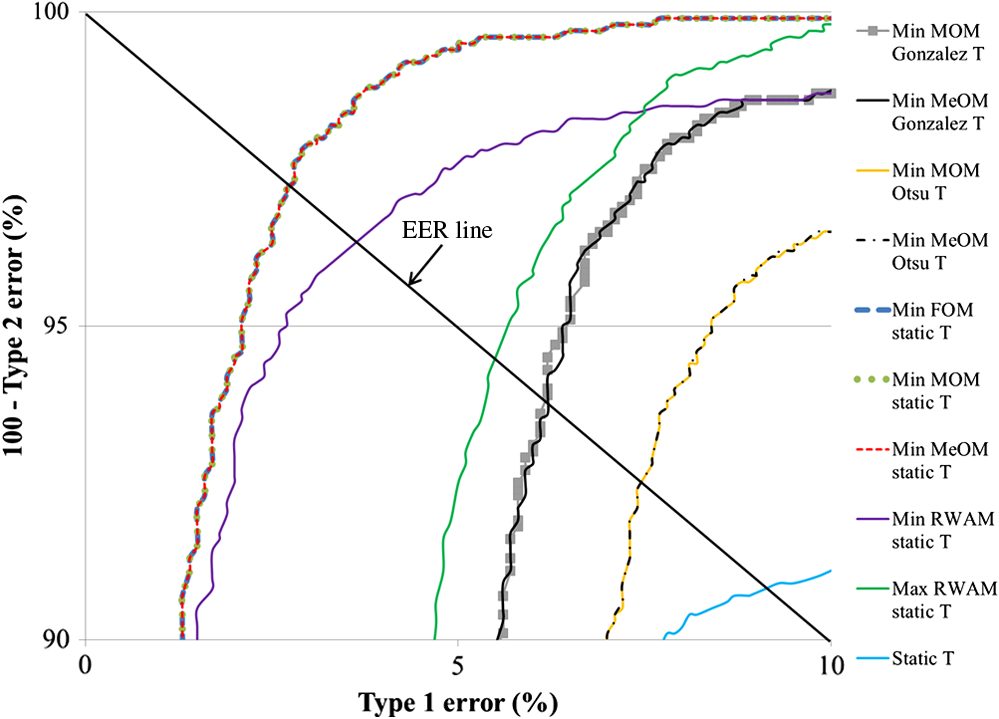 3.2.Experimental Results with Database IIIn order to measure the effect of the kind of database on the performance of our method, we conducted a further experiment on the classification of eye openness and closure using an open database (ZJU Eyeblink Database).39 This database has 80 video clips with a resolution of . We used 20 of these video clips excluding the clips of wearing glasses and the images where eye detection failed. The resulting image set contained a total of 5376 images, with 4891 open eye images and 485 closed eye images (database II). Figure 11 shows the examples of images from open database. Table 5 presents the EER results obtained from database II. The EER results of the methods using our fuzzy system are better than those given by other methods. In the cases of the Min rule with LOM using the Gonzalez method and the Max rule with RWAM using the Gonzalez method, there exists a large difference between the EER and type 1 (type 2) error. That is because the type 1 and 2 error cases do not occur continuously according to the change of threshold for discriminating open and closed eyes. Figure 12 shows the ROC curves for the 10 highest ranked EER results obtained from Table 5. Although the EER by the Min rule with FOM and Otsu method is lowest as shown in Table 5, Fig. 12 shows that the overall accuracies by the Min rule with FOM and static threshold, Min rule with MOM and static threshold, and Min rule with MeOM and static threshold are highest in terms of the ROC curves such as the results of Fig. 10. From Fig. 12, we can confirm that the proposed fuzzy-based method outperformed other methods. In case of the images by the Min rule with FOM, Min rule with MOM, and Min rule with MeOM, the same images are obtained through the binarization with a static threshold, and the consequent ROC curves for classifying the eye openness and closure are same as shown in Fig. 12. 3.3.Experimental Results AnalysisFigure 13 shows the images that resulted in good classification of eye openness and closure with database I. As shown in the images of Fig. 13(d), the result images of open eye are shown as discriminated from those of closed eye, and the consequent feature values [standard deviations of histogram (the lengths of the black pixels in the vertical direction)] of the open eye are larger than those of the closed eye. Therefore, the open eye can be discriminated from the closed eye. Fig. 13Images of good classification results (database I): (a) original images, (b) images by Min rule with FOM and static threshold, (c) binarized images of (b), (d) component labeling results of (c). (The left three images of each row are open eyes, whereas the right three ones are closed eyes). 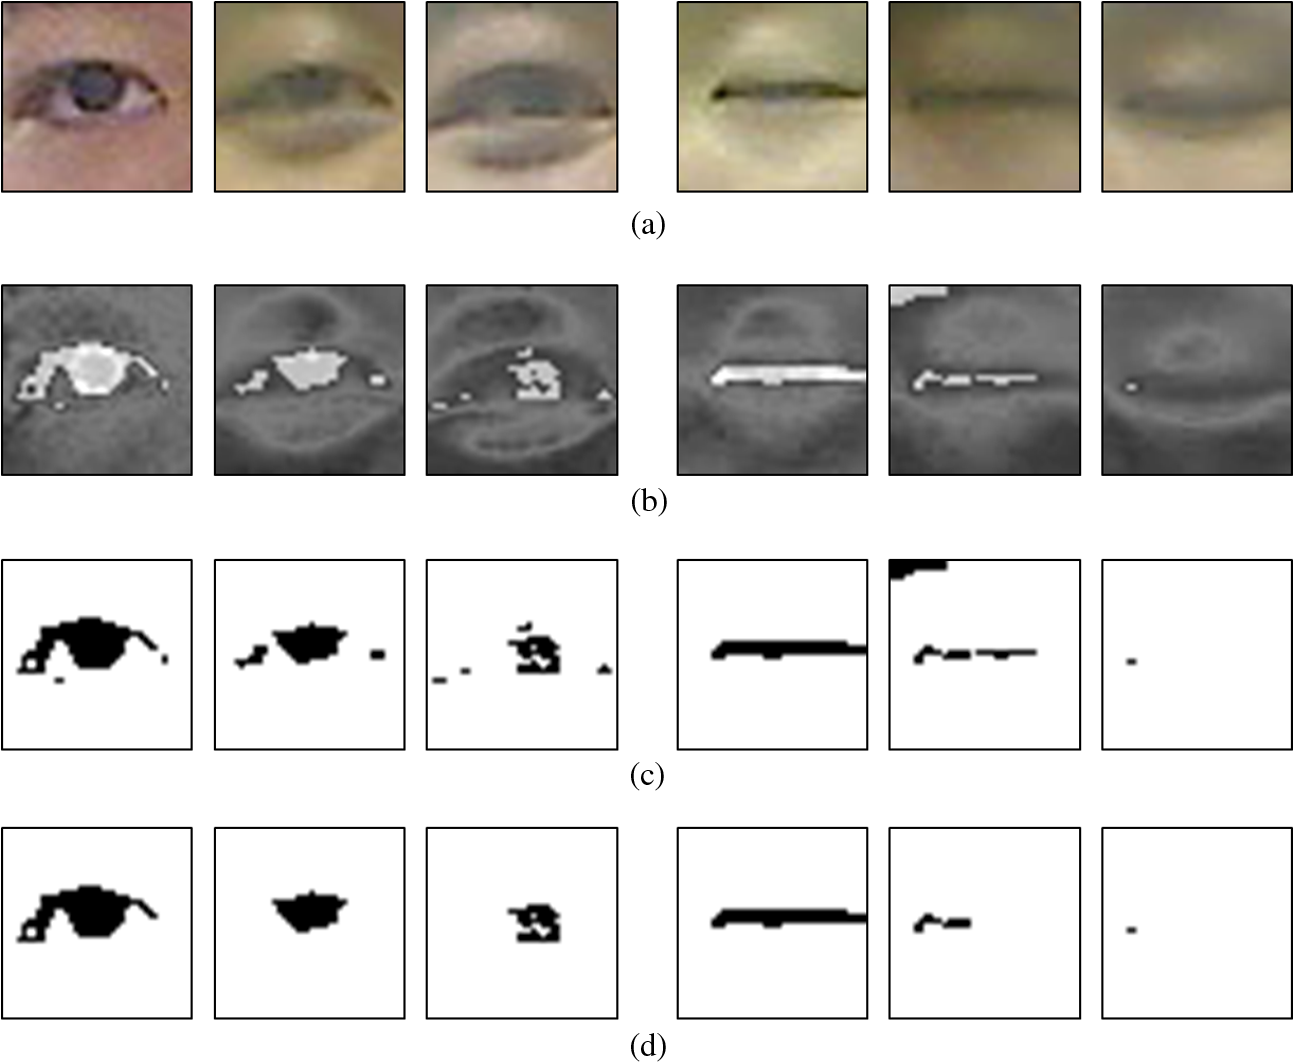 Figure 14 shows the images that resulted in bad classification of eye openness and closure with database I. In the case of open eye images, bad classification occurred when the eye image is too blurred [the first and second images of the left three ones of Fig. 14(a)], or when reflections exist in the eyeball [the third image of the left three ones of Fig. 14(a)]. Fig. 14Images of bad classification results (database I): (a) original images, (b) images by Min rule with FOM and static threshold, (c) binary images of (b), (d) component labeling results of (c). (The left three images of each row are open eyes, whereas the right three ones are closed eyes).  In the case of closed eye images, bad classification was due to image blurring [the first image of the right three ones of Fig. 14(a)], incorrect detection of eye region [the second image of the right three ones of Fig. 14(a)], or the incorrect selection of eyebrow by component labeling [the third image of the right three ones of Fig. 14(a)]. Figure 15 shows the images that resulted in good classification of eye openness and closure with database II. As shown in the images of Fig. 15(d), the result images of the open eye are shown as discriminated from those of the closed eye, and consequent feature values [standard deviations of histogram (the lengths of the black pixels in the vertical direction)] of the open eye are larger than those of the closed eye. Therefore, the open eye can be discriminated from the closed eye. Fig. 15Images of good classification results (database II): (a) original images, (b) images by Min rule with FOM and static threshold, (c) binarized images of (b), (d) component labeling results of (c). (The left three images of each row are open eyes, whereas the right three ones are closed eyes). 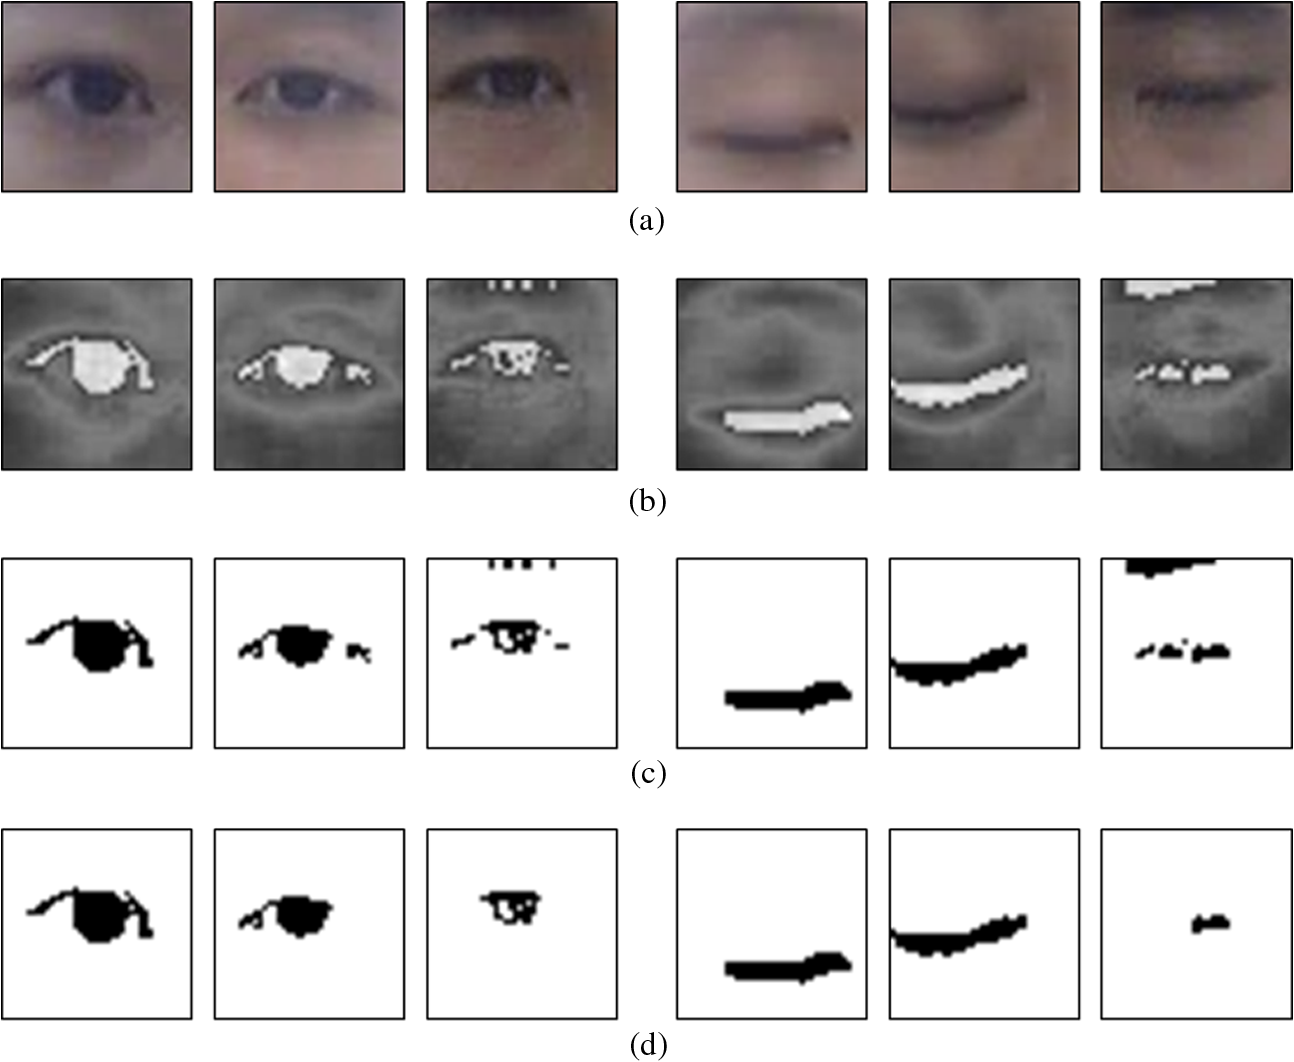 Figure 16 shows the images that resulted in bad classification of eye openness and closure with database II. In the case of open eye images, bad classification occurred when eyelid pixels were disconnected by image blurring [the first image of the left three ones of Fig. 16(a)], the eye is not widely opened and the eyebrow is incorrectly selected by component labeling [the second image of the left three ones of Fig. 16(a)], or the eye image is too dark [the third image of the left three ones of Fig. 16(a)]. Fig. 16Images of bad classification results (database II): (a) original images, (b) images by Min rule with FOM and static threshold, (c) binary images of (b), (d) component labeling results of (c). (The left three images of each row are open eyes, whereas the right three ones are closed eyes). 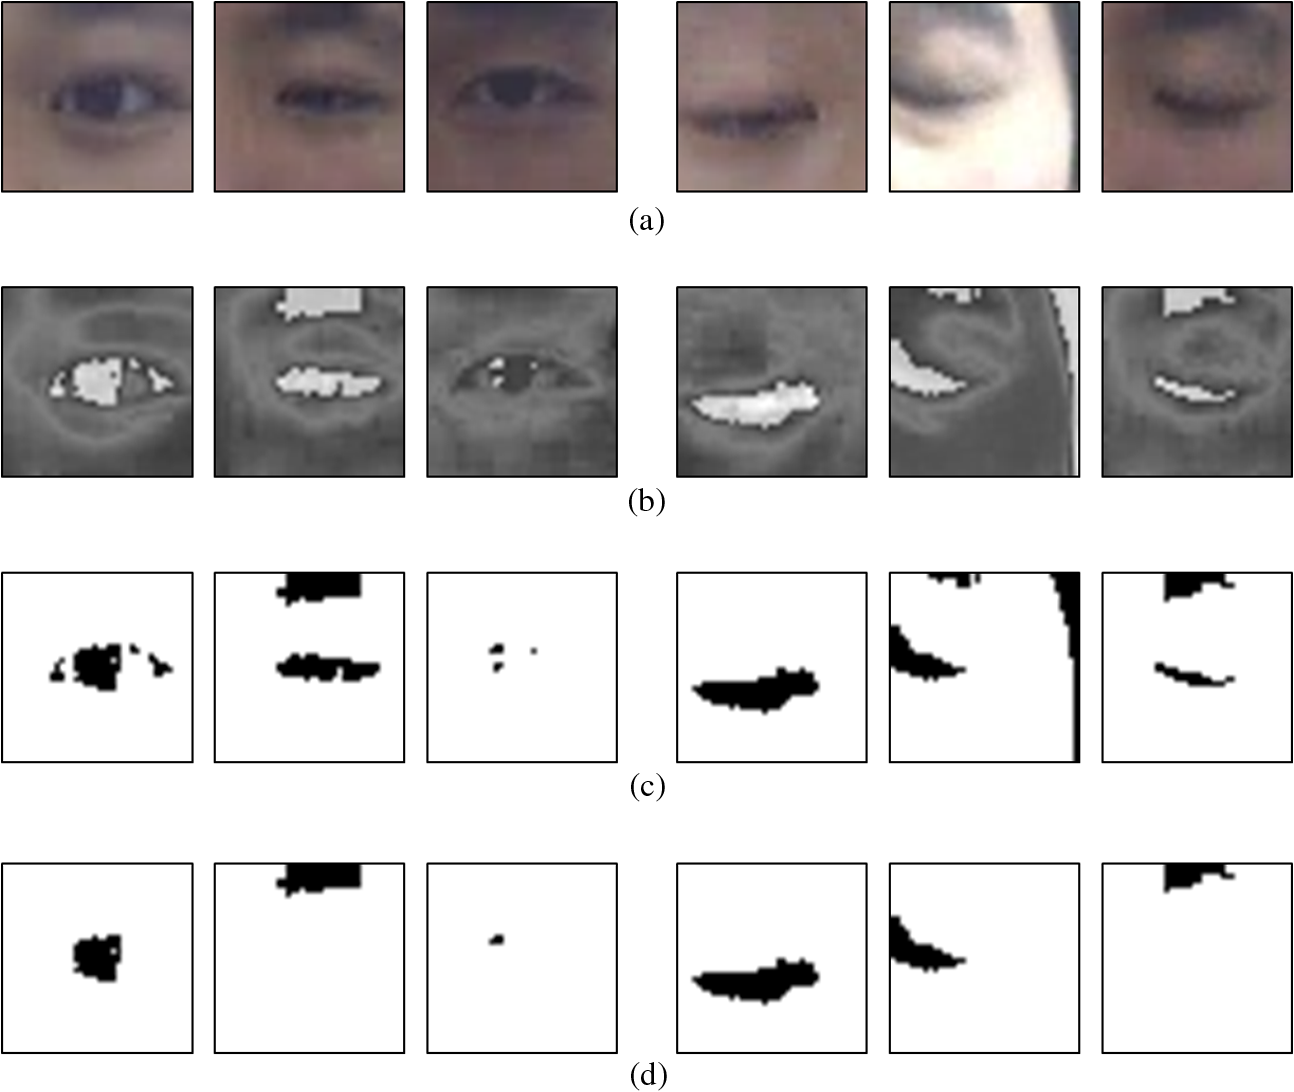 In the case of closed eye images, bad classification happens when the eye is not completely closed [the first image of the right three ones of Fig. 16(a)], the eye region is not correctly detected [the second image of the right three ones of Fig. 16(a)], or the eye image is too dark and the eyebrow is incorrectly selected by component labeling [the third image of the right three ones of Fig. 16(a)]. It is usually difficult to evaluate the accuracy of eye segmentation because all the pixels of an accurate eye region should be manually obtained as the ground-truth data. Therefore, in our research, we measured good and bad responses of Figs. 13–16 based on the error of classifying eye openness and closure in Tables 4 and 5. That is, the good response means that the open or closed eye is correctly classified as an open or closed one, respectively, by our method. The bad response means that the open or closed eye is incorrectly classified as a closed or open one, respectively, by our method. As shown in Eqs. (1) and (2), is obtained by averaging , , and , whereas is obtained by selecting the maximum value among , , and , and subtracting it from 1. For example, in the case of a gray pixel of medium level, we can assume that , , and are 1, 0.5, and 0, respectively, if the range of , , and is from 0 to 1, respectively. From that, of Eq. (1) is 0.5 (), whereas of Eq. (2) is 0. In the case of white (), I is 1 (), whereas is 0. Furthermore, in the case of black (), is 0 (), whereas is 1. By comparing these three cases, the gray pixel of the medium level (, , ) is represented as the white in value (). whereas it is the gray pixel of the medium level in the value (). The gray level of the surrounding skin of an eye can be regarded as the gray pixel of the medium level because its gray level is lower than the bright sclera and higher than the dark eyeball as shown in Fig. 17(a). Therefore, has the effect of making the gray pixel of the surrounding skin of eye close to white while maintaining the level of the dark eyeball. Consequently, the contrast between the surrounding skin of an eye and the dark eyeball in the image is increased more than that in the image, which can enhance the accuracy of segmenting the eyeball from the area of surrounding skin of the eye. Fig. 17Comparisons of binarization with , , and the image from our fuzzy-based method in the case of a large number of eyelashes in the original image: (a) original images of open and closed eyes, (b) an open eye, and (c) a closed eye. 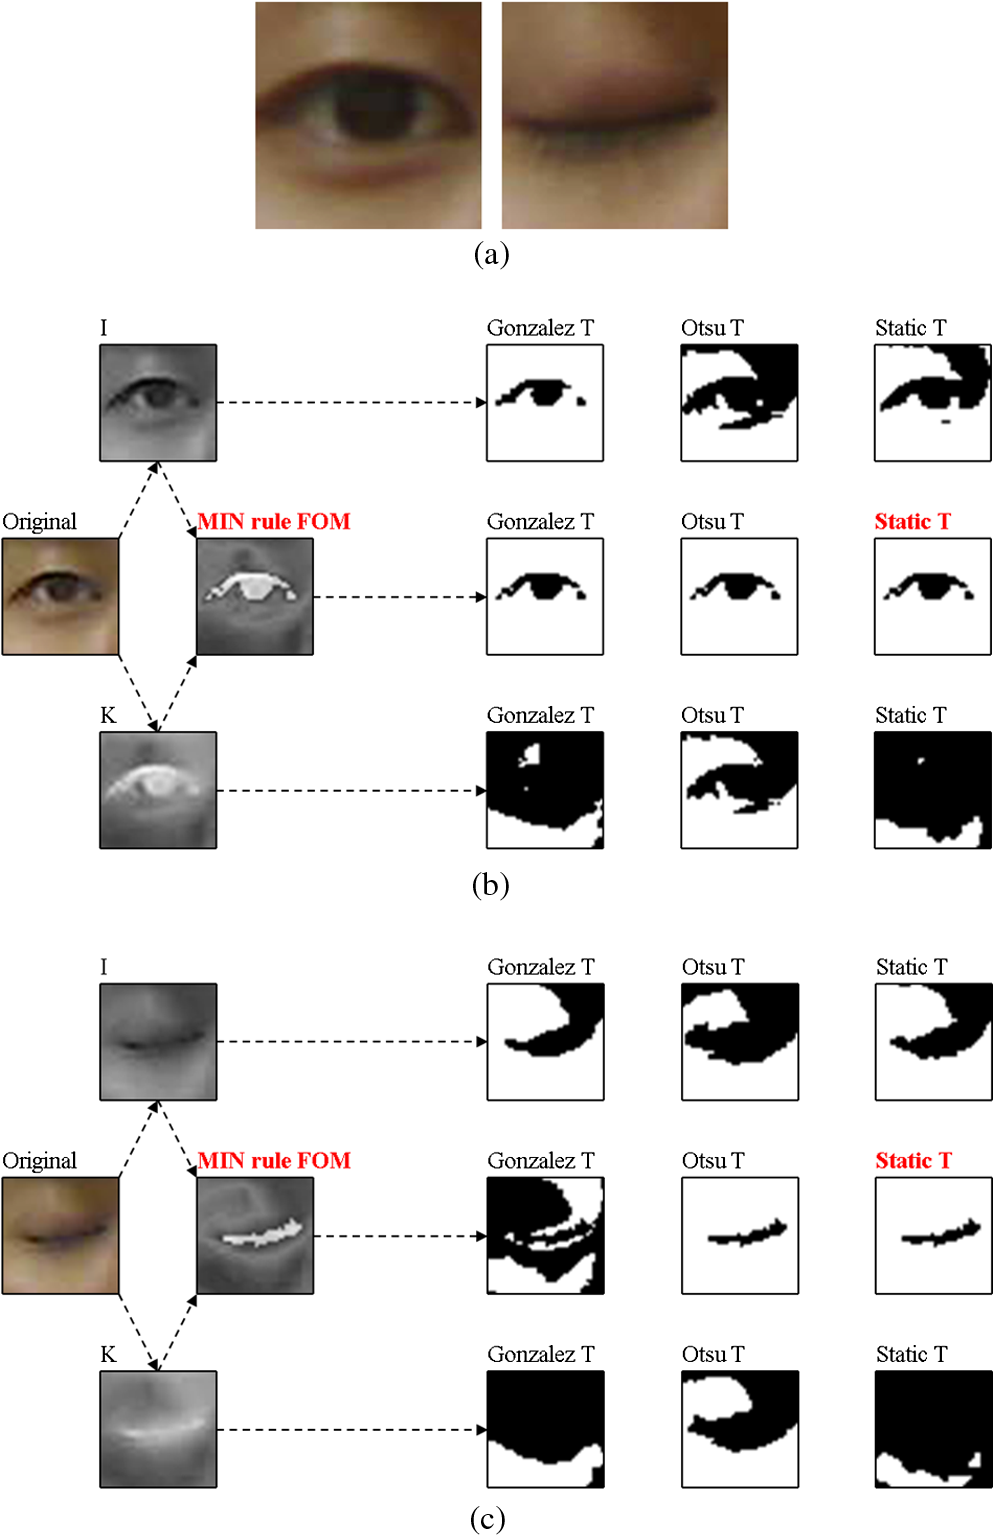 However, the image has the disadvantage of making the gray pixel of the eyelid, eyelashes, and shadows (whose gray levels are also higher than the dark eyeball) close to white, which can cause the eyelid line to be erroneously segmented from the surrounding skin of the eye. Therefore, we combine the and images using a fuzzy method, which enhances the advantages of both (less affected by eyelid, eyelashes, and shadows) and (enhancing the contrast between the eyeball and surrounding skin of eye). Thus, we can improve the final accuracy of the eye segmentation and the determination of whether the eye is open or closed, which is less affected by eyelashes and shadows based on fuzzy-based combining method. We included experiments to show that these claims are correct as follows. Figures 17 and 18 show the comparisons of binarization with , , and the image from our fuzzy-based method in the case of a large number of eyelashes and shadows in the original image, respectively. We, thus, demonstrate that a more accurate binarized image of the eye region can be obtained by our fuzzy-based method (Min rule FOM) than by the or images. Fig. 18Comparisons of binarization with , , and the image from our fuzzy-based method when the shadows around the eye are included in the original image, for the cases of (a) an open eye, and (b) and (c) a closed eye. 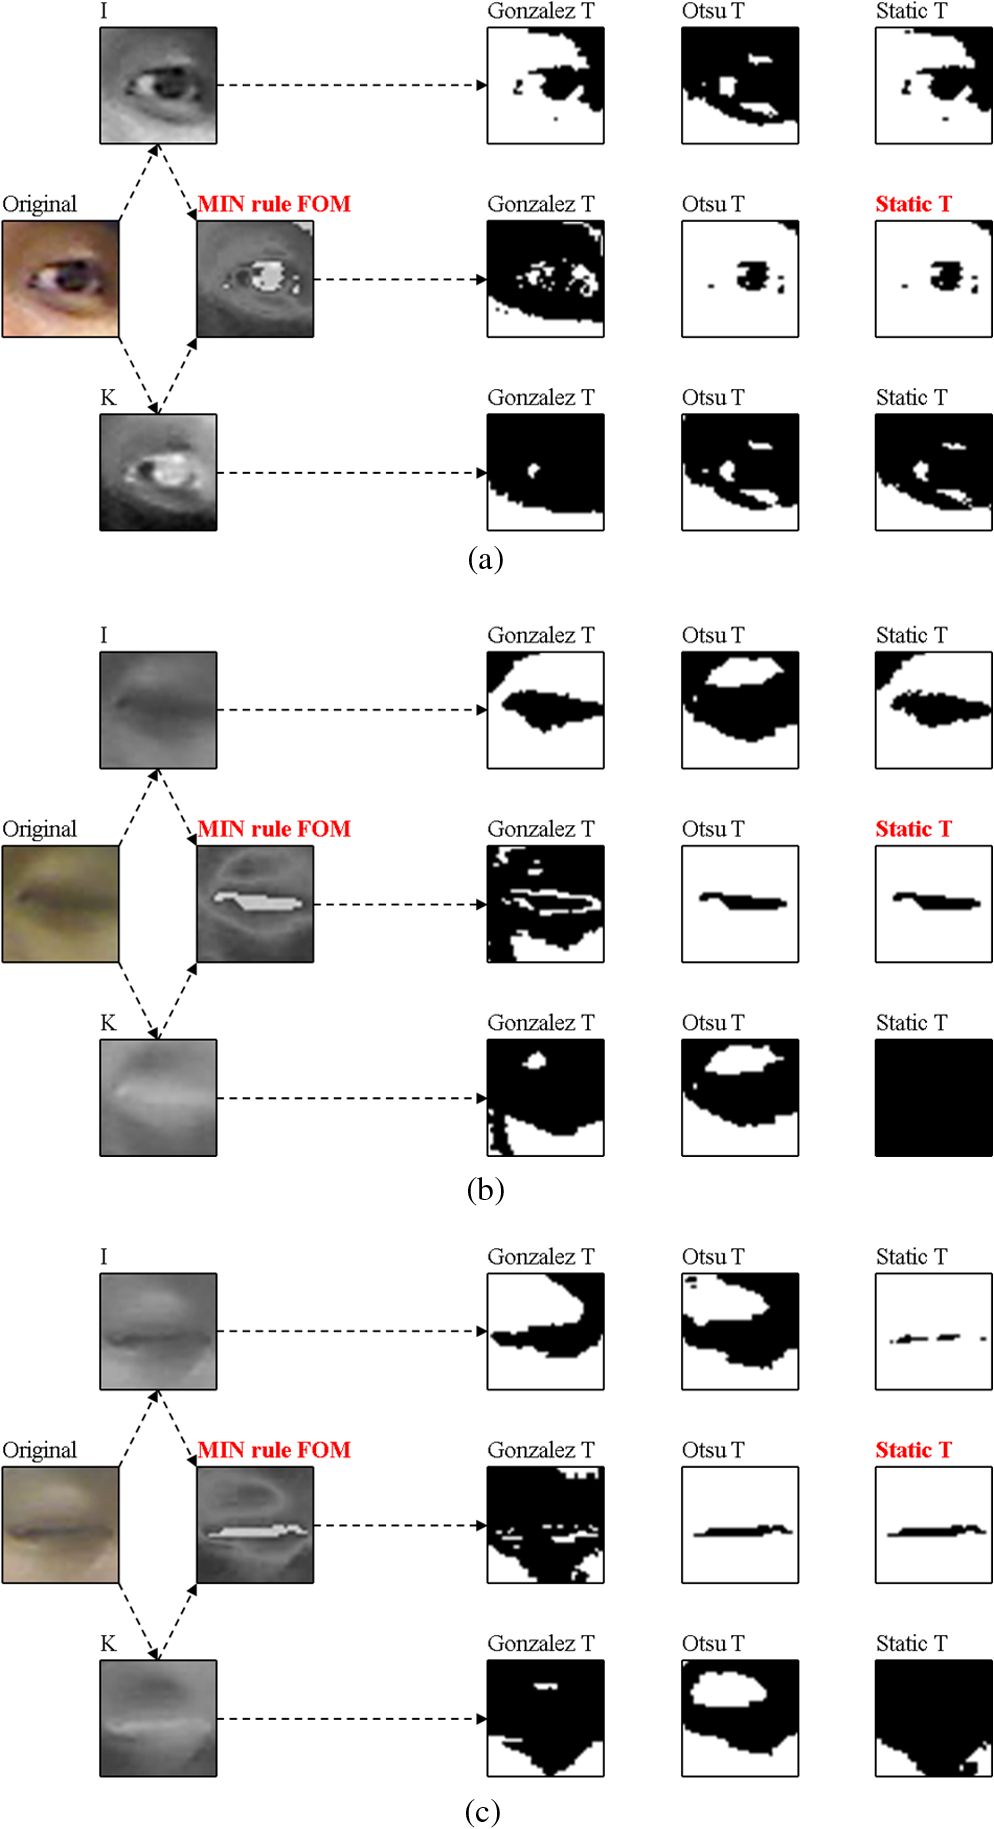 In addition, as shown in Table 4 and Fig. 10 (database I), the average EER of the classification of eye openness and closure by our fuzzy-based combination method is , which is much smaller than that obtained when not combining the and images (9.15%). In addition, as shown in Table 5 and Fig. 12 (database II), the average EER of the classification of eye openness and closure by our fuzzy-based combination method is , which is also much smaller than that obtained when not combining the and images (19.70%). Thus, we found that our fuzzy-based combination method outperforms that using either the or image without combining them. We included explanations and experiments for other races, especially African-Americans. Experiments were performed with 208 images of two African-Americans. As shown in Fig. 19, we found that a more accurate binarized image of the eye region can be obtained by our fuzzy-based method (Min rule FOM) than from the or images. In addition, the average EER of the classification of eye openness and closure by our fuzzy-based combination method is , which is similar to that of Table 4 using database I. Therefore, we concluded that our fuzzy-based combination method is robust to images of other races. Fig. 19Comparisons of binarization with , , and the image from our fuzzy-based method in the case of African-Americans: (a) original captured image, and the cases of (b) and (c) an open eye, and (d) and (e) a closed eye. 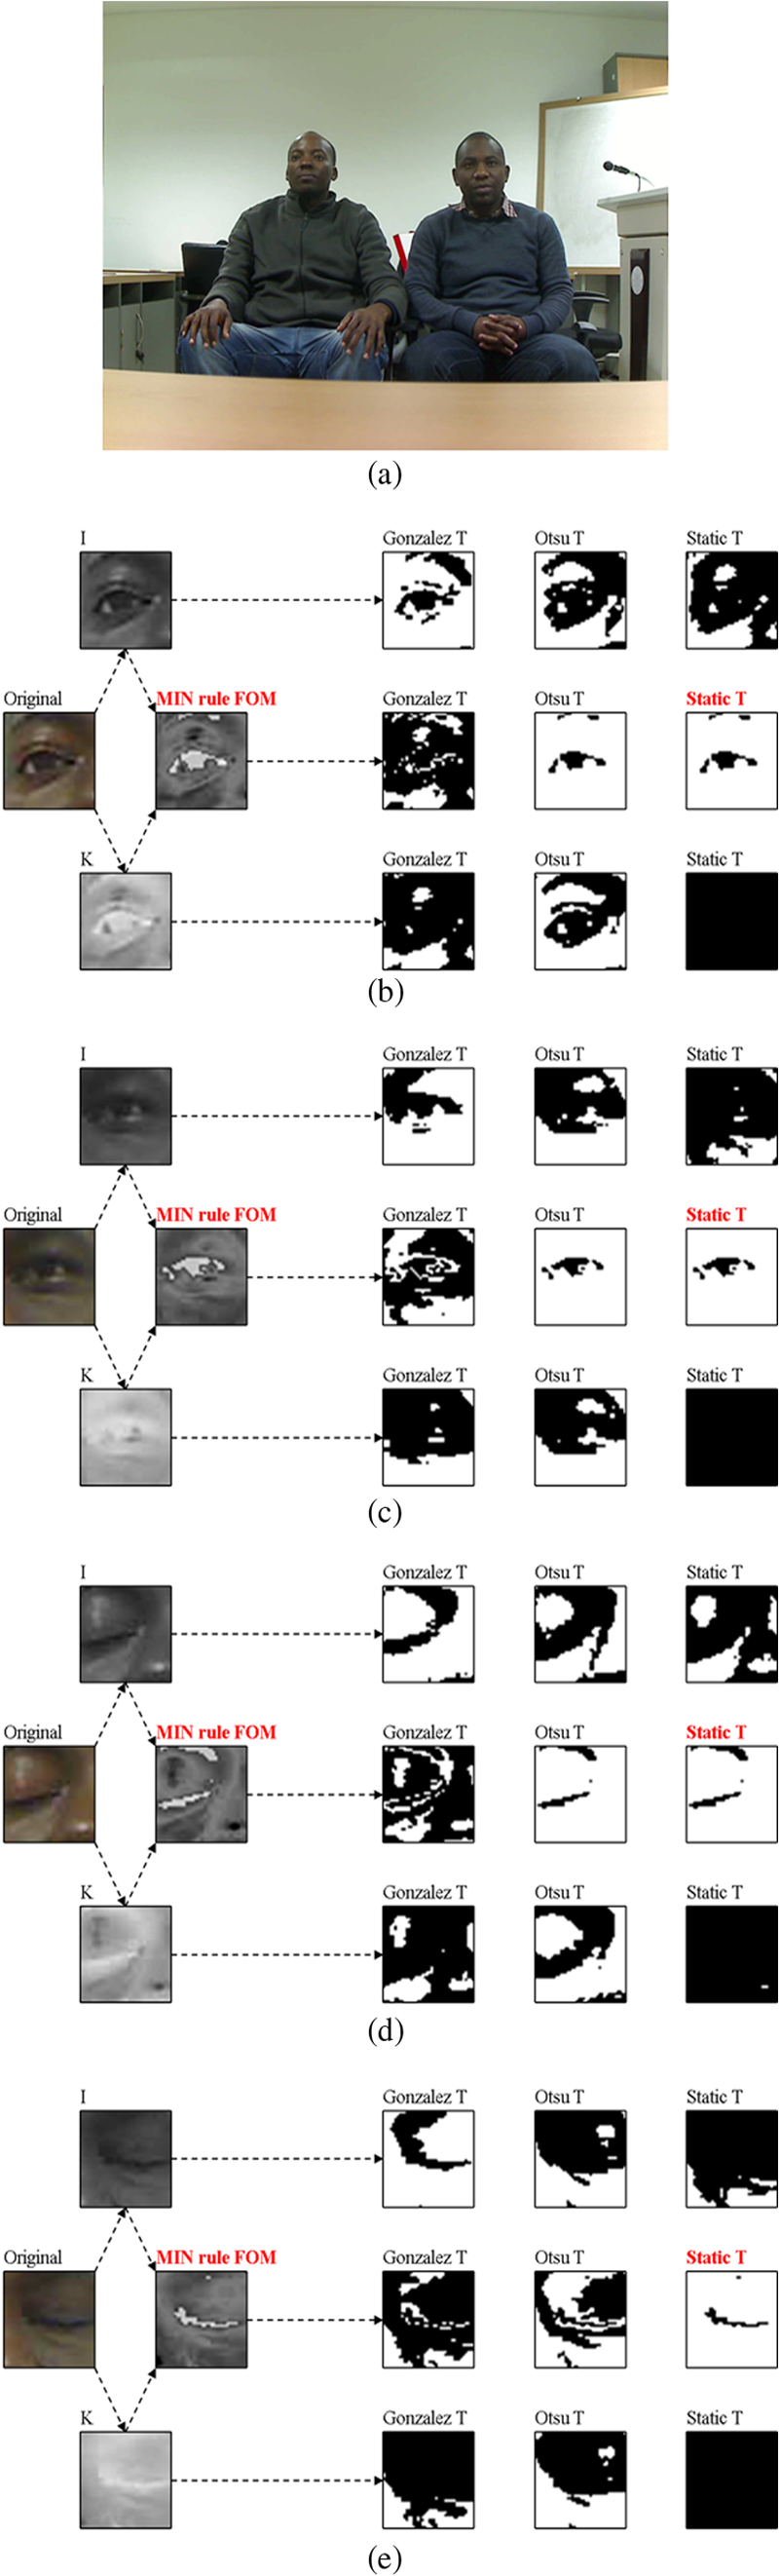 We included the explanations and experiments in the case of pose variations (head rotation). Experiments were performed with 213 images of pose variations. As shown in Fig. 20, we found that a more accurate binarized image of the eye region can be obtained by our fuzzy-based method (Min rule FOM) than from the or images. In addition, the average EER of the classification of eye openness and closure by our fuzzy-based combination method is , which is similar to that of Table 4 using database I. Thus, we found that our fuzzy-based combination method is robust to images of varying poses. Fig. 20Comparisons of binarization with , , and the image from our fuzzy-based method in the case of pose variations (head rotation): (a) original captured image, (b) an open eye, and (c) a closed eye. 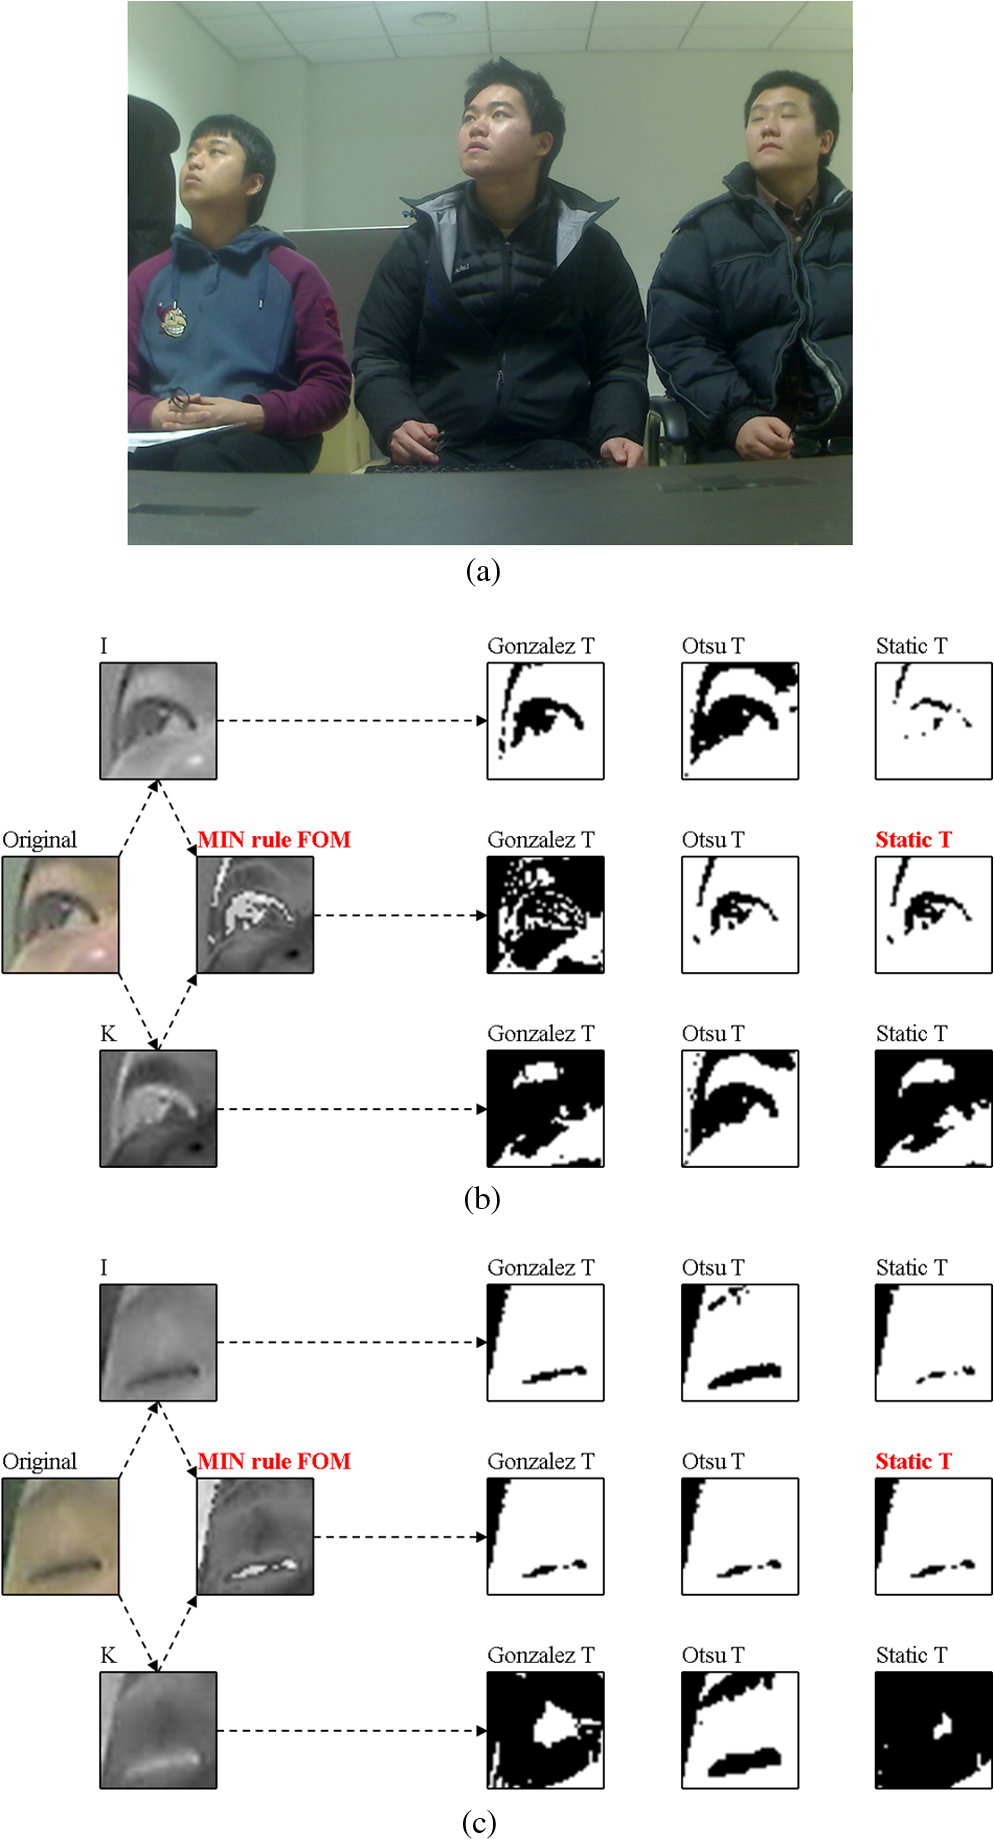 We included explanations and experiments in the case of users wearing glasses. Experiments were performed with 304 images of users wearing glasses. As shown in Fig. 21, a more accurate binarized image of the eye region can be obtained by our fuzzy-based method (Min rule FOM) than from the or images. In addition, the average EER of the classification of eye openness and closure by our fuzzy-based combination method is , which is similar to that of Table 4 using database I. Therefore, we found that our fuzzy-based combination method is robust to images of users with glasses. Fig. 21Comparisons of binarization with , , and an image by our fuzzy-based method in the case of users wearing glasses: (a) shows an open eye, and (b) and (c) show a closed eye. 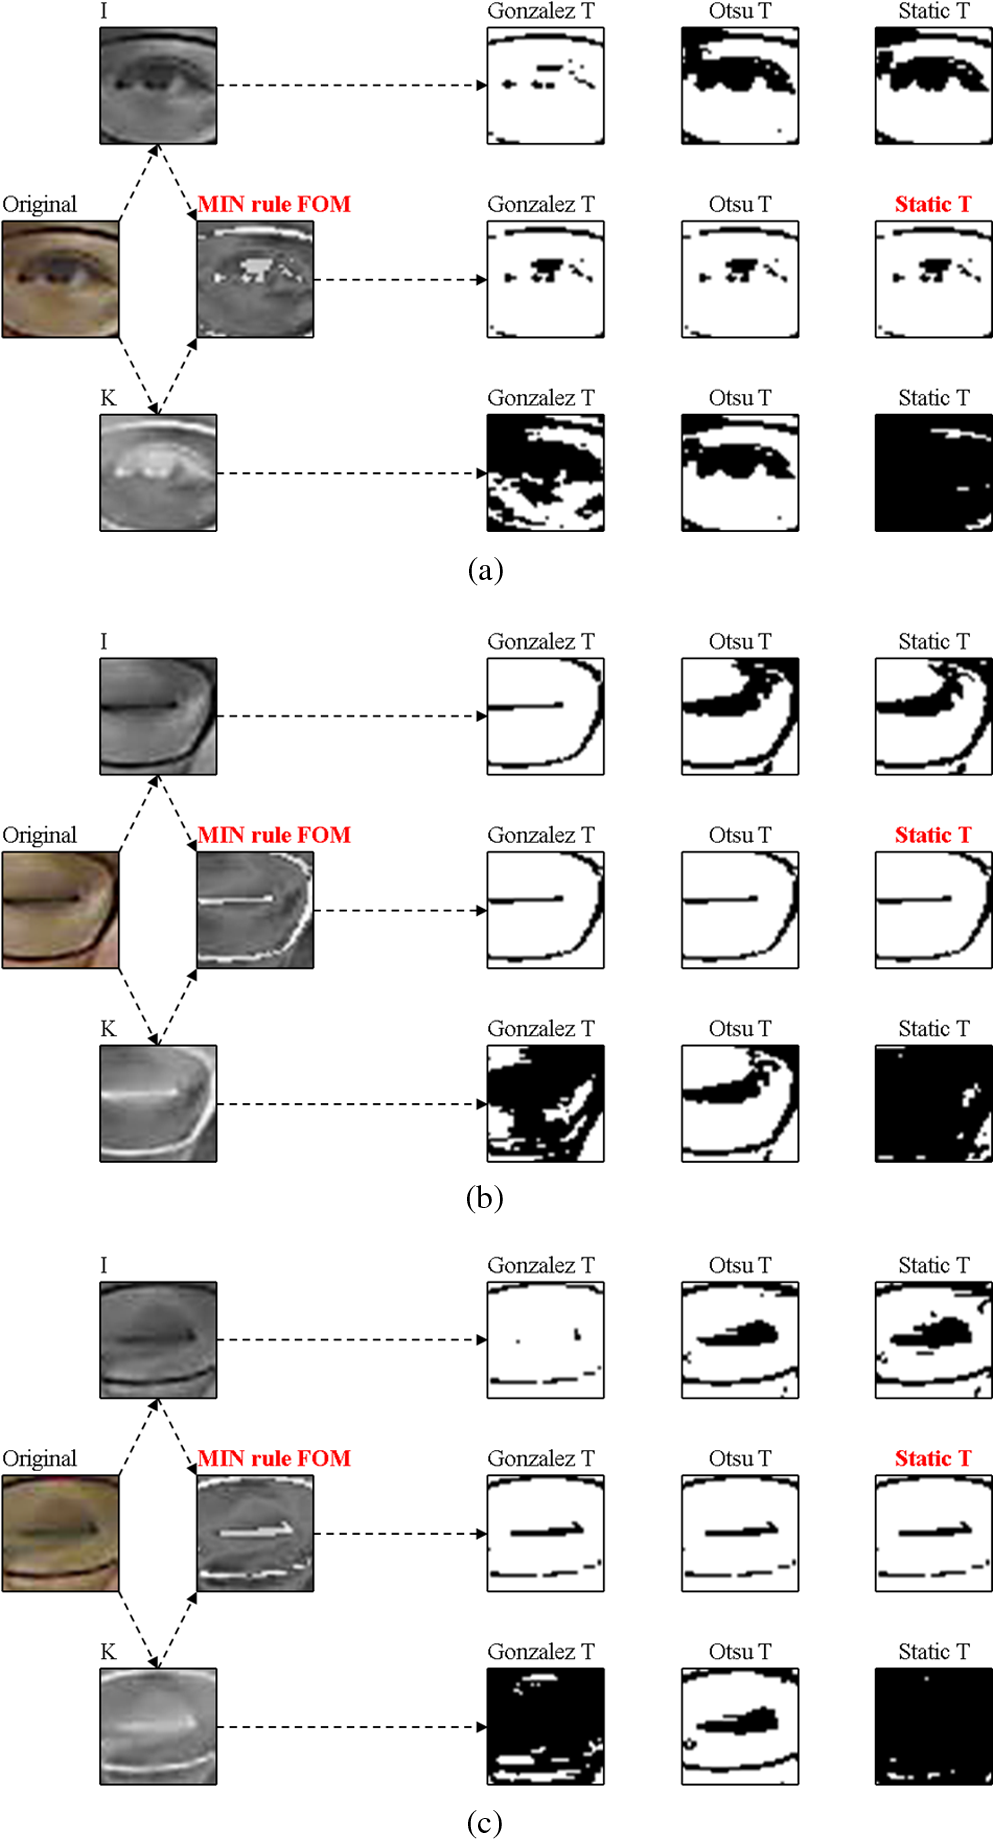 To obtain the eye region from the input image, we first detect the face region in the input image. We used the widely used AdaBoost method for face detection.25 AdaBoost is used to detect the ROI of the eye within a face. Rather than performing additional training procedures for the AdaBoost method with our own database, we used the AdaBoost algorithm provided from the OpenCV library (version 2.3.1), which was already trained.40 As shown in Fig. 23, the eyes are so small that detection errors and processing time increase if the AdaBoost method is used to directly detect the eye regions from the entire image. We compared the results of eye detection by our method (eye is detected within the ROI of the eye in a detected face region), as shown in Fig. 22, and by the method where the eye is located in the entire image without face detection, as shown in Fig. 23. As shown in Fig. 23, the error cases of eye region incorrectly detected occur, whereas there is no error in Fig. 22. We also compared the processing time of eye detection using our method and for the method where the eye is located in the entire image without face detection. Experimental results showed that the processing time for eye detection in the latter method was 1.102 s, which is much longer than in our method. [The processing time including face (58.67 ms) and eye (12.70 ms) detection as , as shown in Table 6.) Therefore, we performed eye detection within the ROI of a face. Table 6Processing time for each step of the proposed method per image (unit: ms).
We measured the accuracies of face and eye detection using our method. The accuracies are measured based on Eqs. (4) and (5): where is the total number of faces (or eyes) in the images, is the number of true positives, and is the number of false positives. True positives mean that the faces (or eyes) were detected correctly, while false positives represent cases where nonfaces (or noneyes) were incorrectly detected as faces (or eyes). If the recall value is close to 1, the accuracy of the face (or eye) detection process is high. If the precision value is 1, all of the detected face (or eye) regions are correct with zero false positives (). Experimental results with the images from database I showed that the recall and precision of face detection by our method were 100 and 100%, respectively. In addition, the recall and precision of eye detection by our method were 99.8 and 99.5%, respectively. The examples of face and eye detection by our method are shown in Fig. 22.In our research, although we use conventional fuzzy membership functions and defuzzification methods (FOM, LOM, MOM, and MeOM), we newly propose the fuzzy rule table shown in Table 2, which reflects the characteristics of and values for accurate eye segmentation. In addition, we newly propose RWAM (where all rectangular regions from all IVs are considered for calculating the output score, rather than maximum IVs) as the defuzzification method and compare the performances. Figures 3(a) and 3(b) show the input fuzzy membership functions for and values, respectively. Figure 3(c) represents the output fuzzy membership functions. In all cases, we used a simple linear (triangular) function. In previous studies, these membership functions were defined by the heuristic experiences of the researcher (not by experiments). We used the linear (triangular) membership function because it has been widely used in fuzzy-based methods41–43 to consider the processing time and complexity of the problem to be solved. By determining the membership functions and fuzzy rule table heuristically (not experimentally), the conventional fuzzy-based method has the advantages of not requiring additional training procedures, which take considerable processing time, and being less affected by the type of training database. In our research, we used only three thresholds (parameters). The first is the threshold for determining whether the eye detection was successful by sub-block-based template matching or adaptive template matching. The second is the threshold for binarization of the static threshold method of Sec. 2.4 and Table 4. The last is the threshold for determining eye openness and closure based on the standard deviation of Sec. 2.4. All of these thresholds were empirically determined by test and trial. The recall and precision of eye detection by our method were 99.8 and 99.5%, respectively, from which we conclude that the first threshold is appropriate. As shown in Table 4, the static threshold method using the second threshold outperforms the binarization of the Otsu and Gonzalez methods, from which we conclude that the second threshold is appropriate. As shown in Tables 4 and 5, our fuzzy-based method of determining eye openness and closure outperforms the other methods, from which we conclude that the third threshold is appropriate. In our research, we performed experiments with two databases (databases I and II) in order to measure the performance of our method in various database environments (image resolution, Z distance between camera and user, etc.). As shown in Figs. 9(b), 9(c), and 22, although the image resolution of database I is as large as , the image resolution of the eye region is small, as small as , because the Z distance between the camera and the user was large when collecting this database. As shown in Fig. 11, the image resolution of database II is , and the image resolution of the eye region is also as small as . Although the image resolution of database II is smaller than that of database I, the resolutions of the eye region of databases I and II are similar because the Z distance between the camera and user is much larger in database I. Most widely used face databases include eye regions with higher image resolution. In the case of the PAL database,44 the eye region is larger than or . In the case of the AR database,45 the eye region is larger than . Therefore, the image resolution of the eye regions of the databases in our experiments is lower than that of other face databases.44,45 As shown in Table 4, the error of determining eye openness and closure is by our method. This means that about two or three frames per 100 successive frames of valid open eyes are incorrectly determined as closed eyes and skipped. In addition, about two or three frames among 100 successive frames of closed eyes are incorrectly determined as open eyes. 3.4.Processing Time of the Proposed MethodTo measure the processing time of the proposed method, we utilized a desktop computer with an Intel Core i7 processor 975 at 3.33GHz and 8 GB RAM. Table 6 lists the measurement results of the processing time with database I according to each step of Fig. 1. For measuring the processing time, the Min rule with FOM and static threshold is used because it gives the best performance on the experiment results. As a result, the average processing time of each image was ; we, thus, confirm that our method can be operated at a fast speed [ ()]. 4.ConclusionWe have studied an eye image classification method based on a fuzzy logic system. The proposed method uses and color information from the HSI and CMYK color spaces, respectively, for eye segmentation. The eye region is binarized using the fuzzy logic system based on and inputs. Through the fuzzy logic system, the combined image of and pixels is obtained. In order to reflect the effect by all the IVs on calculating the output score of the fuzzy system, we use RWAM, where all the rectangular regions by all the IVs are considered for calculating the output score. Then, the final classification of eye openness or closure is made based on the standard deviation of the vertical pixel length calculated from the binarized image. In our research, the classification of eye openness or closure is successfully made with eye images of low resolution, which are captured in the environment of people watching TV at a distance. By using the fuzzy logic system, our method does not require the additional procedure of training irrespective of the database. Through the evaluations with two databases, we can confirm that our method is superior to other methods. In the future, we would research the method of enhancing the performance of classifying open and closed eyes by combining our fuzzy-based method and other training-based ones. In addition, we would enhance the performance of eye detection, which can affect the performance of classifying open and closed eyes. ReferencesJ. Clark,
“Will your next car wake you up when you fall asleep at the wheel?,”
(2008) http://auto.howstuffworks.com/car-driving-safety/safety-regulatory-devices/car-wake-you-up.htm May 2015). Google Scholar
J. Jo et al.,
“Vision-based method for detecting driver drowsiness and distraction in driver monitoring system,”
Opt. Eng., 50 127202
(2011). http://dx.doi.org/10.1117/1.3657506 OPEGAR 0091-3286 Google Scholar
C.-S. Hsieh and C.-C. Tai,
“An improved and portable eye-blink duration detection system to warn of driver fatigue,”
Instrum. Sci. Technol., 41 429
–444
(2013). http://dx.doi.org/10.1080/10739149.2013.796560 ISCTEF 1073-9149 Google Scholar
N. Sharma and V. K. Banga,
“Drowsiness warning system using artificial intelligence,”
World Acad. Sci., Eng. Technol., 4 647
–649
(2010). Google Scholar
W. O. Lee et al.,
“Minimizing eyestrain on a liquid crystal display considering gaze direction and visual field of view,”
Opt. Eng., 52 073104
(2013). http://dx.doi.org/10.1117/1.OE.52.7.073104 OPEGAR 0091-3286 Google Scholar
L. Chittaro and R. Sioni,
“Exploring eye-blink startle response as a physiological measure for affective computing,”
in Proc. of Humaine Association Conf. on Affective Computing and Intelligent Interaction,
227
–232
(2013). Google Scholar
H. Tada et al.,
“Eye-blink behaviors in 71 species of primates,”
PLoS One, 8 1
–9
(2013). http://dx.doi.org/10.1371/journal.pone.0066018 1932-6203 Google Scholar
B. Champaty, K. Pal and A. Dash,
“Functional electrical stimulation using voluntary eyeblink for foot drop correction,”
in Proc. of Int. Conf. on Microelectronics, Communication and Renewable Energy,
1
–4
(2013). Google Scholar
B. Ashtiani and I. S. MacKenzie,
“BlinkWrite2: an improved text entry method using eye blinks,”
in Proc. of Eye Tracking Research & Applications Symp.,
339
–346
(2010). Google Scholar
A. Bulling et al.,
“Eye movement analysis for activity recognition using electrooculography,”
IEEE Trans. Pattern Anal. Mach. Intell., 33 741
–753
(2011). http://dx.doi.org/10.1109/TPAMI.2010.86 ITPIDJ 0162-8828 Google Scholar
P. Campadelli, R. Lanzarotti and G. Lipori,
“Eye localization: a survey,”
Fundamentals of Verbal and Nonverbal Communication and the Biometric Issues, 234
–245 2007). Google Scholar
M. Lalonde et al.,
“Real-time eye blink detection with GPU-based SIFT tracking,”
in Proc. of the Fourth Canadian Conf. on Computer and Robot Vision,
481
–487
(2007). Google Scholar
J. Mohanakrishnan et al.,
“A novel blink detection system for user monitoring,”
in Proc. of the 1st IEEE Workshop on User-Centered Computer Vision,
37
–42
(2013). Google Scholar
W. O. Lee, E. C. Lee and K. R. Park,
“Blink detection robust to various facial poses,”
J. Neurosci. Methods, 193 356
–372
(2010). http://dx.doi.org/10.1016/j.jneumeth.2010.08.034 JNMEDT 0165-0270 Google Scholar
I. Bacivarov, M. Ionita and P. Corcoran,
“Statistical models of appearance for eye tracking and eye-blink detection and measurement,”
IEEE Trans. Consum. Electron., 54 1312
–1320
(2008). http://dx.doi.org/10.1109/TCE.2008.4637622 ITCEDA 0098-3063 Google Scholar
E. Missimer and M. Betke,
“Blink and wink detection for mouse pointer control,”
in Proc. of the 3rd Int. Conf. on Pervasive Technologies Related to Assistive Environments,
23:1
–23:8
(2010). Google Scholar
E. Miluzzo, T. Wang and A. T. Campbell,
“EyePhone: activating mobile phones with your eyes,”
in Proc. of the Second ACM SIGCOMM Workshop on Networking, Systems, and Applications on Mobile Handhelds,
15
–20
(2010). Google Scholar
J. Wu and M. M. Trivedi,
“An eye localization, tracking and blink pattern recognition system: algorithm and evaluation,”
ACM Trans. Multimed. Comput. Commun. Appl., 6 8:1
–8:23
(2010). http://dx.doi.org/10.1145/1671962 1551-6857 Google Scholar
A. A. Lenskiy and J.-S. Lee,
“Driver’s eye blinking detection using novel color and texture segmentation algorithms,”
Int. J. Control Autom. Syst., 10 317
–327
(2012). http://dx.doi.org/10.1007/s12555-012-0212-0 1598-6446 Google Scholar
L. Hoang, D. Thanh and L. Feng,
“Eye blink detection for smart glasses,”
in Proc. of IEEE Int. Symp. on Multimedia,
305
–308
(2013). Google Scholar
L. C. Trutoiu et al.,
“Modeling and animating eye blinks,”
ACM Trans. Appl. Percept., 8 17:1
–17:17
(2011). http://dx.doi.org/10.1145/2010325 1544-3558 Google Scholar
C. Colombo, D. Comanducci and A. D. Bimbo,
“Robust tracking and remapping of eye appearance with passive computer vision,”
ACM Trans. Multimed. Comput. Commun. Appl., 3 20:1
–20:20
(2007). http://dx.doi.org/10.1145/1314303 1551-6857 Google Scholar
C.-C. Chiang et al.,
“A novel method for detecting lips, eyes and faces in real time,”
Real-Time Imaging, 9 277
–287
(2003). http://dx.doi.org/10.1016/j.rti.2003.08.003 1077-2014 Google Scholar
B. Cyganek and S. Gruszczyński,
“Hybrid computer vision system for drivers’ eye recognition and fatigue monitoring,”
Neurocomputing, 126 78
–94
(2014). http://dx.doi.org/10.1016/j.neucom.2013.01.048 NRCGEO 0925-2312 Google Scholar
P. Viola and M. J. Jones,
“Robust real-time face detection,”
Int. J. Comput. Vis., 57 137
–154
(2004). http://dx.doi.org/10.1023/B:VISI.0000013087.49260.fb IJCVEQ 0920-5691 Google Scholar
B.-S. Kim, H. Lee and W.-Y. Kim,
“Rapid eye detection method for non-glasses type 3D display on portable devices,”
IEEE Trans. Consum. Electron., 56 2498
–2505
(2010). http://dx.doi.org/10.1109/TCE.2010.5681133 ITCEDA 0098-3063 Google Scholar
H. Heo et al.,
“Nonwearable gaze tracking system for controlling home appliance,”
Sci. World J., 2014 1
–20
(2014). http://dx.doi.org/10.1155/2014/303670 THESAS 2356-6140 Google Scholar
W. O. Lee et al.,
“New method for face gaze detection in smart television,”
Opt. Eng., 53 053104
(2014). http://dx.doi.org/10.1117/1.OE.53.5.053104 OPEGAR 0091-3286 Google Scholar
R. C. Gonzalez and R. E. Woods, Digital Image Processing, 3rd ed.Prentice Hall, New Jersey
(2010). Google Scholar
R. Crane, A Simplified Approach to Image Processing: Classical and Modern Techniques in C, Prentice Hall, New Jersey
(1996). Google Scholar
B. Narasimhan,
“The normal distribution,”
(1996) http://statweb.stanford.edu/~naras/jsm/NormalDensity/NormalDensity.html July 2015). Google Scholar
C. W. Cho et al.,
“Binocular gaze detection method using a fuzzy algorithm based on quality measurements,”
Opt. Eng., 53 053111
(2014). http://dx.doi.org/10.1117/1.OE.53.5.053111 OPEGAR 0091-3286 Google Scholar
G. P. Nam and K. R. Park,
“New fuzzy-based retinex method for the illumination normalization of face recognition,”
Int. J. Adv. Robot. Syst., 9
(103), 1
–9
(2012). http://dx.doi.org/10.5772/51664 Google Scholar
K. Y. Shin et al.,
“Finger-vein image enhancement using a fuzzy-based fusion method with Gabor and retinex filtering,”
Sensors, 14 3095
–3129
(2014). http://dx.doi.org/10.3390/s140203095 SNSRES 0746-9462 Google Scholar
T. J. Ross, Fuzzy Logic with Engineering Applications, Willey, New Jersey
(2010). Google Scholar
“Webcam C600,”
(2014) http://www.logitech.com/en-us/support/webcams/5869 October ). 2014). Google Scholar
A. Pérez and R. C. Gonzalez,
“An iterative thresholding algorithm for image segmentation,”
IEEE Trans. Pattern Anal. Mach. Intell., PAMI-9 742
–751
(1987). http://dx.doi.org/10.1109/TPAMI.1987.4767981 ITPIDJ 0162-8828 Google Scholar
N. Otsu,
“A threshold selection method from gray-level histograms,”
IEEE Trans. Syst. Man Cybern., SMC-9
(1), 62
–66
(1979). http://dx.doi.org/10.1109/TSMC.1979.4310076 ITSHFX 1083-4427 Google Scholar
G. Pan et al.,
“Eyeblink-based anti-spoofing in face recognition from a generic webcamera,”
1
–8 http://dx.doi.org/10.1109/ICCV.2007.4409068 Google Scholar
B. S. Bayu and J. Miura,
“Fuzzy-based illumination normalization for face recognition,”
in Proc. of IEEE Workshop on Advanced Robotics and Its Social Impacts,
131
–136
(2013). Google Scholar
A. Barua, L. S. Mudunuri and O. Kosheleva,
“Why trapezoidal and triangular membership functions work so well: towards a theoretical explanation,”
J. Uncertain Syst., 8 164
–168
(2014). Google Scholar
J. Zhao and B. K. Bose,
“Evaluation of membership functions for fuzzy logic controlled induction motor drive,”
in Proc. of IEEE Annual Conf. of the Industrial Electronics Society,
229
–234
(2002). Google Scholar
“The PAL Face Database,”
(2015) http://agingmind.utdallas.edu/facedb January ). 2015). Google Scholar
“AR Face Database,”
(2015) http://www2.ece.ohio-state.edu/~aleix/ARdatabase.html January ). 2015). Google Scholar
BiographyKi Wan Kim received his BS in computer science from Sangmyung University, Seoul, South Korea, in 2012. He is currently pursuing his master’s course in electronics and electrical engineering at Dongguk University. His research interests include image processing and gaze tracking. Won Oh Lee received his BS degree in electronics engineering from Dongguk University, Seoul, South Korea, in 2009. He received the combined course of MS and PhD degrees in electronics and electrical engineering at Dongguk University in 2014. He is a senior researcher in Hyundai Morbis. His research interests include biometrics and pattern recognition. Yeong Gon Kim received his BS and MS degrees in computer engineering and electronics and electrical engineering from Dongguk University, Seoul, South Korea, in 2011 and 2013, respectively. He is currently pursuing his PhD degree in electronics and electrical engineering at Dongguk University. His research interests include biometrics and pattern recognition. Hyung Gil Hong received his BS degree in electronics engineering from Dongguk University, Seoul, South Korea, in 2012. He received his master’s degree in electronics and electrical engineering at Dongguk University in 2014. He is currently pursuing his PhD degree in electronics and electrical engineering at Dongguk University. His research interests include biometrics and pattern recognition. Eui Chul Lee received his BS degree in software in 2005, and his master’s and PhD degrees in computer science in 2007 and 2010, respectively, from Sangmyung University, Seoul, South Korea. He is currently an assistant professor in the Department of Computer Science at Sangmyung University. His research interests include computer vision, biometrics, image processing, and HCI. Kang Ryoung Park received his BS and MS degrees in electronic engineering from Yonsei University, Seoul, South Korea, in 1994 and 1996, respectively. He received his PhD degree in electrical and computer engineering from Yonsei University in 2000. He has been a professor in the division of electronics and electrical engineering at Dongguk University since March 2013. His research interests include image processing and biometrics. |
|||||||||||||||||||||||||||||||||||||||||||||||||||||||||||||||||||||||||||||||||||||||||||||||||||||||||||||||||||||||||||||||||||||||||||||||||||||||||||||||||||||||||||||||||||||||||||||||||||||||||||||||||||||||||||||||||||||||||||||||||||||||||||||||||||||||||||||||||||||||||||||||||||||||||||||||||||||||||||||||||||||||||||||||||||||||||||||||||||||||||||||||||||||||||||||||||||||||||||||||||||||||||||||||||||||||||||||||||||||||||||||||||||||||||||||||||||||||||||||||||||||||||||||||||||||||||||||