|
|
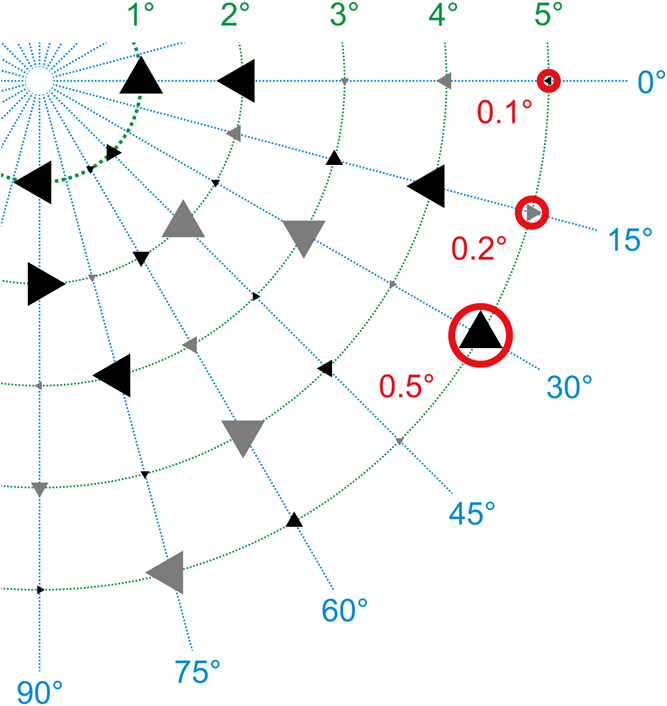
1.IntroductionFor many years, a lot of effort was put into developing wavelength independent laser protection techniques against dazzling and damaging.1 However, the search for a sophisticated laser protection measure to counter the large number of today’s available laser wavelengths is still an ongoing task. Since this goal is difficult to achieve, we have focused the experimental and theoretical work on laser protection at our institute on two main topics: (1) hardening of optical systems to protect the human eye or sensors against laser-induced damage.2 Here, we developed and tested optical power limiters utilizing the nonlinear optical response of nanoparticles.3,4 (2) Hardening of imaging sensors against laser dazzling. We designed an active protection concept based on a digital micromirror device (DMD) in combination with wavelength multiplexing. The principle resembles a hyperspectral sensor and enables the system to filter out monochromatic light both spectrally and spatially resolved. For more details, we refer to Sec. 4.2 as well as to our earlier publications.5–7 With this active protection concept against laser dazzling, we achieved a mean attenuation of 45.5 dB for laser wavelengths in the spectral range between 470 and 725 nm, which is a promising result. Except for classical laser protection filters, only a very few advanced protection methods achieve such good values (e.g., liquid crystal shutters:8 40 dB, cascaded-focus optical limiters:9 ). Figure 1 illustrates the performance of our dazzling protection concept. From top to bottom, we see three different images taken with our hardened sensor (a) without laser exposure, (b) with laser exposure (irradiance at the entrance aperture), but without activated dazzling protection, and (c) the same as (b) but with activated dazzling protection. The integration time of the sensor remained constant in all three cases. In Fig. 1(c), it is clearly visible that high suppression of laser radiation was achieved. However, the area where the laser light was filtered out appears quite dark. The contrast and the information content in this part of the image are reduced in comparison to other parts in the image. That raises the question of whether the remaining signal/background contrast is sufficient for the dedicated visual task when such a filtering is applied. Fig. 1Images taken with a sensor hardened against laser dazzling: (a) without laser irrradiation, (b) with laser irradiance of but without activated protection and (c) like (b) with activated protection. 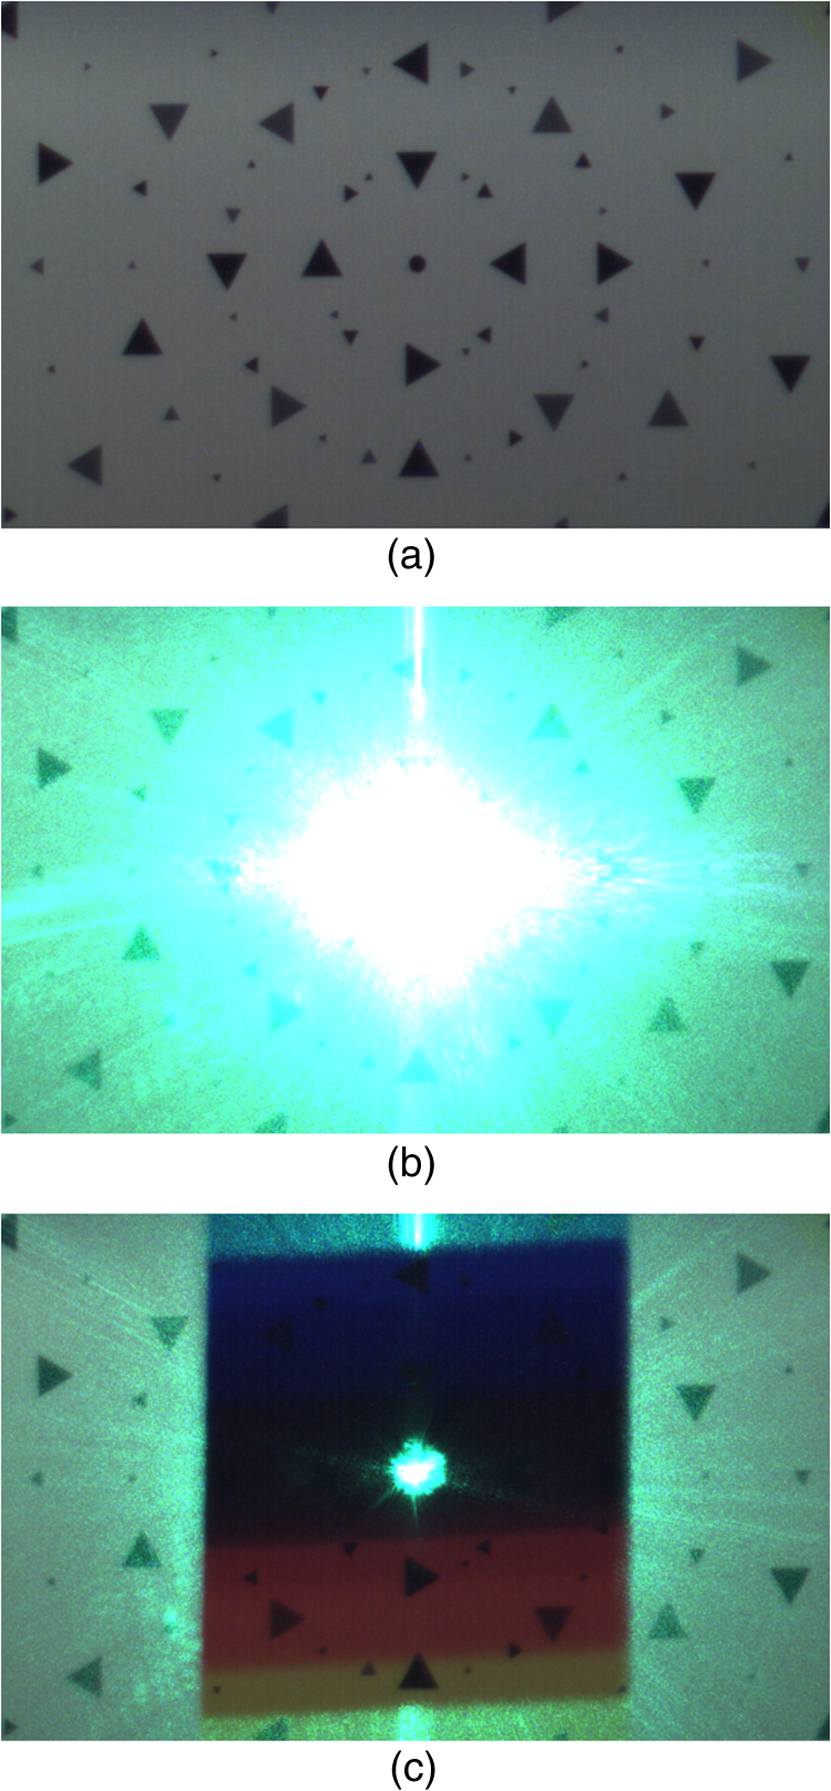 This example plainly shows that the objective assessment of laser protection measures regarding imaging systems is a difficult task, since none of the existing protection solutions (an overview may be found, for example, in Ref. 8) exhibit an “ideal” behavior. An ideal protection is understood as a method which sufficiently attenuates unwanted laser irradiation of arbitrary wavelengths, but still allows the nondisturbing light of the scene to transmit to the detector. With such a protection, the observer or sensor could still perform its task independent of any disturbing irradiation. In reality, laser protection measures always exhibit restrictions. For example, classical laser protection goggles in the visible spectral region usually show color distortions as well as a rather low transmittance of visible light. More sophisticated concepts suffer from other disadvantages, such as the attenuation of laser light being too low (e.g., frequency agile liquid crystal filter8) or the amount of space needed making the system bulky (e.g., cascade-focus optical limiter9). 2.Performance Assessment of Laser Protection MeasuresFor imaging systems, the elementary assessment of laser protection measures solely by addressing simple numbers (e.g., the “maximum attenuation of laser light”) is far from sufficient. For example, disturbances introduced by the protection measure, leading to poor image quality, will not be considered. Yet a severe loss of image quality can render a sensor mostly useless. Obviously, it is necessary to draw a comparison between images of a dazzled sensor with and without activated (or inserted) protection measures. Comparing the information content of such images will lead to a more accurate assessment of the performance of a certain laser protection measure. Durécu et al. already used such an approach for their quantitative assessment of unprotected laser dazzled charge-coupled device (CCD) cameras.10,11 In their experiments, the cameras observed a scene containing a number of different characters (“N”, H”, E”, U”, “V”) that had to be recognized by a pattern recognition algorithm. The algorithm was based on correlation10 or Fourier descriptors.11 Hueber et al. also used pattern recognition algorithms to quantify laser dazzling.12 In their case, they worked on thermal imagers. Schleijpen et al. used a completely different method to quantify sensor dazzling.13–15 They evaluated the diameter of the overexposed part in dazzled images as a function of laser irradiance and camera integration time. This method is quite useful to assess the laser dazzling vulnerability, especially when the protection measures are homogeneously applied over the entire field of view of the sensor. However, due to the specific concept of our hardened sensor, this method is not applicable here. For example, in the case of Fig. 1(c), only a small dazzling spot diameter would be assessed, resulting in a strong overestimation of the protection performance. For our work, we found the approach of Durécu et al. to be highly suitable and we adapted it to our needs. Instead of characters, we decided to utilize triangular test patterns according to the triangle orientation discrimination (TOD) method developed by the Netherlands Organisation for Applied Scientific Research.16 TOD is a common method to characterize the performance of electro-optical systems. Triangular test patterns that can be oriented in four possible orientations (up, down, left, or right) and are presented to observers who have to indicate the triangle orientation. The results of such observer tests, performed with test patterns of different sizes and contrasts, allow the derivation of specific sensor characteristics: In the case of imagers working in the visible spectrum, it is the minimum resolvable contrast (MRC), whereas in the case of thermal imagers, it is the minimum resolvable temperature difference (MRTD). Although these characteristic sensor parameters (MRC and MRTD) are not within the scope of our work, we combined the triangular test patterns of the TOD method with the image analysis approach. We decided to analyze the sensor images by an automatic image analysis algorithm instead of by human observers to avoid time-consuming observer tests. Thus, the choice of a specific test pattern is less important. Yet the use of triangular test patterns still offers the possibility to present the same data to human observers for further analysis or for evaluation purposes if needed. In human observer tests, the simple task of discerning the orientation of a triangle is advantageous compared to test patterns that are more complex. For the image analysis, we used a correlation-based template-matching algorithm in order to recognize equilateral triangles of different sizes and contrast values, which can be oriented in four different orientations as mentioned before. The task of the image analysis algorithm is to discriminate the orientation of triangles in dazzled sensor images. Section 5.1 explains the image analysis algorithm in more detail. In order to provide a statement on the performance of a specific protection measure, a two-stage measurement is necessary: dazzling has to be measured with and without the enabled (or inserted) protection measure. Then the performance of the protection measure can be assessed by comparing the image analysis results of both runs. For the recognition of triangular test patterns, a multitude of other algorithms is available; for example, Fourier descriptors11 or local binary patterns.17,18 Also, in the context of triangle orientation discrimination, vision models were developed which incorporate the effects of the human eye.19,20 However, for our sensor-based recognition task, the simple template-matching approach seems to be sufficient. As a second method to assess the performance of laser protection measures, we decided to analyze the data by calculating the structural similarity index (SSIM). The SSIM index is a metric for measuring the quality of an image by comparing it to a distortion-free reference image.21 This metric is based on the assumption that the human visual system is designed to recognize structures in images and estimates to what extent two images exhibit the same structures. Usually, SSIM is used to assess the quality of image compression algorithms. In our case, images taken with a camera dazzled by laser light are compared to an image taken without laser dazzling. Thus, we obtain a measure of how much image information can be retrieved when applying a particular protection measure. Several other image quality metrics could be used for this method; for example, root-mean-square error (RMSE), peak signal-to-noise ratio, or universal image quality index. A short review of those metrics and others can be found in Ref. 22. In the current publication, first we present the results of our approaches to assess the performance of laser protection measures and discuss the suitability of the different methods. 3.Experimental SetupAs a test chart for the measurements, we used a white board of diffuse scattering characteristics with an imprinted pattern consisting of a number of equilateral triangles. Figure 1(a) shows the central part of the test chart. The construction sketch for one quadrant is depicted in Fig. 2. Triangles of three different sizes (“large,” “medium,” “small”) and two different contrasts (“high contrast”: , “medium contrast”: ) are used. Here, contrast is defined as . The diameter of the circumscribed circles of the triangles was chosen to correspond to angles of 0.5 deg, 0.2 deg and 0.1 deg as seen from the sensor’s position. In triangle orientation discrimination, the stimulus size of a triangle is usually defined as the square-root area of the triangle. This value can be calculated from the diameter of the circumcircle (in units of milliradians) by , resulting in stimulus sizes of 5.0, 2.0, and 1.0 mrad. The geometrical arrangement of the triangles was designed to be aligned on concentric circles around the optical axis. Seen from the sensor’s position, the angular sizes of the concentric circles’ radii increase in steps of one degree. On each circle, except the inner one, triangles of all combinations of sizes, orientations, and contrasts are present, separated in angular steps of 15 deg. For the inner circle (1 deg angular radius), the low contrast triangles had to be dismissed due to the limited space. The overall size of the test chart is . The sensor under test observes the test chart from a distance of 518 cm as depicted in Fig. 3. Depending on the sensor’s field of view (see Sec. 4), the test chart may be partly or completely seen by the sensor. As a dazzling source, we used a multiwavelength laser source iChrome MLE-L from Toptica. This device includes four different lasers (wavelengths 488, 515, 561, and 640 nm) with output powers ranging from 40 to 100 mW. Each of these lasers is coupled into a common single-mode fiber. The fiber output is collimated using an off-axis parabolic mirror (Thorlabs RC12APC-P01) to avoid chromatic aberration. Subsequently, a lens with a focal length (Thorlabs LF1547-A) is used to spread the laser beam to overspill the sensor’s optics and to simulate far-field conditions. We attenuate the laser power to the desired values by means of two filter wheels equipped with neutral density filters offering a maximum optical density of 5.3. For simplicity, we place the laser source directly behind the test chart and the sensor is illuminated by the laser beam through an aperture of 15 mm located in the center of the test chart. The beam diameter () at the entrance aperture of the sensor lens ranges between 170 and 162 mm for laser wavelengths between 488 and 640 nm, respectively. 4.Sensors Under TestFor this study, experiments were performed on three different sensors: two commercial sensors and one homebuilt hardened sensor. Table 1 summarizes the technical details of these sensors. Table 1Specifications of the sensors used.
4.1.Commercial SensorsFirst, we performed tests on a standard complementary metal oxide semiconductor (CMOS) camera VRmFC-22/BW-PRO from VRmagic (full well capacity: , dynamic range: 60 dB), which offers no laser dazzling protection at all. We use the results acquired with this camera as reference for the other sensors. The second device under test was a CMOS camera with a nonlinear response curve (Photonfocus HD1-D1312). The sensor of this camera is specified with a full well capacity of and a dynamic range up to 120 dB achieved by LinLog technology. This technology offers a linear response curve for low irradiances and a logarithmic compression at higher irradiances.23 Although this is not a dedicated laser protection measure, it may be expected that this camera is less vulnerable to laser dazzling compared to the standard CMOS camera due to the nonlinear response curve as well as the higher dynamic range and full well capacity. The software of the manufacturer offers three predefined logarithmic compressions (“low,” “normal,” “high”), which all were used for the experiments. The results for the different compression modes will be compared with the results of the standard CMOS camera. 4.2.Hardened Sensor Based on a Digital Micromirror Device and Wavelength MultiplexingThe third evaluated sensor is the only one with a dedicated protection measure against laser dazzling. The hardening against laser dazzling is achieved by an optical setup including a digital micromirror device24 and wavelength multiplexing.25 A scheme of the optical setup is shown in Fig. 4. The heart of the sensor, a DMD, is used as an intensity modulator. In order to be able to filter light only in localized areas of the sensor’s field of view, the DMD is located at the intermediate focal plane of a Keplerian telescope formed by lenses L1 and L2. Before and behind the telescope, two identical dispersive elements (gratings Gr1 and Gr2) are placed along the optical beam path to implement the wavelength multiplexing and demultiplexing. The first grating spectrally disperses the light beams entering the setup in such a way that each object point of a distant scene forms a wavelength spectrum at the intermediate focal plane of the telescope. Then, in order to reconstruct the image, the dispersion induced by the first grating has to be reversed behind the telescope which is realized by means of the second grating. Fig. 4Laser dazzling protection concept using a digital micromirror device (DMD): (a) operation mode for regular imaging and (b) operation mode with high attenuation of dazzling laser light. 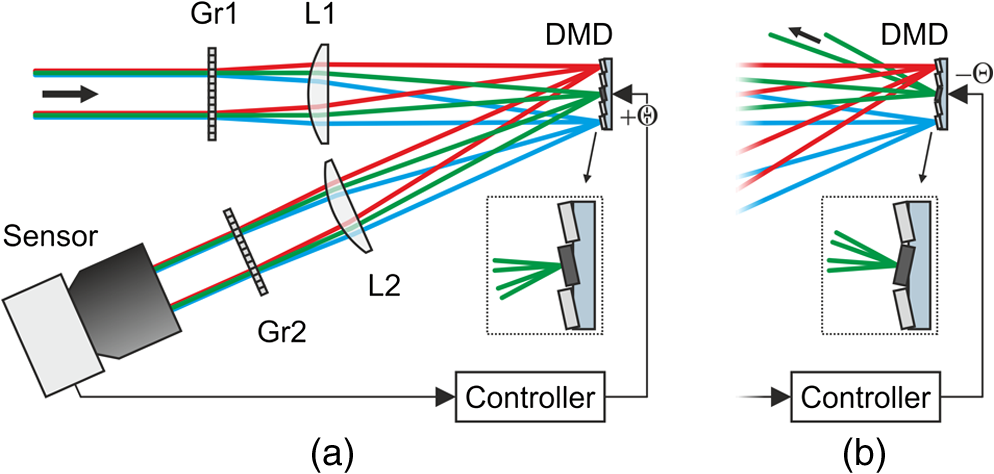 Without dazzling laser light, this setup is operated in such a way that all light entering the lens is directed toward the sensor by having all micromirrors tilted to the -state [Fig. 4(a)]. In the case of dazzling laser light arriving at the sensor (here: the green rays in the figure), the controller only toggles those micromirrors to the -state which are exposed to dazzling light [Fig. 4(b)]. Thus, the dazzling light is reflected out of the regular beam path, whereas all remaining wavelengths, originating from the same object point as the dazzling laser radiation, can still pass the optical arrangement unaffected. Light originating from other object points remains unaffected on all wavelengths as these wavelengths are not directed to those micromirrors toggled to the -state. Thus, the method of wavelength multiplexing allows combined spatial and spectral filtering of monochromatic light. The controller automatically activates the micromirrors in order to filter out the unwanted laser radiation. Since the controller needs spatially resolved information provided by the camera images, the reaction time is on the order of the camera’s integration time (several milliseconds up to several tens of milliseconds, depending on the ambient light conditions). The pattern of activated micromirrors is always adaptively adjusted according to the scene. To estimate the maximum attenuation of monochromatic light as a function of the wavelength, we used a coherent white light source (Koheras SuperK Extreme) equipped with an acousto-optic tunable filter to generate narrow-band radiation (3–8 nm) in the spectral range between 470 and 725 nm. The mean attenuation in this spectral range was measured to be 45.5 dB. For wavelengths below 470 nm, the intensity of the white light source is too low to perform measurements. Detailed information about the optical layout with the DMD and the control loop mechanism can be found in various publications.5–7 5.Data Analysis and ResultsThe aim of our study was to assess the performance of laser protection measures for imaging sensors. On that account, we illuminated the three different sensors with four different laser wavelengths. In all measurements, the integration time of each individual sensor was fixed and adjusted to a setting where the dynamic range of all sensors was identically utilized: the white background of the test chart caused a sensor output of approximately 50% of the maximum output (in digital units). The ambient light in the laboratory provided an illuminance at the test chart of approximately 220 lux (measured horizontally). The tests were performed in the following way: the sensor under test was irradiated with different laser irradiance levels, starting from the lowest value up to the highest value. For each value of laser irradiance, we captured a sensor image and stored it with the maximum bit depth the sensor offered (see Table 1). For the hardened sensor, the experiments were performed with the DMD switched on (protection active) and off (protection inactive). For the image analysis, we made use of automatic algorithms based either on template matching (Sec. 5.1) or on the calculation of the SSIM index (Sec. 5.2). The algorithms were implemented in python using standard functions of the scikit-image library. The results presented have been measured with a laser wavelength of 515 nm. 5.1.Triangle Orientation DiscriminationThe discrimination of the triangle orientation is accomplished by template matching based on cross-correlation calculations. For each size of the triangular test patterns, a template from an undazzled image is extracted. Then, regarding the different orientations of the triangles, the extracted template is rotated by 90 deg, 180 deg, and 270 deg in order to get templates for all four possible orientations. The template matching is performed by computing the fast cross-correlation26 for each possible size and orientation of the triangles. By setting a suitable threshold, the cross-correlation algorithm estimates positions for the triangles of different sizes and orientations. At this point, it is possible for the algorithm to assign multiple orientations to a specific test pattern on the test chart (i.e., the correlation values for two or more orientations are above the threshold). In this case, we chose the orientation with the highest correlation coefficient as the result. It is also possible that a triangle is recognized at a position where no triangle exists. Such a result will be dismissed. As an example, Fig. 5 shows two images taken with the standard CMOS camera (VRmagic VRmFC-22/BW-PRO) and the camera with a nonlinear response curve (Photonfocus HD1-D1312, low logarithmic compression mode) for comparable laser irradiances at the laser wavelength of 515 nm. The triangles recognized by the algorithm are marked by circles with each one sized corresponding to the size of the triangle. Their orientation is represented by the circles’ colors: red: “up,” green: “down,” blue: “left,” yellow: “right.” From these results, the fraction of correctly discriminated triangle orientations was evaluated. This analysis was separately performed for each angular distance from the optical axis as well as for each of the three sizes and two contrasts of the triangular test patterns. Different contrasts did not lead to a difference in recognition performance. Moreover, the recognition results are very similar for the different triangle sizes. Therefore, we give a more compact presentation of the results where the fraction of correctly discriminated triangle orientations is summarized for the different sizes and contrasts. Fig. 5(a) Images taken with a standard complementary metal oxide semiconductor (CMOS) camera (VRmagic VRmFC-22/BW-PRO) and (b) a camera with nonlinear response curve (Photonfocus HD1-D1312, here: low logarithmic compression). The triangles recognized by the pattern recognition algorithm are marked by circles. The color of the circles corresponds to the orientation assigned (red: “up,” green: “down,” blue: “left,” yellow: “right”). 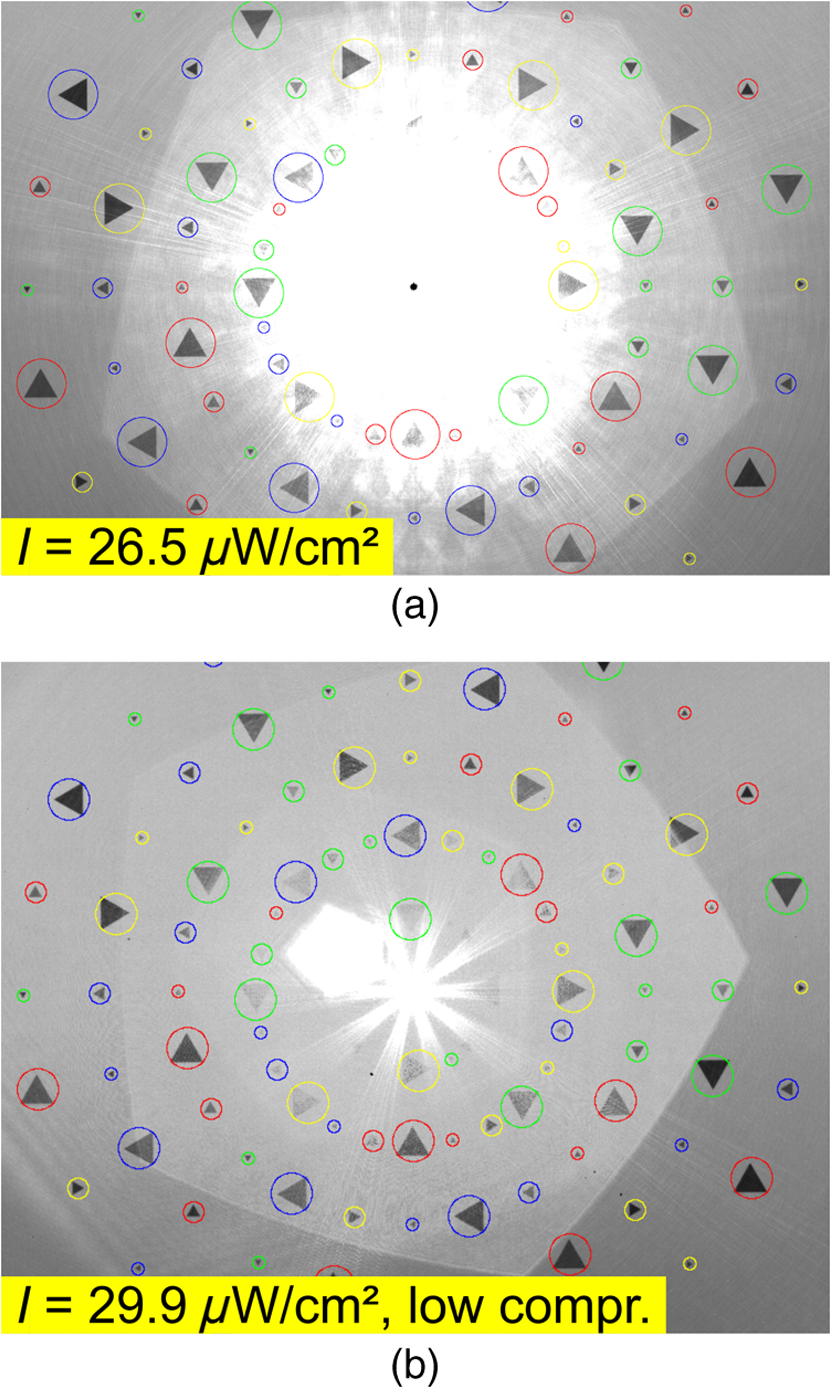 In Fig. 6, the fraction of correctly discriminated triangle orientations is plotted as a function of irradiance for the standard CMOS camera and the camera with a nonlinear response curve. The results for the five different viewing angles under which the triangles were seen by the camera are separately plotted. The black-dashed curves are error functions fitted to the data of the standard CMOS camera, whereas the red-dashed curves are error functions fitted to the data of the camera with a nonlinear response curve for the case of nonactivated logarithmic compression. Considering the curve fits, the camera with the nonlinear response curve seems to be advantageous compared to the standard CMOS camera. Moreover, for the camera with the nonlinear response curve, we can see that a higher logarithmic compression does not necessarily lead to higher fractions of correctly discriminated triangle orientations. In the special case of a viewing angle 4 deg, it appears that the results are reversed compared to the other viewing angles, i.e., the standard CMOS camera shows better results than the camera with a nonlinear response curve. This is attributed to the low number of data points in the transition region of the curves since the increments of irradiance levels that were chosen were too large for a proper fit curve. This should be changed in future experiments. Fig. 6Fraction of correctly discriminated triangle orientations as a function of laser irradiance for the standard CMOS camera and the camera with a nonlinear response curve. 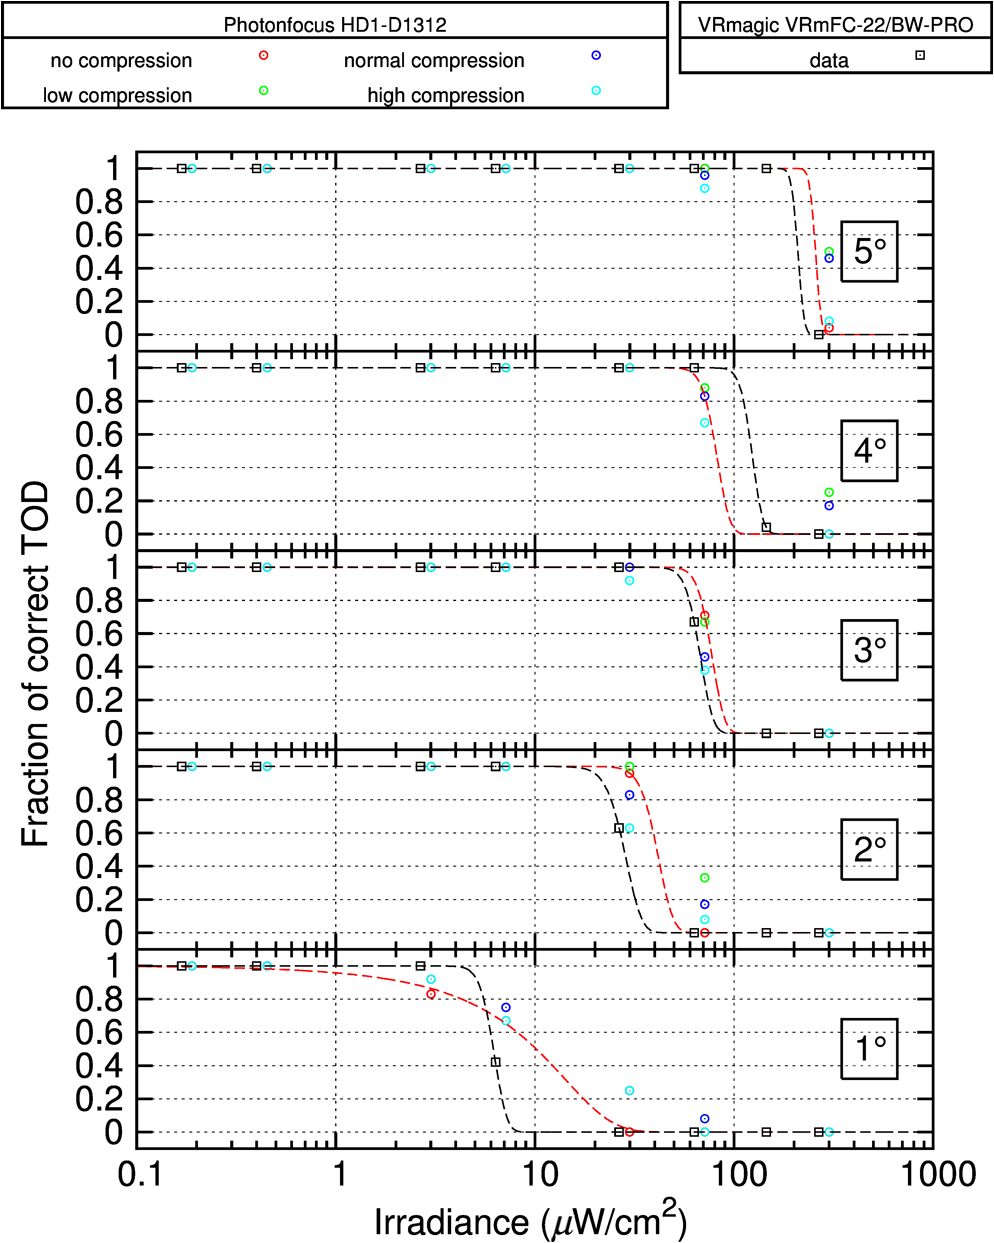 From the fit curves of Fig. 6, we can deduce the level of irradiance at which a fraction of 50% is correctly discriminated. These values can be interpreted as the irradiance levels at which information within a visual half angle of 1 deg, 2 deg, 3 deg, 4 deg, and 5 deg is lost. Figure 7 shows a plot of such obscuration radii as a function of irradiance. As a guide to the eye, power functions of the form were fitted to the data points. The lower the curve, the lower is the sensor’s vulnerability to laser irradiation. Fig. 7Angular obscuration radius as a function of laser irradiance for the standard CMOS camera and the camera with a nonlinear response curve.  Figure 8 presents the results for the hardened sensor (DMD + wavelength multiplexing). In the lower part of the figure, a graph shows the fraction of correctly discriminated triangle orientations as a function of irradiance. The upper part of the plot shows the fractions for the case of deactivated dazzling protection; the lower part of the plot shows the fractions for activated protection. For three selected irradiance levels, corresponding sensor images with and without activated protection are shown in the upper part of Fig. 8. For low laser irradiance (), all triangles are correctly recognized. As expected, this is not the case for higher irradiances without activated protection. With activated protection, the algorithm was able to recognize triangles and discriminate their orientation in the center part of the image. Fig. 8Fraction of correctly discriminated triangle orientations as a function of laser irradiance for the hardened sensor. The upper plot shows the fraction when the active dazzling protection was not activated. The lower plot shows the fraction with active protection. 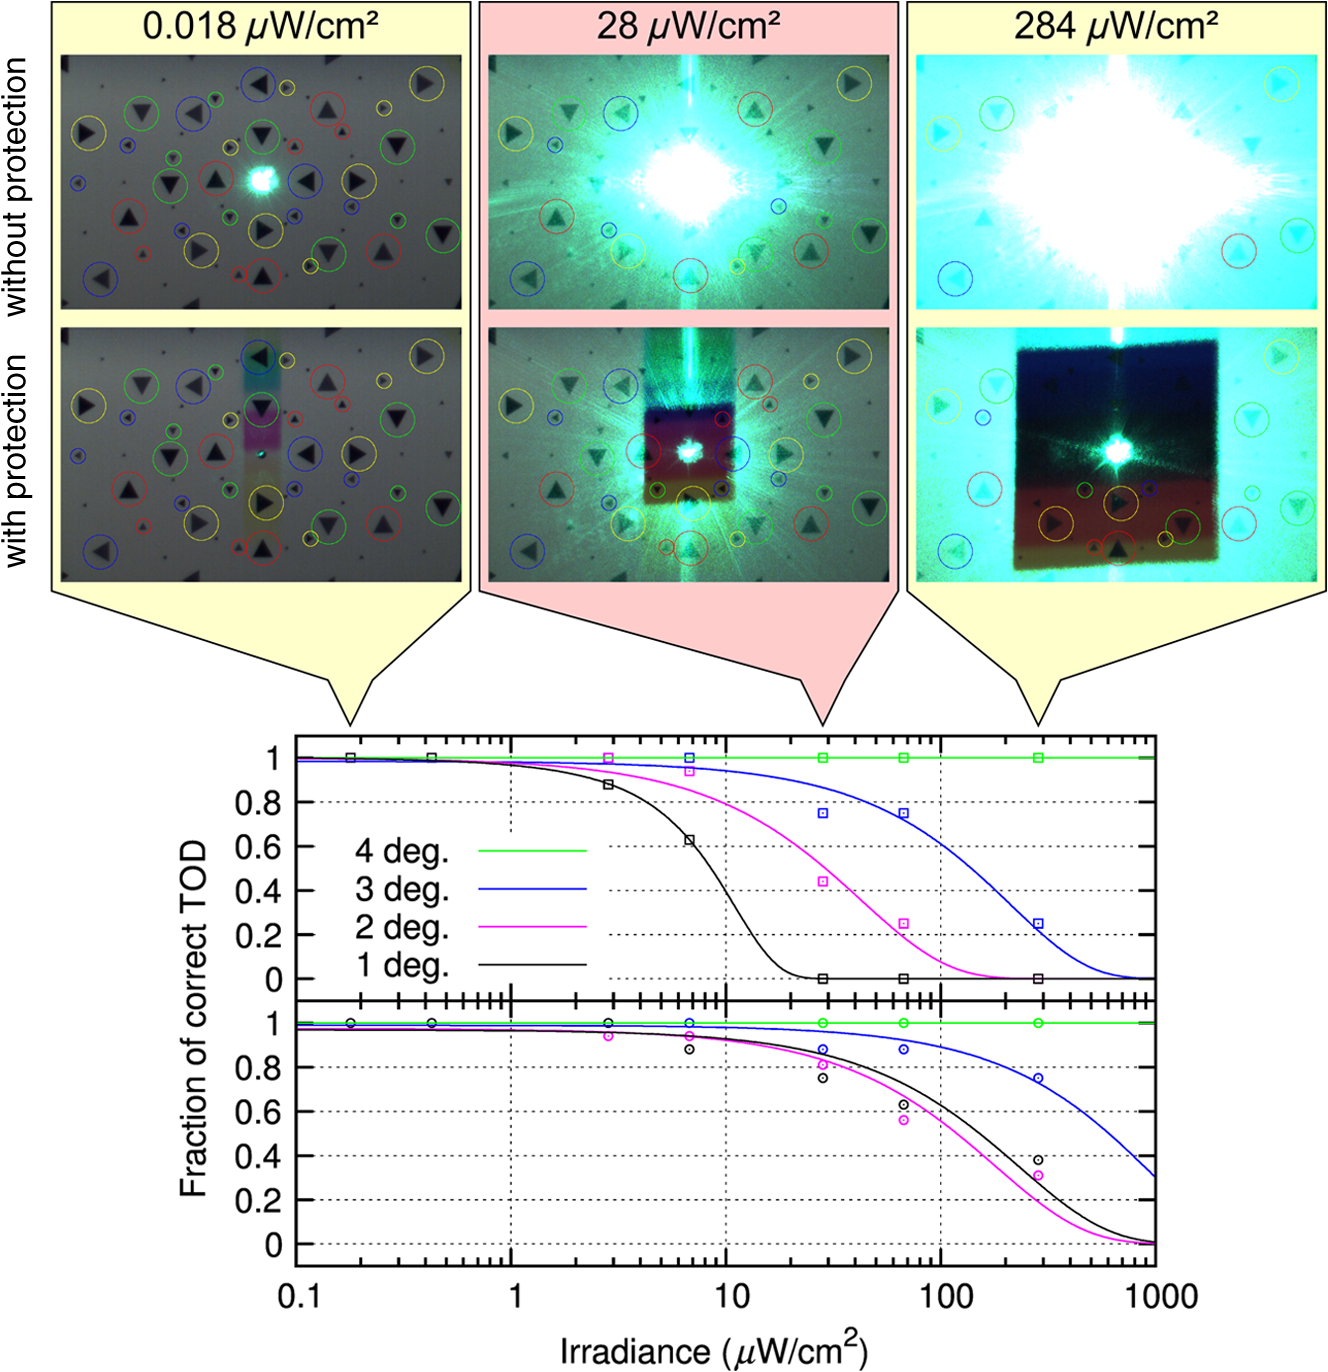 This behavior can also be seen in the graph: the curves shift to higher irradiance levels when the protection mechanism is activated. In more detail, the 50% levels of correctly discriminated triangle orientations show shifts to higher irradiance levels by factors of 17.7, 4.1 and 4.4 for the 1 deg, 2 deg, and 3 deg curves, respectively. However, these values should be handled with care, as the data points for the case of activated protection do not allow a reliable curve fit (see the graph in the lower part of Fig. 8). For these measurements, only the large- and medium-sized triangles were taken into account, since the template matching did not work reliably for the small triangles. This can be explained by the fact that the sensor’s optics were optimized for large distances and all components are mechanically fixed. In our experiments, the target’s distance was only 518 cm and thus the test chart was not perfectly imaged on the DMD. 5.2.Structural Similarity IndexThe SSIM is a method for measuring the similarity between two images, and , and is computed according to the following equation:21 Here, is the average of , is the average of , is the variance of , is the variance of , is the covariance of and , and , . is the dynamic range of the pixel values () and , . Usually, Eq. (1) is applied to a small window of pixels of the images and , which is slid over the images to be evaluated. The result is the mean of the values computed for all single windows. In our case, the window length was . The graph in Fig. 9 shows the computed SSIM index as a function of the laser irradiance regarding the camera with the nonlinear response curve. The different curves represent the different logarithmic compressions chosen. Additionally, for the case of a high irradiance, dazzling scenes for the different compressions are shown. Fig. 9Structural similarity (SSIM) index as a function of the laser peak irradiance for the camera with a nonlinear response curve. The color of the data points corresponds to the compression mode of the camera. 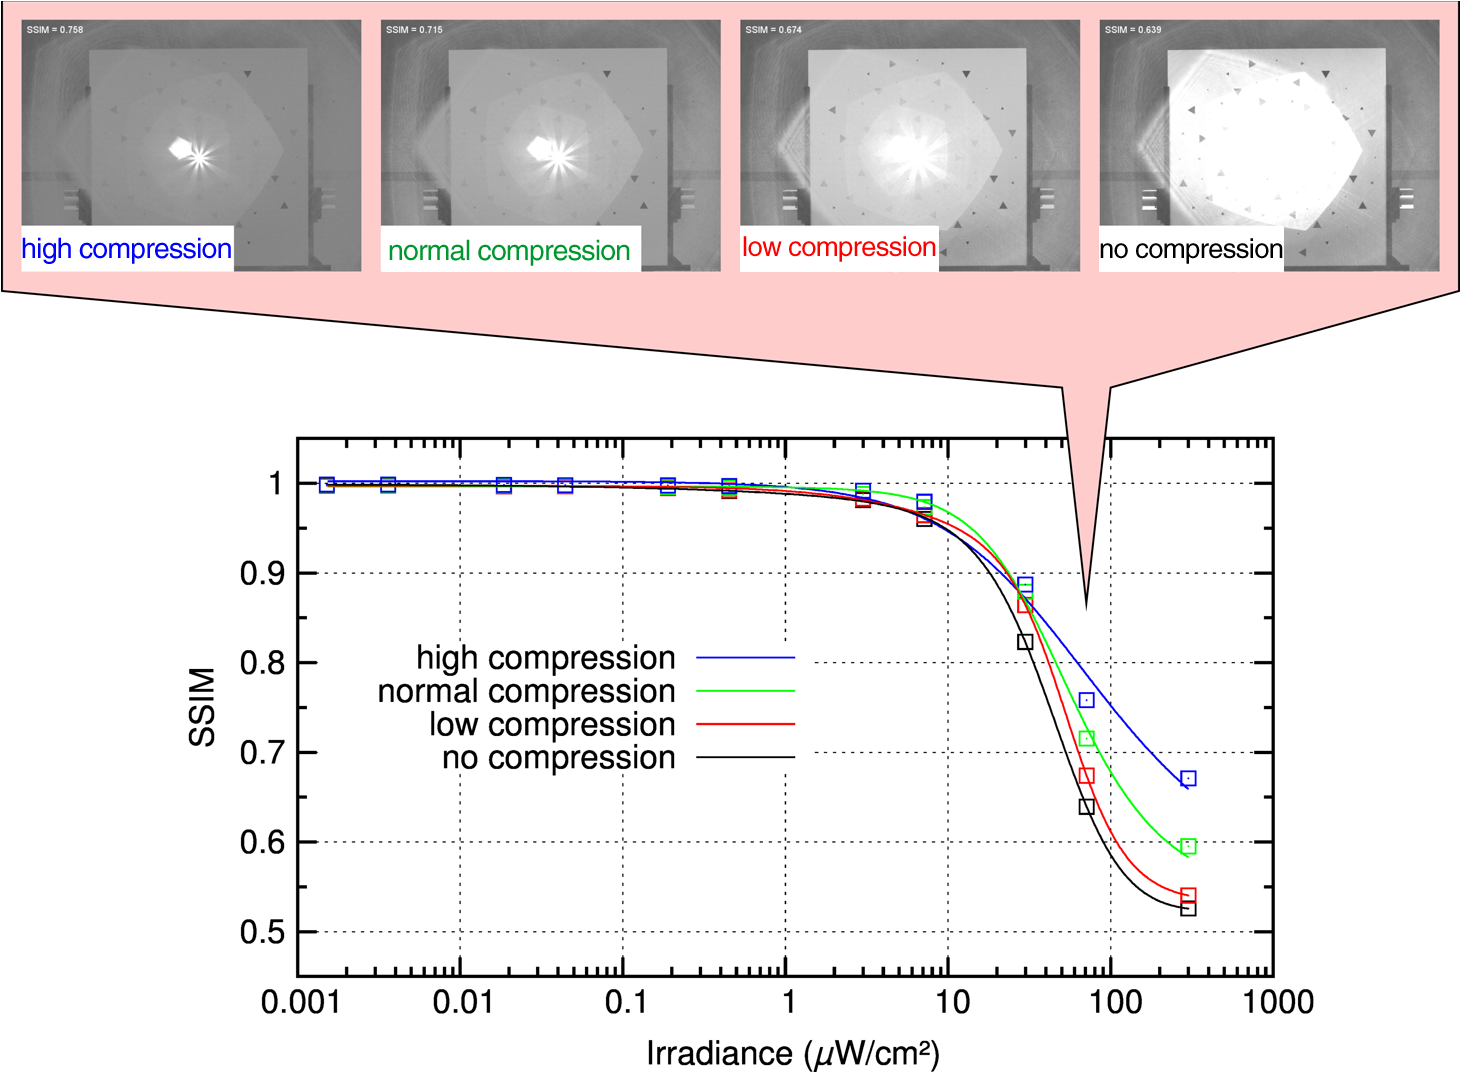 In contrast to the TOD measurements, a comparison of the SSIM curves for the two tested cameras is not possible. This is due to the different camera parameters (field of view and pixel size) influencing the calculation of the SSIM according to Eq. (1) and thus resulting in different SSIM values. Figure 10 shows the results for the hardened sensor (DMD + wavelength multiplexing). The black squares (and the black fit curve) represent the SSIM index as a function of irradiance when the protection measure was not activated. The red crosses depict the computed SSIM for the sensor with activated protection. Fig. 10SSIM index as function of the laser peak irradiance for the hardened sensor: The black data points indicate the SSIM for the case that the protection is not active. The red data points (and the highlighted area) indicate the SSIM with active protection. The blue data points show the increase of SSIM with irradiance due to the protection measure in percent. 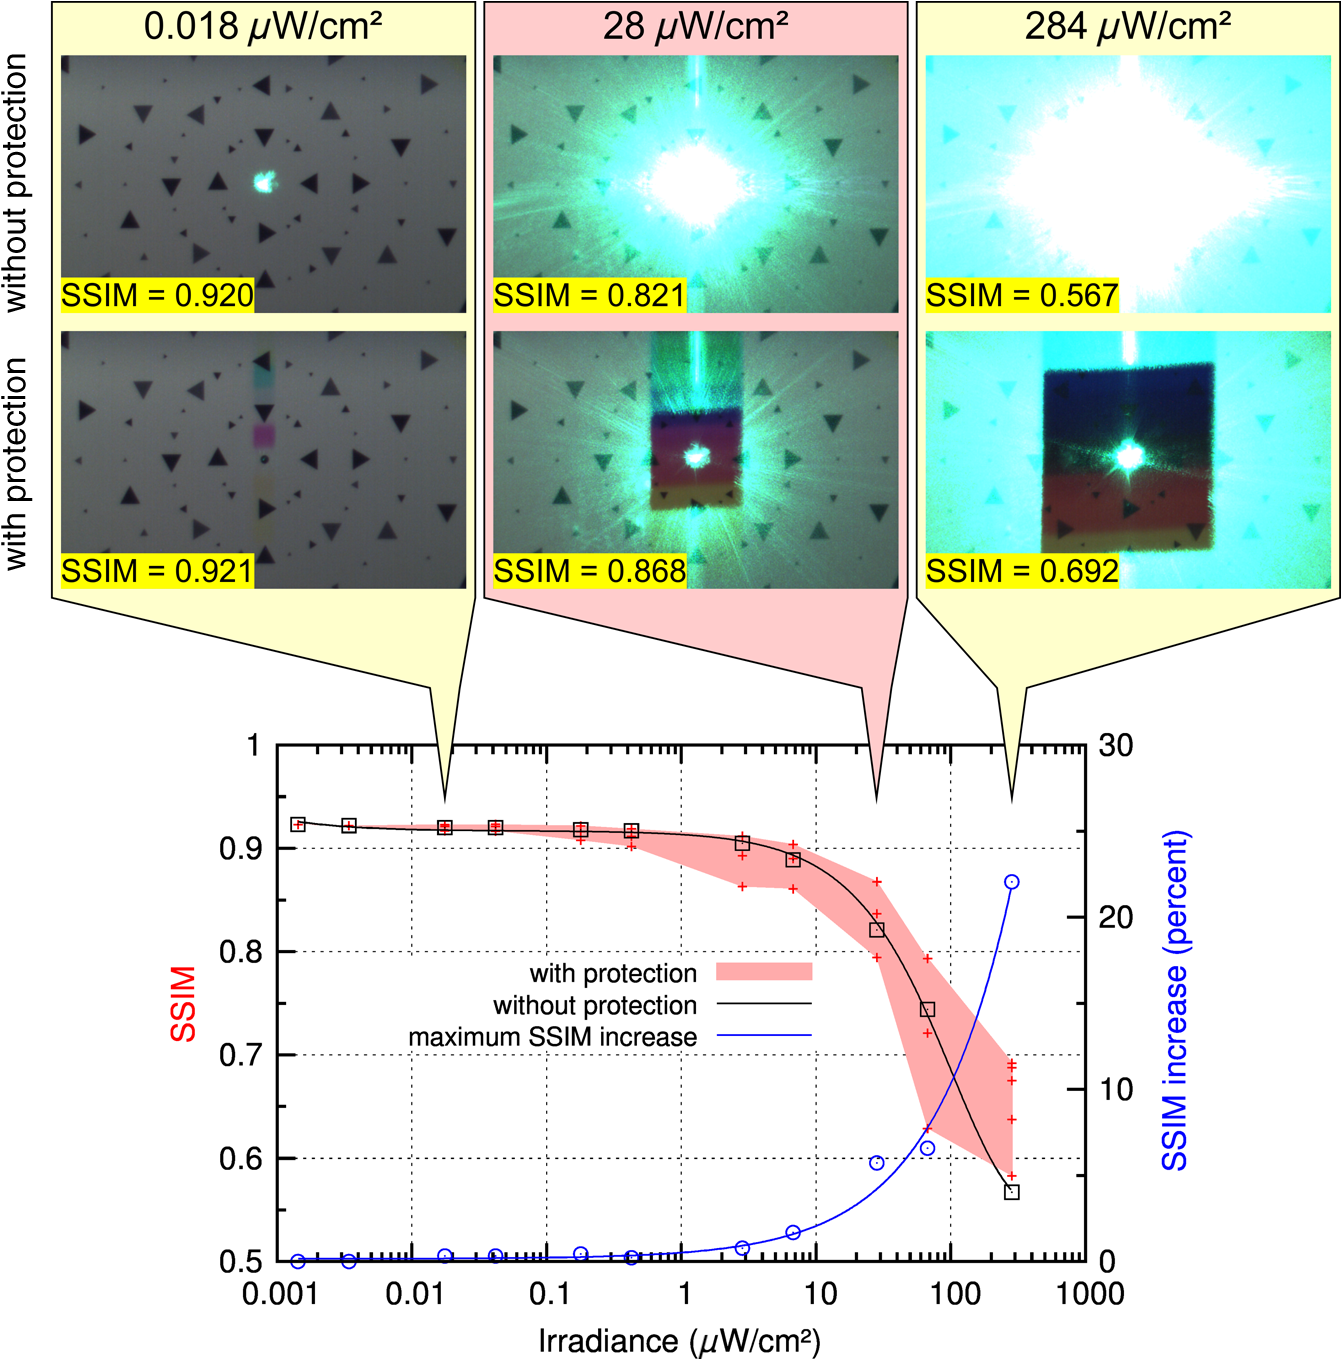 As one can observe, there exist several red crosses at each individual irradiation level. The reason for these multiple measurement points is that at each level different numbers of micromirrors were activated to evaluate their dependency on the recognition process. Increasing the number of micromirrors improves the attenuation of laser radiation, i.e., laser radiation will be suppressed in a larger part of the field of view. However, the transmission drops and the color distortion expands over a larger part of the field of view reducing the image contrast, what in turn has an influence on the SSIM. The area of the plot highlighted in red shows the span of SSIM for different sets of suppression levels. Highlighted regions above the black curve represent a parameter set of the control loop algorithm, where the activation of the protection measure is an advantage. The blue circles (and the blue fit curve) represent the increase of the SSIM due to the protection measure obtained in our measurements. For the highest value of irradiance (), the increase in SSIM was 22%. As a further result, we observed that the lower the number of activated micromirrors, the higher the value of the SSIM metric. On the other hand, without micromirror activation, the SSIM value is lower than the maximum achievable SSIM value. Thus, we conclude that there is an optimum number of micromirrors that should be activated in order to maintain a maximum of scene information. For both measurements presented, we do not get large differences in the value of the SSIM when the protection measure is activated (i.e., increasing the compression rate for the CMOS camera with nonlinear response curve or activation of micromirrors for the DMD sensor). We attribute this result to the design of our test chart. The test chart consists of a homogeneous background with several triangular test patterns on it. Therefore, any homogeneous image has a high similarity. Laser dazzling of the sensor results in a homogeneously overexposed area in the camera image with some of the triangular test patterns gone. Thus, the difference in structural information is rather low as is the difference in SSIM. The SSIM approach may be better suited for a strongly structured test chart or a realistic scene. In addition to the assessment of the laser protection performance, calculating the SSIM index can be used to tune the parameters of the control loop algorithm to optimize its performance. 6.ConclusionsWe have presented two different approaches for the assessment of the performance of laser protection devices. The first approach depends on TOD. The sensor has to observe a test chart with a multitude of triangles of different sizes, orientations, and contrasts while being dazzled by laser radiation. An automatic pattern recognition algorithm then estimates the orientation of the residual visible triangles. The advantage of this method lies in the possibility of an extensive analysis: the protection performance can be assessed, for example, for different viewing cones, target resolutions, and contrasts. The image data can also be used to verify the results by observer experiments. The second approach presented is based on the computation of the SSIM. This method is less complex than the TOD method. However, since the computed results depend on the number of sensor pixels, images from sensors with different parameters, (e.g., pixel size, field of view, contrast sensitivity, or signal-to-noise ratio), will yield different values for the SSIM. Thus, a comparison of different sensor performances is difficult. This method is mainly suited to assess the performance of a specific laser protection measure. Using the same sensor, dazzled images must be taken with and without a protection measure. Comparing the corresponding SSIM values provides an indication as to what extent the information content of the observed scene can be preserved by the protection measure. In future studies, we want to test the SSIM approach with a more realistic scene that contains more structural information than the current test pattern consisting of triangles on a homogeneous background. In addition, the SSIM method can be easily used to optimize the parameters of the protection measures. ReferencesG. Ritt, D. Walter and B. Eberle,
“Research on laser protection: an overview of 20 years of activities at Fraunhofer IOSB,”
Proc. SPIE, 8896 88960G
(2013). http://dx.doi.org/10.1117/12.2029083 PSISDG 0277-786X Google Scholar
G. Ritt, S. Dengler and B. Eberle,
“Protection of optical systems against laser radiation,”
Proc. SPIE, 7481 74810U
(2009). http://dx.doi.org/10.1117/12.829963 PSISDG 0277-786X Google Scholar
M. Koerber et al.,
“Analysis of key properties for optical power limiting and the influence of nonlinear scattering,”
Proc. SPIE, 9253 92530Z
(2014). http://dx.doi.org/10.1117/12.2067134 PSISDG 0277-786X Google Scholar
O. Muller et al.,
“Size and shape effects on the nonlinear optical behavior of silver nanoparticles for power limiters,”
Appl. Opt., 52 139
–149
(2013). http://dx.doi.org/10.1364/AO.52.000139 APOPAI 0003-6935 Google Scholar
G. Ritt and B. Eberle,
“Electro-optical sensor with spatial and spectral filtering capability,”
Appl. Opt., 50 3847
–3853
(2011). http://dx.doi.org/10.1364/AO.50.003847 APOPAI 0003-6935 Google Scholar
G. Ritt and B. Eberle,
“Automatic suppression of intense monochromatic light in electro-optical sensors,”
Sensors, 12 14113
–14128
(2012). http://dx.doi.org/10.3390/s121014113 SNSRES 0746-9462 Google Scholar
G. Ritt and B. Eberle,
“Electro-optical sensor with automatic suppression of laser dazzling,”
Proc. SPIE, 8541 85410P
(2012). http://dx.doi.org/10.1117/12.971186 PSISDG 0277-786X Google Scholar
S. Svensson et al.,
“Countering laser pointer threats to road safety,”
Proc. SPIE, 6402 640207
(2006). http://dx.doi.org/10.1117/12.689057 PSISDG 0277-786X Google Scholar
F. E. Hernández et al.,
“Dual focal plane visible optical limiter,”
J. Nonlinear Opt. Phys. Mat., 9 423
–440
(2000). http://dx.doi.org/10.1142/S0218863500000388 JNOMFV 0218-8635 Google Scholar
A. Durécu et al.,
“Assessment of laser-dazzling effects on TV-cameras by means of pattern recognition algorithms,”
Proc. SPIE, 6738 67380J
(2007). http://dx.doi.org/10.1117/12.737264 PSISDG 0277-786X Google Scholar
A. Durécu, O. Vasseur and P. Bourdon,
“Quantitative assessment of laser-dazzling effects on a CCD-camera through pattern-recognition-algorithms performance measurements,”
Proc. SPIE, 7483 74830N
(2009). http://dx.doi.org/10.1117/12.833975 PSISDG 0277-786X Google Scholar
N. Hueber et al.,
“Analysis and quantification of laser-dazzling effects on IR focal plane arrays,”
Proc. SPIE, 7660 766042
(2010). http://dx.doi.org/10.1117/12.850236 PSISDG 0277-786X Google Scholar
R. (H.) M. A. Schleijpen et al.,
“Laser dazzling of focal plane array cameras,”
Proc. SPIE, 6543 65431B
(2007). http://dx.doi.org/10.1117/12.718602 PSISDG 0277-786X Google Scholar
R. (H.) M. A. Schleijpen et al.,
“Laser dazzling of focal plane array cameras,”
Proc. SPIE, 6738 67380O
(2007). http://dx.doi.org/10.1117/12.747009 PSISDG 0277-786X Google Scholar
K. W. Benoist and R. H. M. A. Schleijpen,
“Modeling of the over-exposed pixel area of CCD cameras caused by laser dazzling,”
Proc. SPIE, 9251 92510H
(2014). http://dx.doi.org/10.1117/12.2066305 PSISDG 0277-786X Google Scholar
P. Bijl and J. M. Valeton,
“Triangle orientation discrimination: the alternative to minimum resolvable temperature difference and minimum resolvable contrast,”
Opt. Eng., 37
(7), 1976
–1983
(1998). http://dx.doi.org/10.1117/1.601904 OPEGAR 0091-3286 Google Scholar
T. Ojala, M. Pietikäinen and D. Harwood,
“A comparative study of texture measures with classification based on featured distributions,”
Pattern Recognit., 29 51
–59
(1996). http://dx.doi.org/10.1016/0031-3203(95)00067-4 PTNRA8 0031-3203 Google Scholar
T. Ahonen, A. Hadid and M. Pietikäinen,
“Face description with local binary patterns: application to face recognition,”
IEEE Trans. Pattern Anal. Mach. Intell., 28 2037
–2041
(2006). http://dx.doi.org/10.1109/TPAMI.2006.244 ITPIDJ 0162-8828 Google Scholar
D.-J. de Lange, J. M. Valeton and P. Bijl,
“Automatic characterization of electro-optical sensors with image processing using the triangle orientation discrimination (TOD) method,”
Proc. SPIE, 4030 104
–111
(2000). http://dx.doi.org/10.1117/12.391770 PSISDG 0277-786X Google Scholar
M. A. Hogervorst, P. Bijl and J. M. Valeton,
“Capturing the sampling effects: a TOD sensor performance model,”
Proc. SPIE, 4372 62
–72
(2001). http://dx.doi.org/10.1117/12.439162 PSISDG 0277-786X Google Scholar
Z. Wang et al.,
“Image quality assessment: from error visibility to structural similarity,”
IEEE Trans. Image Process., 13 600
–612
(2004). http://dx.doi.org/10.1109/TIP.2003.819861 IIPRE4 1057-7149 Google Scholar
T. Svensson,
“An evaluation of image quality metrics aiming to validate long term stability and the performance of NUC methods,”
Proc. SPIE, 8706 870604
(2013). http://dx.doi.org/10.1117/12.2016374 PSISDG 0277-786X Google Scholar
H. Stoehr and C. Softley,
“CMOS chip technology for automotive imagers,”
Proc. SPIE, 5663 190
–197
(2005). http://dx.doi.org/10.1117/12.602057 PSISDG 0277-786X Google Scholar
G. A. Feather and D. W. Monk,
“Digital micromirror device for projection display,”
Proc. SPIE, 2407 90
–95
(1995). http://dx.doi.org/10.1117/12.205883 PSISDG 0277-786X Google Scholar
C. J. Koester,
“Wavelength multiplexing in fiber optics,”
J. Opt. Soc. Am., 58 63
–67
(1968). http://dx.doi.org/10.1364/JOSA.58.000063 JOSAAH 0030-3941 Google Scholar
J. P. Lewis,
“Fast template matching,”
in Proc. Vision Interface ‘95,
120
–123
(1995). Google Scholar
BiographyGunnar Ritt is a research associate at Fraunhofer IOSB in Ettlingen, Germany. He received his Diploma and PhD degrees in physics from the University of Tübingen, Germany, in 1999 and 2007, respectively. His main research focus is on laser protection. Michael Koerber has been a research scientist at Fraunhofer IOSB in Ettlingen, Germany, since 2013. He is part of the optical countermeasure and laser protection group and participates in several projects. He received his MS degree in physics at the University of Konstanz in 2012. He works in the field of laser spectroscopy, nonlinear optics, femtosecond optics, and optical countermeasures. Bernd Eberle is a senior scientist at Fraunhofer IOSB in Ettlingen, Germany, where he is head of the optical countermeasure and laser protection group. He received his Diploma degree in physics at the University of Konstanz in 1983. He received his PhD degree in physics at the University of Konstanz in 1987. His research activities comprise laser technology, laser spectroscopy, nonlinear optics, femtosecond optics, optical countermeasures including protection against laser radiation and imaging laser sensors. |