|
|
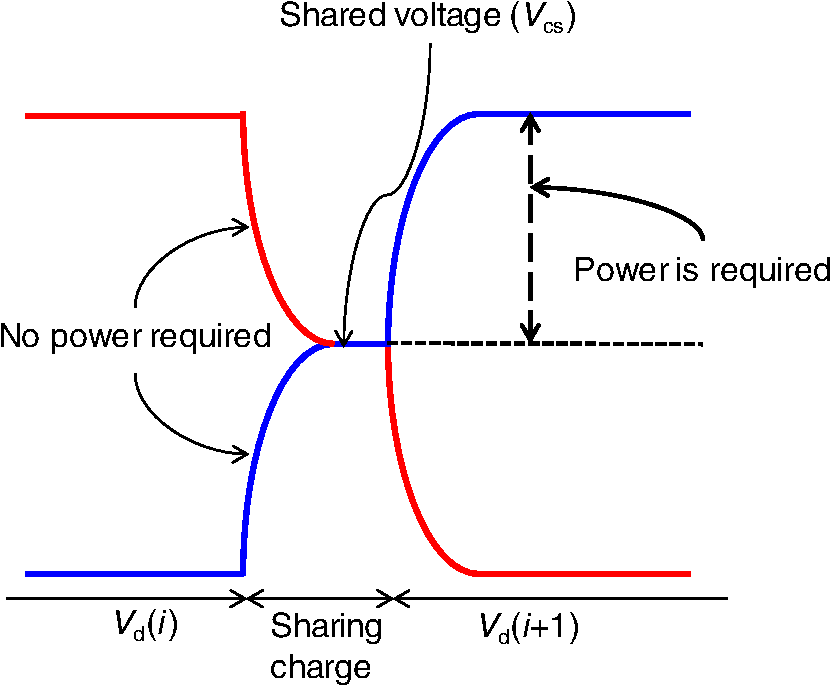
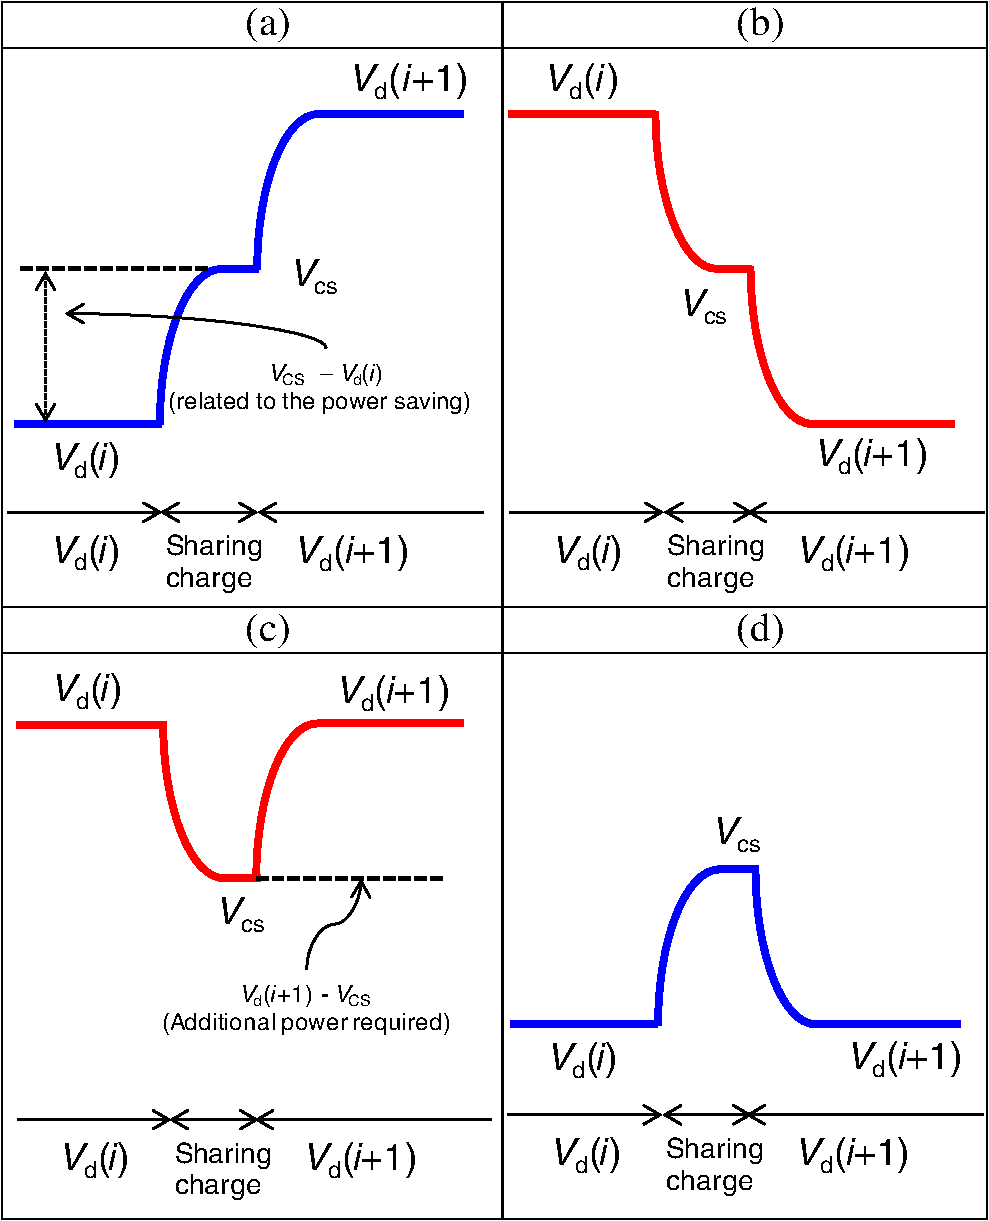
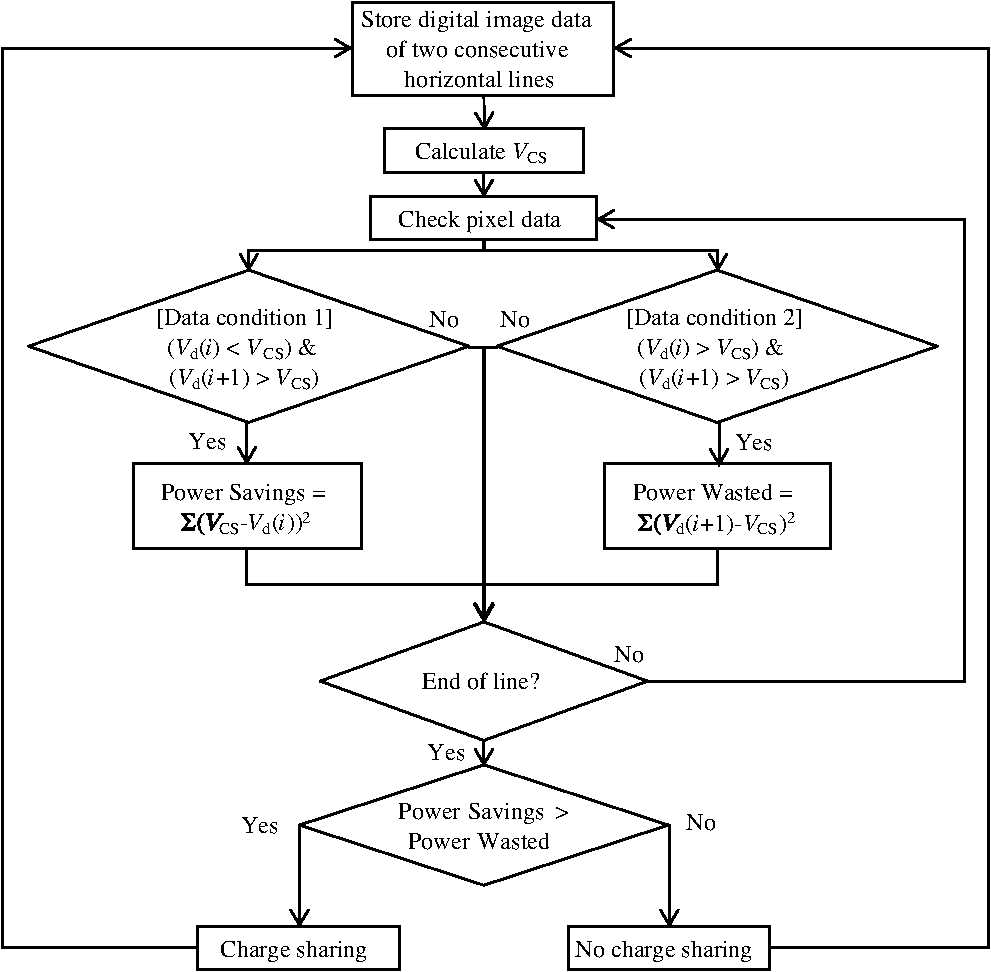
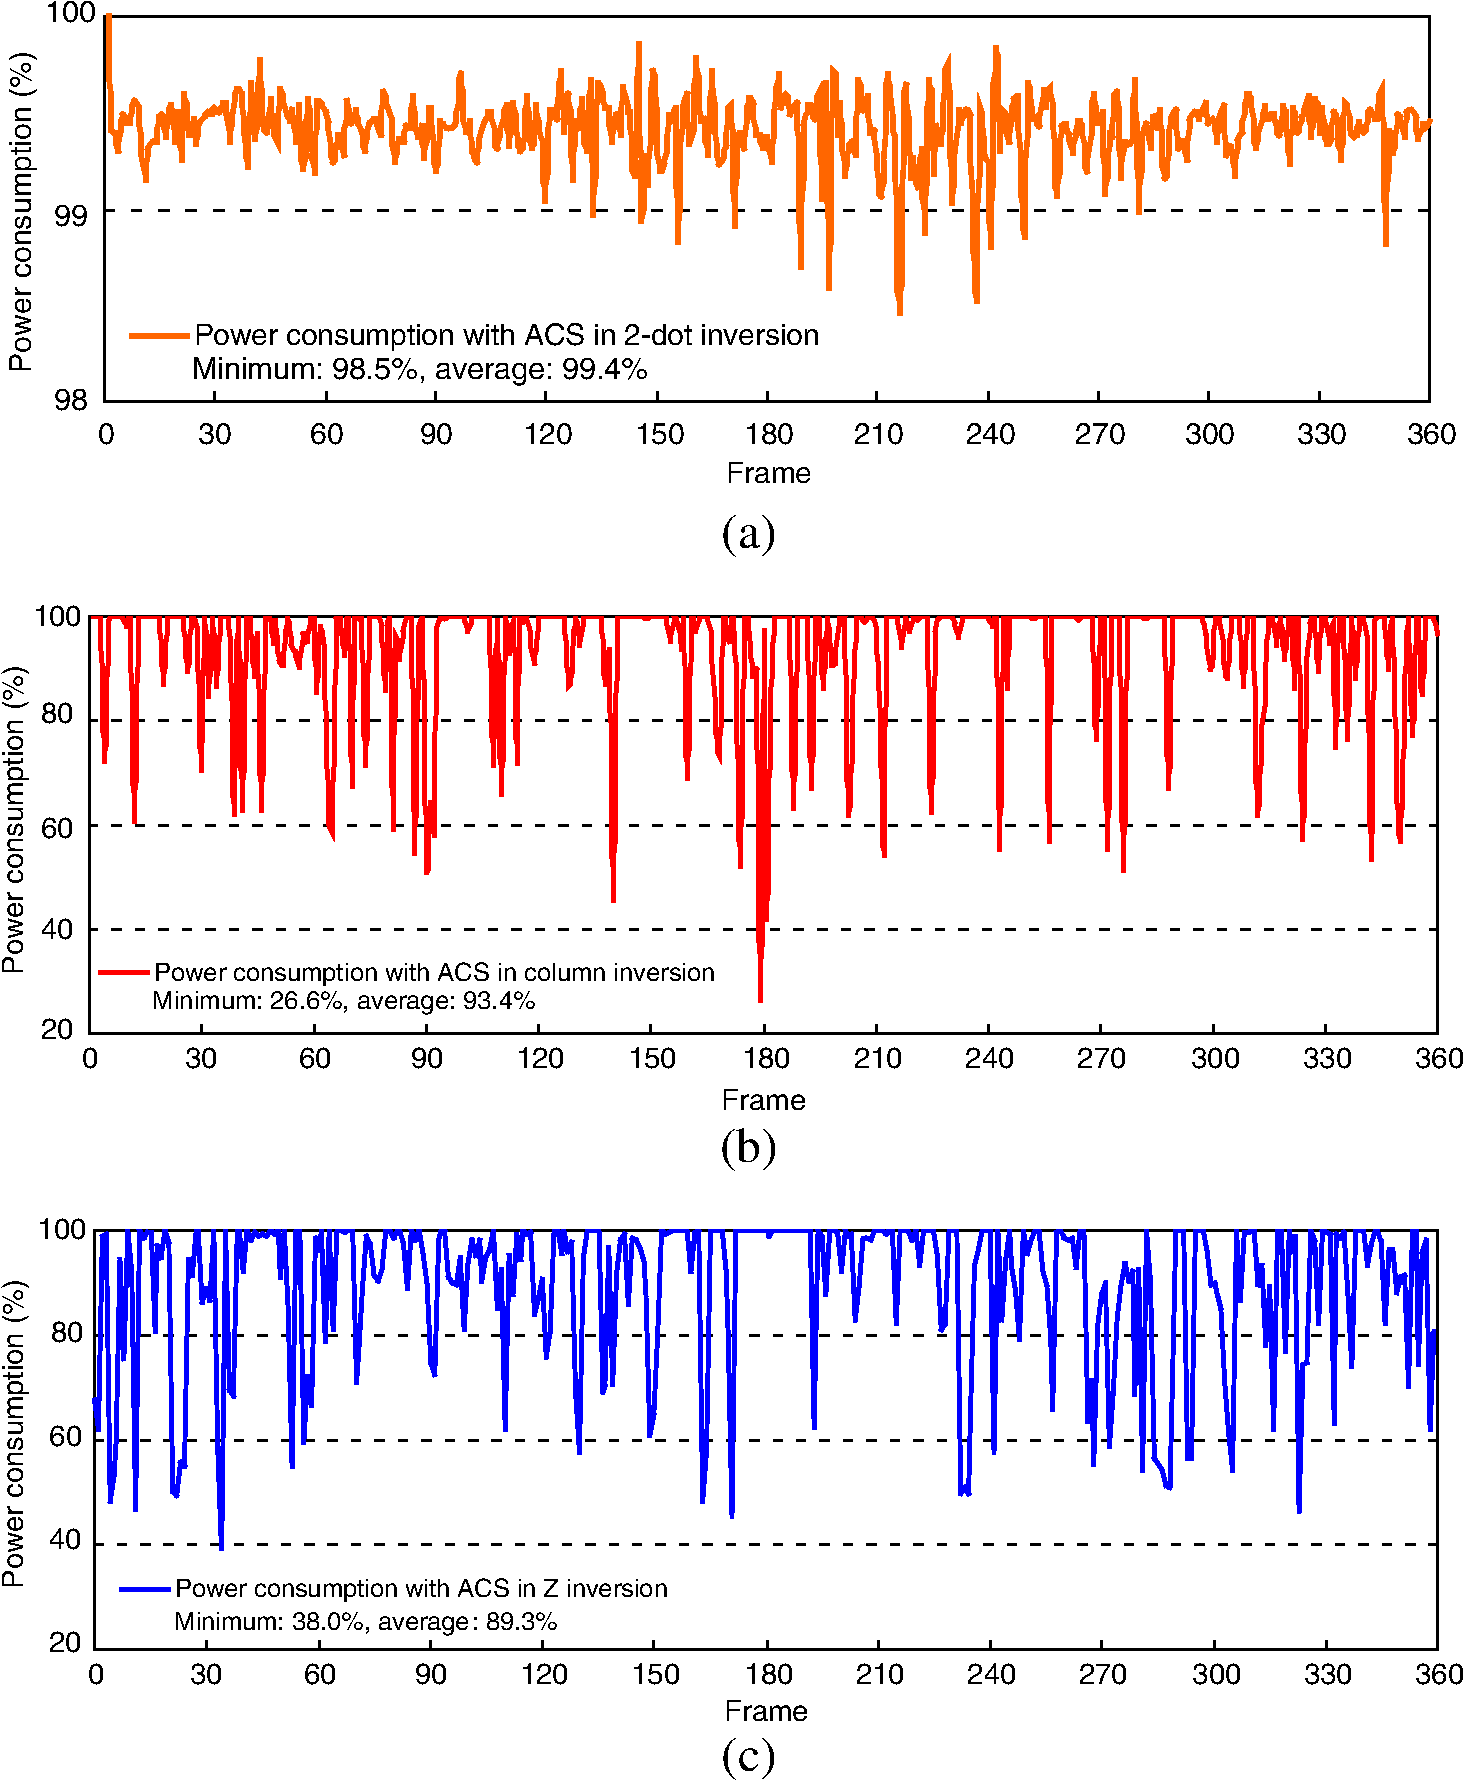
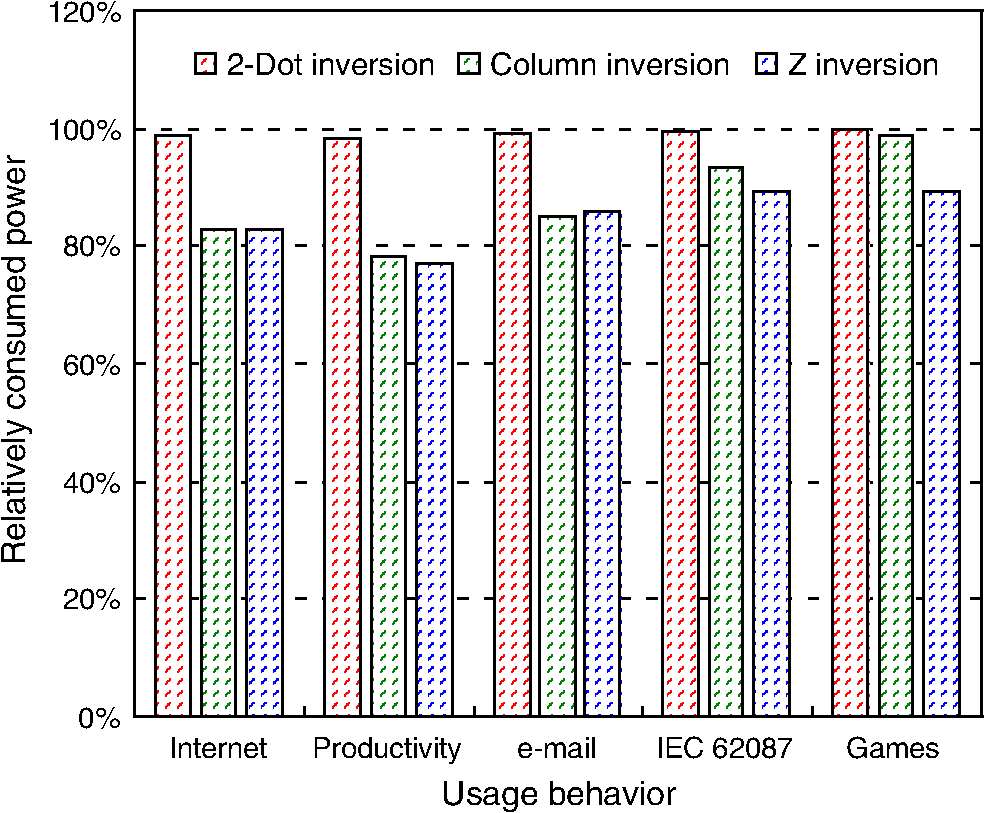
1.IntroductionPower consumption in liquid crystal displays (LCDs) is currently the subject of intensive research.1–7 To achieve lower power consumption with higher image quality in LCDs, various techniques have been studied, including backlight dimming technologies,8–15 inversion methods,16–18 and charge sharing (CS) methods.19–25 Column inversion provides very low power consumption because only one polarity change occurs per frame. However, column inversion is susceptible to line flicker, which is particularly noticeable when a vertical line pattern is displayed.26 Dot inversion is widely recognized as the best inversion method for achieving a higher image quality.27 However, dot inversion increases power consumption because multiple polarity changes occur per frame.28 In addition, dot inversion is susceptible to flicker patterns corresponding to the dot pattern.28 To reduce power consumption and avoid the visual imperfections of dot inversion, Z inversion and two-dot inversion methods have been developed.29,30 Figures 1(a) and 1(b) depict the pixel arrangements and driving schemes of the Z and two-dot inversion methods, respectively. In Z inversion, pixels are alternately connected to one data (column) line. Thus, with Z inversion, the spatial arrangement of polarities is the same as that of dot inversion, though the voltages applied to a data line are similar to those of column inversion, as shown in Fig. 1(a). In this way, Z inversion consumes lower power than dot inversion. With two-dot inversion, the polarities of the data lines are the same for two adjacent lines, as shown in Fig. 1(b). Consequently, the operating frequency of two-dot inversion is reduced by half compared to dot inversion, and thus the power consumption is also reduced by half. Fig. 1Pixel arrangement and driving scheme of (a) the Z inversion method and (b) the two-dot inversion method.  To further reduce power consumption in LCDs, the CS technique was developed. Conventional CS involves electrically connecting all data lines whenever polarity changes. Because the positive and negative voltages in data lines are alternately applied column by column and row by row in dot inversion, charge is transferred to the neighboring data lines while the data lines are electrically connected. Thus, the voltage levels of adjacent data lines become the average value of the previous voltages of these two data lines. Power consumption with dot inversion is ideally reduced by half. With column and Z inversion, however, some data lines do not experience a polarity change from one frame to the next. Thus, unnecessary CS may lead to an increase in power consumption when conventional CS is applied to column and Z inversion. In this paper, we propose an adaptive charge sharing (ACS) method intended to reduce power consumption when two-dot, column, or Z inversion is used. The proposed method analyzes image data and determines whether or not to share charge. By considering the various types of analog data transitions, the ACS method selectively shares charge between data lines only when CS provides an overall reduction in power consumption. In Sec. 2, we review the basic principle of CS. In Sec. 3, we describe the ACS method. In Sec. 4, we present the results of applying our method via simulations. Finally, we summarize and conclude the paper in Sec. 5. 2.Basic Principle of Charge SharingFigure 2 depicts the analog voltage transitions of two adjacent data lines when CS occurs. The CS technique conserves energy by using the electric charge of data lines with higher potential to raise the voltages of the other data lines. The electric charge is shared by electrically connecting the data lines. When data lines are tied together and are also disconnected from any active sources, electric charge drifts from data lines of higher potential to data lines of lower potential. The transferred charge raises the potential of these latter data lines using energy that would otherwise be lost. When CS occurs (see Fig. 2), all analog voltages at the ’th line time, , reach the shared voltage level without any additional power. Thus, power is consumed only when the analog voltage at the () ’th line time, , is higher than . Therefore, the efficacy of CS depends on the distribution of the different types of analog voltage transitions among shared lines. Thus, it is necessary to carefully consider these analog voltage transitions. Figure 3 depicts four types of analog voltage transitions. Figure 3(a) and 3(b) represent the large voltage swings, that is, . Figures 3(c) and 3(d) represent the small voltage swings, that is, . In the case of Fig. 3(a), power consumption is reduced by an amount proportional to . The power consumption for Figs. 3(b) and 3(d) is zero because these transitions do not require any charge from the source drivers. In the case of Fig. 3(c), however, power consumption is increased by an amount proportional to as a result of unnecessary CS. 3.Adaptive Charge Sharing MethodTo further reduce power consumption in LCDs driven by column, Z, and two-dot inversion techniques, we consider a situation in which data lines are connected for CS even when no polarity change occurs. Then we identify the number of beneficial [Fig. 3(a)] and detrimental [Fig. 3(c)] voltage transitions as and , respectively. Even if is larger than , this does not ensure that overall power consumption will be reduced because the amplitude of analog voltages influences power consumption more than the ratio of beneficial to detrimental transitions. The power savings can be calculated using Eq. (1), and the power wasted as a result of unnecessary CS can be calculated using Eq. (2). Thus, as shown in Eq. (3), the net power savings can be determined based on the values generated by Eqs. (1) and (2). When Eq. (3) , net power savings are achieved, thus CS is desirable Figure 4 presents a flowchart for determining when to share charge in the ACS method. First, the shared voltage should be calculated. To calculate , we need to analyze image data for two horizontal lines in advance. Thus, image data for two consecutive horizontal lines must be stored in memory. Second, data for every pixel are analyzed to determine whether the data transition corresponds to data condition 1 or 2. Here, conditions 1 and 2 correspond to Eqs. (1) and (2), respectively. Third, power savings and power wasted are calculated until the end of the ’th line time. Finally, CS is enabled if the power savings are greater than the power wasted. In this method, one horizontal line time is needed to store image data for the next horizontal line [the ()’th line], and one more line time is required to determine whether or not to share charge. Thus, the method involves a delay of two horizontal line times, corresponding to a delay of approximately . 4.Results and DiscussionIn order to verify the effectiveness of our ACS method, we designed MATLAB simulations to analyze the effects on power consumption when two-dot, column, and Z inversion methods are used. According to survey data, Internet browsing, productivity applications, e-mail, and instant messaging account for 76% of the usage of mobile devices, and these are all text based.31 Thus, reducing power consumption for text-based applications is critical for extending battery life. We calculated the power consumption for 30 images, with 10 images per usage category (i.e., Internet, productivity, and e-mail). We also used images taken from the International Electrotechnical Commission (IEC) 62087 standard video clip. The running time of the IEC 62087 standard video clip with a 30 Hz refresh rate is 10 minutes. We sampled the video every 50 frames and thus acquired 360 images for our simulation. In addition, we included in the simulation images captured from game applications. We simulated the power consumption with two-dot, column, and Z inversion based on an analog voltage versus digital data curve, as shown in Fig. 5. We extracted the analog voltage versus digital data curve by directly measuring the output voltage of the driver ICs in a twisted nematic LCD display. We measured positive and negative polarity voltages simultaneously depending on the data of the displayed full-screen image. The actual power consumption is determined by voltage transitions, not by digital data, thus we need to calculate the power consumption using analog voltages corresponding to the image data. Figure 6 shows the power consumption of the ACS method as a percentage of the power consumption of conventional CS for the 360 images acquired from the IEC 62087 standard video clip. Figures 6(a), 6(b), and 6(c) represent the power consumption percentage when the display uses two-dot, column, and Z inversion methods, respectively. As shown in Fig. 6(a), the ACS method consumes an average of 99.4% of the conventional CS power with two-dot inversion. The average relative power consumption with column inversion [Fig. 6(b)] and Z inversion [Fig. 6(c)] are 93.4% and 89.3%, respectively. Table 1 summarizes the power consumption results with two-dot, column, and Z inversion for images corresponding to five categories: Internet, productivity, e-mail, IEC 62087, and games. There are four columns for two-dot inversion in Table 1. The CS column presents power consumption when conventional CS is applied. The No CS column presents power consumption when CS is not applied. The forced CS column is included for additional comparison; these data indicate the power consumption when CS is applied every line time. Conventionally, the CS method is performed by electrically connecting all data lines whenever the polarities of the data signals change. The conventional CS method reduces the power consumption with two-dot inversion because CS is performed when polarities change every second line time. Thus, the average power consumption with no CS is 376.8% relative to the power consumption with CS, as shown in Table 1. Forced CS increases power consumption by 5.9% compared to conventional CS with two-dot inversion because CS is applied every line time with this method. Because all data lines do not experience a polarity change with column or Z inversion until the next frame time, power consumption with no CS is almost the same as that with conventional CS when column or Z inversion is used. Thus, there are only three columns for column and Z inversion: no CS/CS, forced CS, and ACS. As shown in Table 1, the relative average power consumption with two-dot inversion was only reduced to 99.1% when ACS was applied. However, the relative average power consumption was reduced to 87.7% and 84.7% when ACS was applied to column and Z inversion, respectively. This indicates that, in general, the column and Z inversion methods are desirable for low power applications. These results demonstrate that our ACS method can significantly reduce power consumption in LCDs using column inversion or Z inversion. Our results also show that the ACS method is more beneficial when text-based images are displayed. Figure 7 presents the relative power consumption according to usage category. The red, green, and blue bars correspond to the relative power consumption with the two-dot, column, and Z inversion method, respectively. As shown in Fig. 7, the proposed method provides greater power savings with text-based images. Thus, with our ACS approach, laptops and mobile devices will offer significantly increased battery life, considering that these devices are used primarily for text-based applications. We calculated the weighted power consumption for each inversion method by taking into consideration the percentage of device usage for each category. Table 2 presents the weighted power consumption ratios. As shown in Table 2, the relative power consumption of the ACS method is 85.8% and 84.2% with column and Z inversion, respectively, when usage characteristics are considered. Table 1Power consumption results with two-dot, column, and Z inversion for different usage categories and different charge sharing methods.
Table 2Weighted power consumption results with the ACS method for two-dot, column, and Z inversion.
5.ConclusionWe proposed an ACS method for reducing power consumption in LCDs driven with two-dot, column, and Z inversion methods. By considering all types of analog data transitions, the ACS method shares the charge between data lines only when CS ensures an overall reduction in power consumption. Our simulation results demonstrate that this ACS method successfully reduces power consumption, especially when column or Z inversion is used. Furthermore, our method ensures that power consumption never increases as a result of CS, regardless of the inversion method. There is currently much interest in incorporating higher resolution displays into mobile devices, and our ACS technique can contribute to significantly lower LCD power consumption and thus to significantly longer battery life. AcknowledgmentsThis work was supported by the ICT R&D program of MSIP/IITP (10041416, the core technology development of light and space adaptable energy-saving I/O platform for future advertising service). ReferencesY. Yamauchi et al.,
“A novel pixel memory using integrated voltage-loss-compensation (VLC) circuit for ultra-low-power TFT-LCDs,”
J. Soc. Inf. Disp., 19
(1), 57
–62
(2011). http://dx.doi.org/10.1889/JSID19.1.57 JSIDE8 0734-1768 Google Scholar
J. H. Ahn,
“Implementation of an LED tile controller for high-quality image display,”
Displays, 34
(1), 17
–26
(2013). http://dx.doi.org/10.1016/j.displa.2012.10.004 DISPDP 0141-9382 Google Scholar
S. I. Cho, S. J. Kang and Y. H. Kim,
“Image quality-aware backlight dimming with color and detail enhancement techniques,”
J. Disp. Technol., 9
(2), 112
–121
(2013). http://dx.doi.org/10.1109/JDT.2012.2236299 JDTEDS 0193-2691 Google Scholar
X. Wang et al.,
“Autostereoscopic 3D pictures on optically rewritable electronic paper,”
J. Soc. Inf. Disp., 21
(2), 103
–107
(2013). http://dx.doi.org/10.1002/jsid.v21.2 JSIDE8 0734-1768 Google Scholar
C. Mantel et al.,
“Controlling power consumption for displays with backlight dimming,”
J. Disp. Technol., 9
(12), 933
–941
(2013). http://dx.doi.org/10.1109/JDT.2013.2260131 JDTEDS 0193-2691 Google Scholar
E. Song and H. Nam,
“Shoot-through current reduction scheme for low power LTPS TFT programmable shift register,”
J. Soc. Inf. Disp., 22
(1), 18
–22
(2014). http://dx.doi.org/10.1002/jsid.219 JSIDE8 0734-1768 Google Scholar
E. Song and H. Nam,
“Low power programmable shift register with depletion mode oxide TFTs for high resolution and high frame rate AMFPDs,”
J. Disp. Technol., 10
(10), 834
–838
(2014). http://dx.doi.org/10.1109/JDT.2014.2327206 JDTEDS 0193-2691 Google Scholar
L. Kerofsky and S. Daly,
“Brightness preservation for LCD backlight dimming,”
J. Soc. Inf. Disp., 14
(12), 1111
–1118
(2006). http://dx.doi.org/10.1889/1.2408394 JSIDE8 0734-1768 Google Scholar
K. Käläntär,
“A monolithic segmented functional light guide for 2-D dimming LCD backlight,”
J. Soc. Inf. Disp., 19
(1), 37
–47
(2011). http://dx.doi.org/10.1889/JSID19.1.37 JSIDE8 0734-1768 Google Scholar
S. R. Kim et al.,
“Adaptive 1D dimming technique compensating for non-uniform side-lit backlight profile,”
in Proc. of IMID’11,
31
–32
(2011). Google Scholar
Y. Sano, R. Nonaka and M. Baba,
“Wide gamut LCD using locally dimmable four-primary-color LED backlight,”
J. Soc. Inf. Disp., 20
(9), 539
–546
(2012). http://dx.doi.org/10.1002/jsid.115 JSIDE8 0734-1768 Google Scholar
S. C. Hsia et al.,
“High-performance local dimming algorithm and its hardware implementation for LCD backlight,”
J. Disp. Technol., 9
(7), 527
–535
(2013). http://dx.doi.org/10.1109/JDT.2013.2237755 JDTEDS 0193-2691 Google Scholar
S. J. Kang,
“Processor-based backlight dimming using computation reduction technique,”
J. Disp. Technol., 9
(10), 819
–824
(2013). http://dx.doi.org/10.1109/JDT.2013.2261280 JDTEDS 0193-2691 Google Scholar
S. J. Kang,
“SSIM preservation-based backlight dimming,”
J. Disp. Technol., 10
(4), 247
–250
(2014). http://dx.doi.org/10.1109/JDT.2014.2302299 JDTEDS 0193-2691 Google Scholar
M. Kim, J. M. Kim and S. W. Lee,
“Standard color liquid crystal displays by a dimming technology,”
Color Res. Appl., 39
(5), 480
–485
(2014). http://dx.doi.org/10.1002/col.v39.5 CREADU 0361-2317 Google Scholar
B. D. Choi and O. K. Kwon,
“Stepwise data driving method and circuits for low-power TFT-LCDs,”
IEEE Trans. on Consum. Electron., 46
(4), 1155
–1160
(2000). http://dx.doi.org/10.1109/30.920473 Google Scholar
C. W. Lu and K. J. Hsu,
“A high-speed low-power rail-to-rail column driver for AMLCD application,”
IEEE J. Solid State Circuits, 39
(8), 1313
–1320
(2004). http://dx.doi.org/10.1109/JSSC.2004.831475 IJSCBC 0018-9200 Google Scholar
C. W. Lu and L. C. Huang,
“A 10-bit LCD column driver with piecewise linear digital-to-analog converters,”
IEEE J. Solid State Circuits, 43
(2), 371
–378
(2008). http://dx.doi.org/10.1109/JSSC.2007.914274 IJSCBC 0018-9200 Google Scholar
J. S. Kim, D. K. Jeong and G. Kim,
“A multi-level multi-phase charge-recycling method for low-power AMLCD column drivers,”
IEEE J. Solid State Circuits, 35
(1), 74
–84
(2000). http://dx.doi.org/10.1109/4.818922 IJSCBC 0018-9200 Google Scholar
S. S. Yang et al.,
“A multi-phase charge-sharing technique without external capacitor for low-power TFT-LCD column drivers,”
in Proc. of ISCAS’03,
365
–368
(2003). Google Scholar
S. S. Kim et al.,
“An 82-in. ultra-definition 120-Hz LCD TV using new driving scheme and advanced super PVA technology,”
J. Soc. Inf. Disp., 17
(2), 71
–78
(2009). http://dx.doi.org/10.1889/JSID17.2.71 JSIDE8 0734-1768 Google Scholar
D. Lee et al.,
“Novel driving and panel design of frame inversion method for high aperture ratio in the large size and high resolution LCD TV panel,”
Soc. Inf. Disp. Symp. Dig., 42
(1), 342
–345
(2011). http://dx.doi.org/10.1889/1.3621316 Google Scholar
H. Nam and J. H. Shim,
“Image independent driving power reduction for high frame rate LCD televisions,”
ETRI J., 34
(3), 470
–473
(2012). http://dx.doi.org/10.4218/etrij.12.0211.0365 1225-6463 Google Scholar
S. R. Kim et al.,
“A new smart charge sharing method for liquid crystal displays with lower power consumption in Z-inversion,”
in Proc. of IDW ’13,
1454
–1455
(2013). Google Scholar
D. U. Kim, J. S. Kim and B. D. Choi,
“A low-power data driving method with enhanced charge sharing technique for large-screen LCD TVs,”
J. Disp. Technol., 11
(4), 346
–352
(2015). http://dx.doi.org/10.1109/JDT.2015.2392757 JDTEDS 0193-2691 Google Scholar
B. H. You et al.,
“A novel driving method using 2-dimension spatial averaging for high speed driving of AMLCD,”
Soc. Inf. Disp. Symp. Dig., 38
(1), 1725
–1728
(2007). http://dx.doi.org/10.1889/1.2785659 0097-966X Google Scholar
S. W. Lee, J. S. Kim and C. H. Han,
“Pixel arrangement for low-power dot inversion liquid crystal display panels,”
Electron Lett., 34
(16), 1604
–1606
(1998). http://dx.doi.org/10.1049/el:19981094 ELLEAK 0013-5194 Google Scholar
S. L. Wright, S. Millman and M. Kodate,
“Measurement and digital compensation of cross talk and photoleakage in high-resolution TFT LCDs,”
Proc. SPIE, 3636 200
–211
(1999). http://dx.doi.org/10.1117/12.344647 PSISDG 0277-786X Google Scholar
Y. S. Son et al.,
“A column driver with low-power area-efficient push-pull buffer amplifiers for active-matrix LCDs,”
in IEEE Int. Digest of Technical Papers (ISSCC 2007),
142
–143
(2007). Google Scholar
S. C. Yun et al.,
“New driving method for low logic power consumption in TFT-LCDs,”
Soc. Inf. Disp. Symp. Dig., 41
(1), 619
–621
(2010). http://dx.doi.org/10.1889/1.3500545 0097-966X Google Scholar
S. Kwa et al.,
“Panel self-refresh technology: decoupling image update from LCD panel refresh in mobile computing systems,”
Soc. Inf. Disp. Symp. Dig., 43
(1), 644
–646
(2012). http://dx.doi.org/10.1002/j.2168-0159.2012.tb05864.x 0097-966X Google Scholar
BiographySeung-Ryeol Kim received his BS and MS degrees in physics and information display from Kyung Hee University, Republic of Korea, in 2010 and 2013, respectively, where he is currently working toward his PhD in the Department of Information Display. His research interests include driving methods and circuits for liquid-crystal display (LCD) and three-dimensional display and driving technology for novel input devices. Jong-Man Kim received his BS and MS degrees in physics and information display from Kyung Hee University, Republic of Korea, in 2010 and 2012, respectively. He is currently working toward his PhD in the Department of Information Display at Kyung Hee University. His research interests include driving methods and circuits for LCD and e-paper displays and driving technology for color motion performance of LCDs. Minkoo Kim received his BS and MS degrees from the Department of Information Display at Kyung Hee University, Republic of Korea, in 2011 and 2013, respectively. He is currently working toward his PhD in the same department at Kyung Hee University. His research interests include driving methods and circuits for various types of displays, including LCD and organic light diodes. Seung-Woo Lee received his MS and PhD degrees in electrical engineering from KAIST in 1995 and 2000, respectively. He joined Samsung in 2000, where his work has focused on the development of key driving technologies for active-matrix LCDs. Currently, he is an associate professor in the Department of Information Display at Kyung Hee University. He has been active with the Society for Information Display as a senior member. He became an IEEE senior member in 2010. |
||||||||||||||||||||||||||||||||||||||||||||||||||||||||||||||||||||||||||||||||||||||||||||||||||||||||||||||||||||||||||||||||||||||||||