|
|
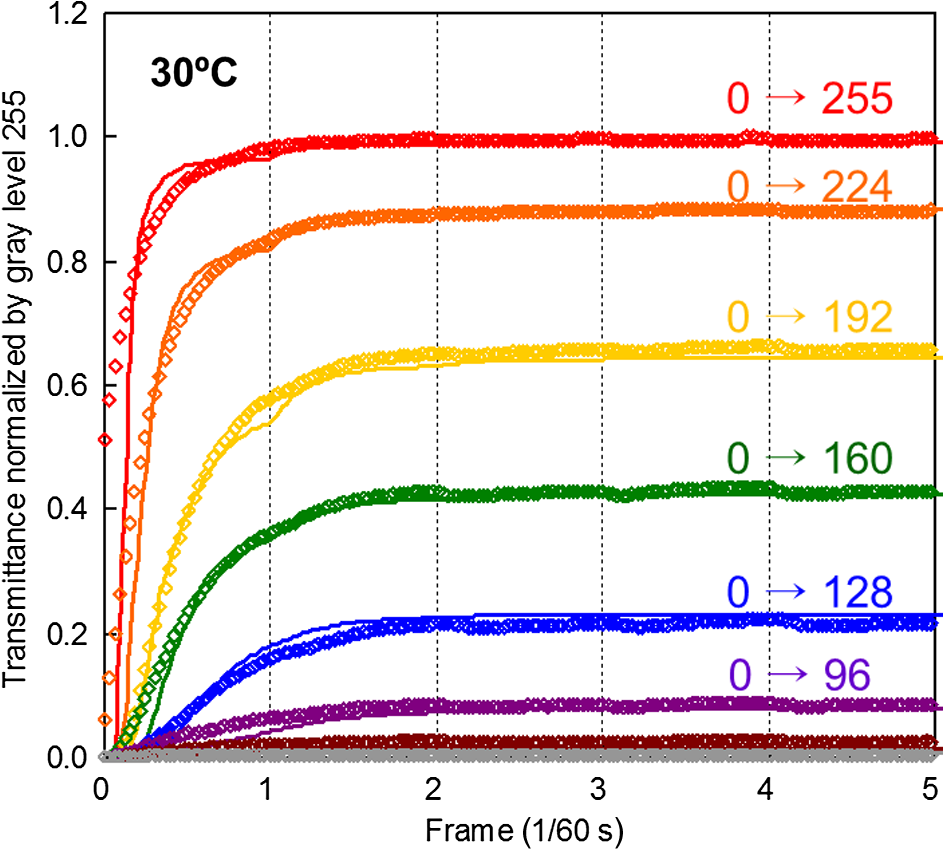
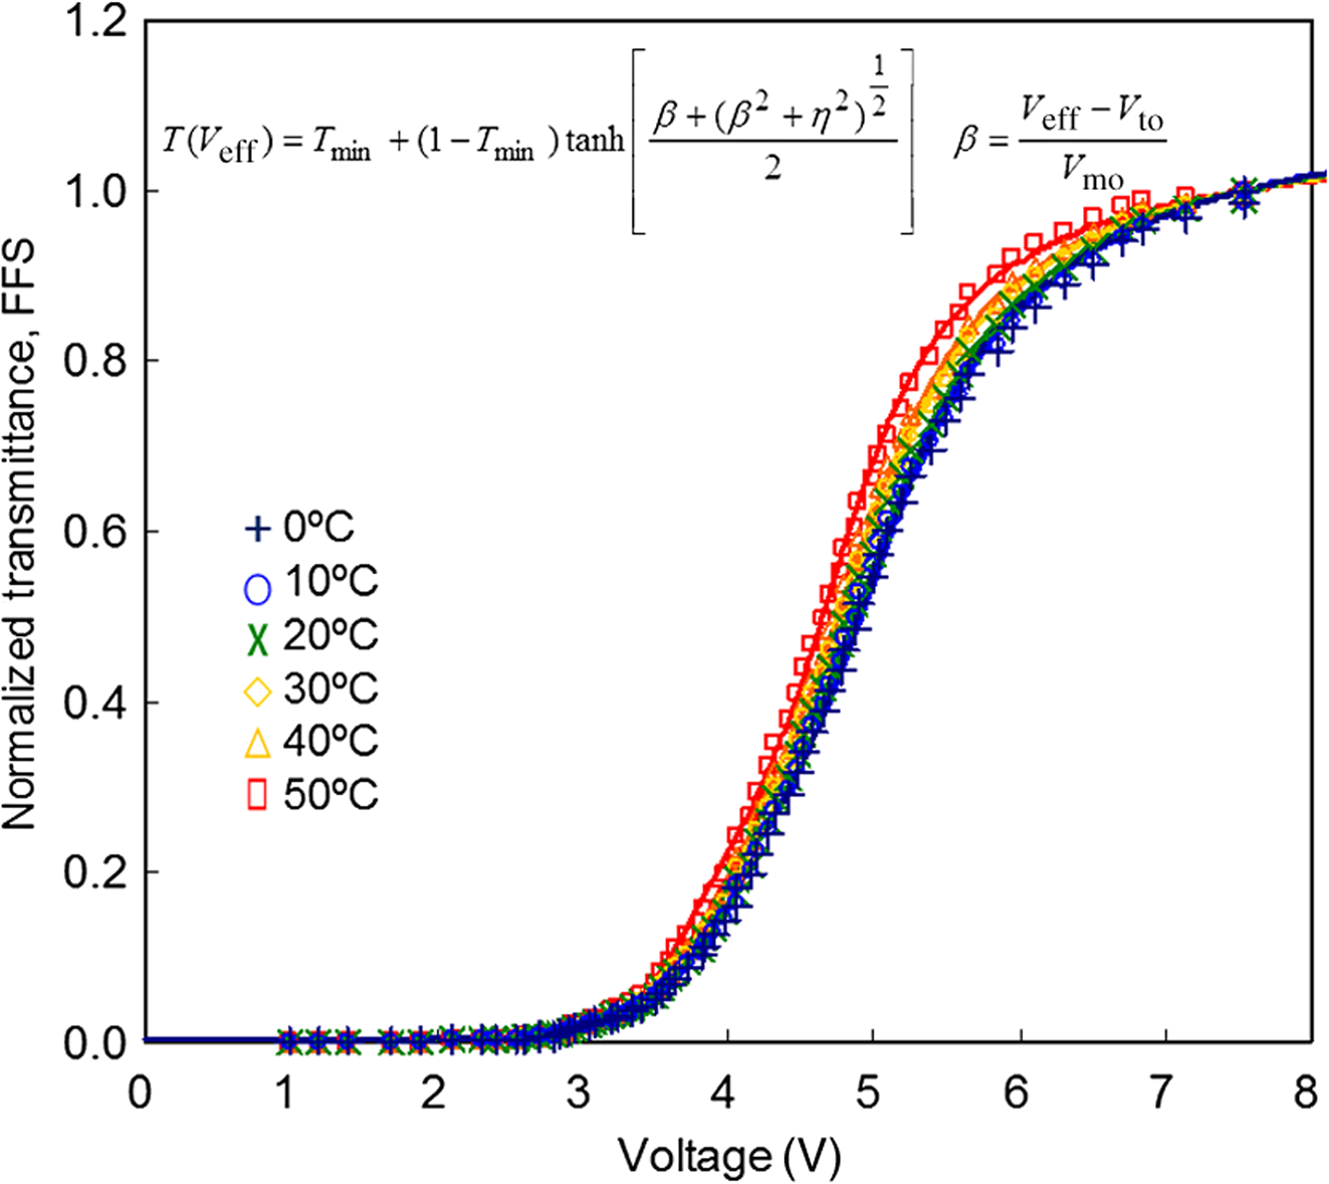
1.IntroductionLiquid crystal display (LCD) technology is rapidly becoming a universal choice for display applications because of its high performance and low power requirement. LCDs are now being used for mobile devices, computer monitors, large-sized televisions, and digital information displays.1–4 This means that the LCDs operate in diverse environments, such as cold and hot climates.1 However, color and response characteristics of LCDs are strongly affected by their ambient temperature.5,6 Therefore, the temperature-dependent characteristics of LCDs should be carefully investigated. In order to achieve higher and advanced performance of active-matrix LCDs (AMLCDs), electrical and optical characteristics of the liquid crystal (LC) should be accurately predicted. Conventionally, the electrical and optical behaviors of LC can be solved using Poisson and Euler–Lagrange equations. 7,8 These mathematical methods guarantee accurate results if all the environmental variables are known.7,8 However, these equations require significant computational time. In addition, these methods are also not compatible with circuit simulations. To solve these problems, we successfully developed a behavioral circuit model of AMLCDs by applying a first-order circuit system.9–13 In this model, the first-order circuit system is represented by a simple resistor-capacitor (RC) circuit. Further, the behavioral circuit model’s universality is verified over many types of LC modes, such as the twisted nematic, in-plane switching (IPS), patterned vertical alignment, and charge-shared vertical alignment modes.9,10 In this paper, we propose a temperature-dependent behavioral circuit model to predict the optical characteristics of AMLCDs with a fringe-field switching (FFS) mode. In Sec. 2, the behavioral model of pixels in AMLCDs is reviewed. In Sec. 3, we investigate the capacitance-voltage () and transmittance-voltage () characteristics of the temperature-dependent behavioral circuit model of FFS panel. In Sec. 4, the application results of the proposed model are presented. Also, the relationship between the time-constant parameters and the temperature is investigated. Finally, the conclusion is drawn in Sec. 5. 2.Review of De Smet’s Macro-ModelIn this section, we review the macro-model proposed by De Smet et al.7 The model presents a method to simulate the optical response of an LC cell depending on the externally applied direct-current voltage. In order to achieve a simpler LC model, two assumptions were made such that the model did not lose its accuracy. The first assumption is that the behavior of all the LC molecules can be represented by a single director LC, even though a unit pixel has many LC molecules in it. The second assumption is that the LC molecules, at an equilibrium state, are affected by three main forces: (1) electric (), (2) elastic (), and (3) viscous () as shown in Fig. 1(a). Thus, the motion equation can be described as where , , , , and denote the electric field across the LC cell, a linear proportionality constant, the elastic constant, the viscosity, and an average director orientation of LC molecules with time, respectively. The electric field can be replaced with the applied voltage as follows:Fig. 1Conceptual diagram of the first-order circuit model: (a) simplified mechanical model and (b) schematic of the circuit model.  and are the applied data voltage across the LC cell and the cell gap, respectively. Thus, the representative equilibrium motion equation is obtained as First-order linear differential equations can be modeled by a simple RC circuit. Figure 1(b) shows a schematic diagram of our circuit model. Equation (3) can be behaviorally described by the RC circuit. In order to improve the accuracy, Watanabe et al. modified the time constant () concept on the basis of De Smet et al.’s approach.14 The time constant is given by Eq. (4), where and are the physical parameters that represent the LC characteristics. Furthermore, we defined an effective voltage, , as follows: proves helpful to determine the LC characteristics since it is directly related to , the orientation of LC molecules that defines the capacitance and transmittance of an LC cell. If the steady-state characteristics of the LC cell are known, the transient capacitance can be determined, for a given . However, is not identical to the voltage across the LC cell. The voltage of the cell can be calculated by considering the current through the pixel, as shown in Fig. 1(b). Therefore, characteristics are the most important parameters to establish the circuit model of the pixel. In addition, the transient optical responses can also be obtained if the characteristics are known. In case of FFS mode, the pixel and the common electrodes are located in the lower glass substrate, which is not the same as shown in Fig. 1(a). Thus, the behavioral model cannot be applied to the panel structure of FFS mode. However, we have already verified that this model can be applied to the IPS mode.11 In this paper, we investigate the relationship between the behavioral characteristics of FFS mode and the ambient temperature. A behavioral model developed by considering a unique pixel structure of FFS mode is expected to be reported in the near future. Therefore, the above-described relations are implemented by using the analog hardware description language Verilog-A. The FFS panel is simulated by importing the behavioral circuit model into the circuit simulator SmartSPICE. Figure 2 shows the rising transitions of the FFS panel starting from gray level 0 at 30°C. Symbols and lines represent the measurement and simulation results, respectively. In the simulation, time-constant parameters and take the values and , respectively. As shown in Fig. 2, there is a very good match between the simulation and measurement results for the rising transitions. 3.Temperature-Dependent Behavioral Circuit Model3.1.Capacitance–Voltage CharacteristicsIn our circuit model, characteristics of the pixel are very important. However, the AMLCD has a lot of switching devices such as thin-film transistors, making it impossible to directly measure characteristics of the pixel. To solve this problem, we proposed the use of natural transient responses.9,10 Figure 3 shows the method to determine data from rising transitions. It is assumed that the initial capacitance of a pixel and the initial voltage across the pixel are and , respectively (point in Fig. 3). At the beginning of the first frame, the target voltage level is applied to the pixel through the switching transistor for a short time interval (point in Fig. 3). Thus, the total charge across the pixel becomes . After the switch is turned off, the LC molecules undergo reorientation during the rest of the frame time due to the updated electric field. The capacitance of the pixel changes in accordance with the reorientation of the LC molecules. After the transistor is turned off, there is no current path at the pixel. Thus, the accumulated charge has to be maintained () during the rest of the frame time. The increased capacitance due to the reorientation of the LC molecules causes the voltage across the pixel to decrease, such that . At the end of the first frame, the final capacitance and voltage become and , respectively (point in Fig. 3). Thus, , , , where is the capacitance of the target level. Therefore, the capacitance of the LC at the end of the first frame can be calculated by using Eq. (6): Fig. 3Schematic diagram showing the method to determine capacitance-voltage () data from rising transitions. 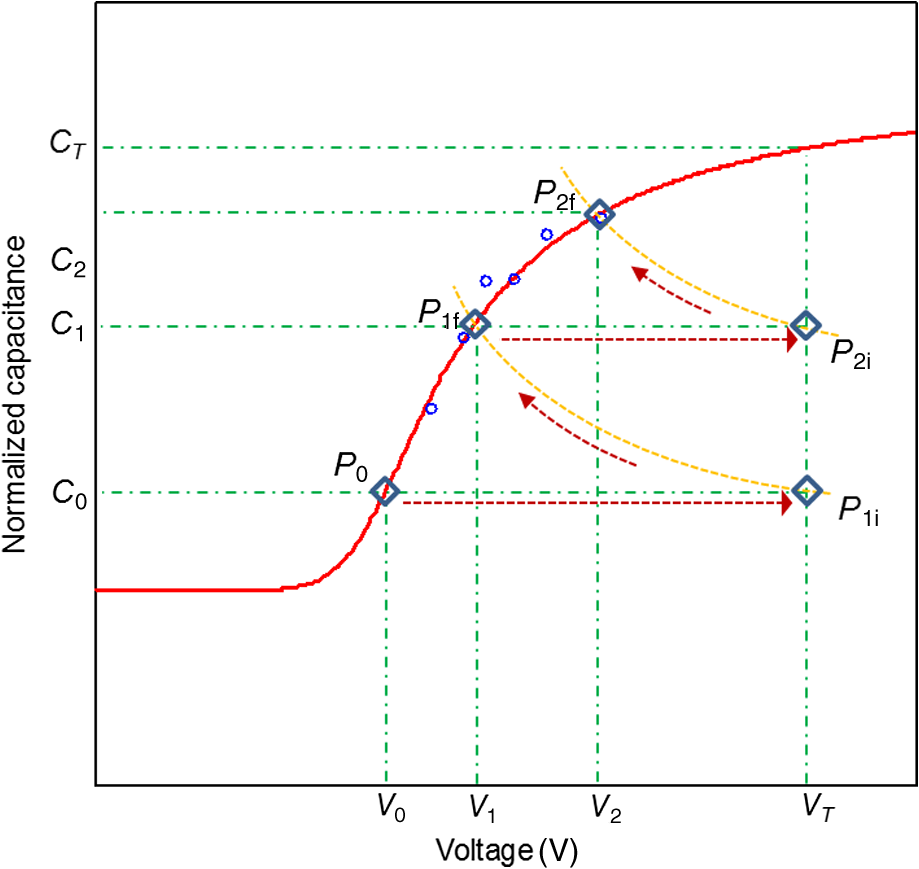 At the beginning of the second frame, is applied again as shown in Fig. 3, which results in a charge of across the pixel. The updated charge has to be conserved (point in Fig. 3). Thus, the LC molecules reach the point (, ) in the space at the end of the second frame, such that . The data at the end of the second frame can be extracted by using Eq. (7): Using the above-described method, at least two data can be obtained from one natural response. Additional data can be obtained using other rising transitions with different target levels. Open circles in Fig. 3 represent some extracted data from natural rising responses at 30°C. We measured rising transitions with different target levels for various ambient temperatures and used these to calculate the temperature-dependent data. Figure 4 shows the calculated characteristics for different ambient temperatures by using Eqs. (6) and (7). It can also be seen from Fig. 4 that the ratio of maximum capacitance and minimum capacitance becomes lower as the temperature increases. 3.2.Transmittance–Voltage CharacteristicsAccurate knowledge of the characteristics depending on the ambient temperature is necessary for estimating the dynamic optical behavior. In addition, the characteristics should be expressed by a formula in order to obtain the transmittance corresponding to any given . The characteristics of the LC cell can be expressed as a function of , given by In Eq. (8), , , , and are the minimum transmittance, the optical modulation voltage, the threshold voltage, and the smoothing constant, respectively.Figure 5 shows the characteristics for different ambient temperatures. Symbols and lines in Fig. 5 represent the measured and the estimated characteristics, respectively. It is seen that the characteristics are negatively shifted when the ambient temperature increases. Further, the estimated curves are a perfect fit to the measured data over the entire voltage range regardless of the ambient temperature. 4.Experimental Results and DiscussionFigure 6 shows the simulation and measurement results of rising transitions starting from gray level 0 in the FFS panel for different ambient temperatures. Symbols and lines represent the measurement and simulation results, respectively. The simulation and measurement results fit very well with each other regardless of the ambient temperature. Figure 7 shows the relationship between the time-constant parameters and , and the ambient temperature. As shown in Fig. 7, it is found that the time-constant parameters, and , are linearly proportional to temperature. The temperature dependency of the time-constant parameters is approximated by using linear approximations. These approximations are expressed as follows: Fig. 6Transient optical responses starting from gray level 0 at (a) 0°C, (b) 10°C, (c) 20°C, (d) 30°C, (e) 40°C, and (f) 50°C. Symbols represent the measured data and lines represent the simulation data.  In Eq. (9), (, ), (, ), and represent slopes, -intercepts, and the ambient temperature, respectively. In FFS panel, the parameters , , , and take the values of , , , and , respectively. As shown in Fig. 7, values of the linear approximations were 0.986 and 0.997, respectively. This means that the temperature-dependent optical movement of FFS LCs can be easily estimated by simple linear approximations. Figure 8 shows simulation results of the FFS panel using the linearly estimated time-constant parameters given by Eq. (9). The simulation and measurement results fit very well with each other regardless of ambient temperature. Fig. 8Simulation results of rising transitions by linear approximations at (a) 0°C, (b) 10°C, (c) 20°C, (d) 30°C, (e) 40°C, and (f) 50°C. Symbols represent the measured data and lines represent the simulation data. 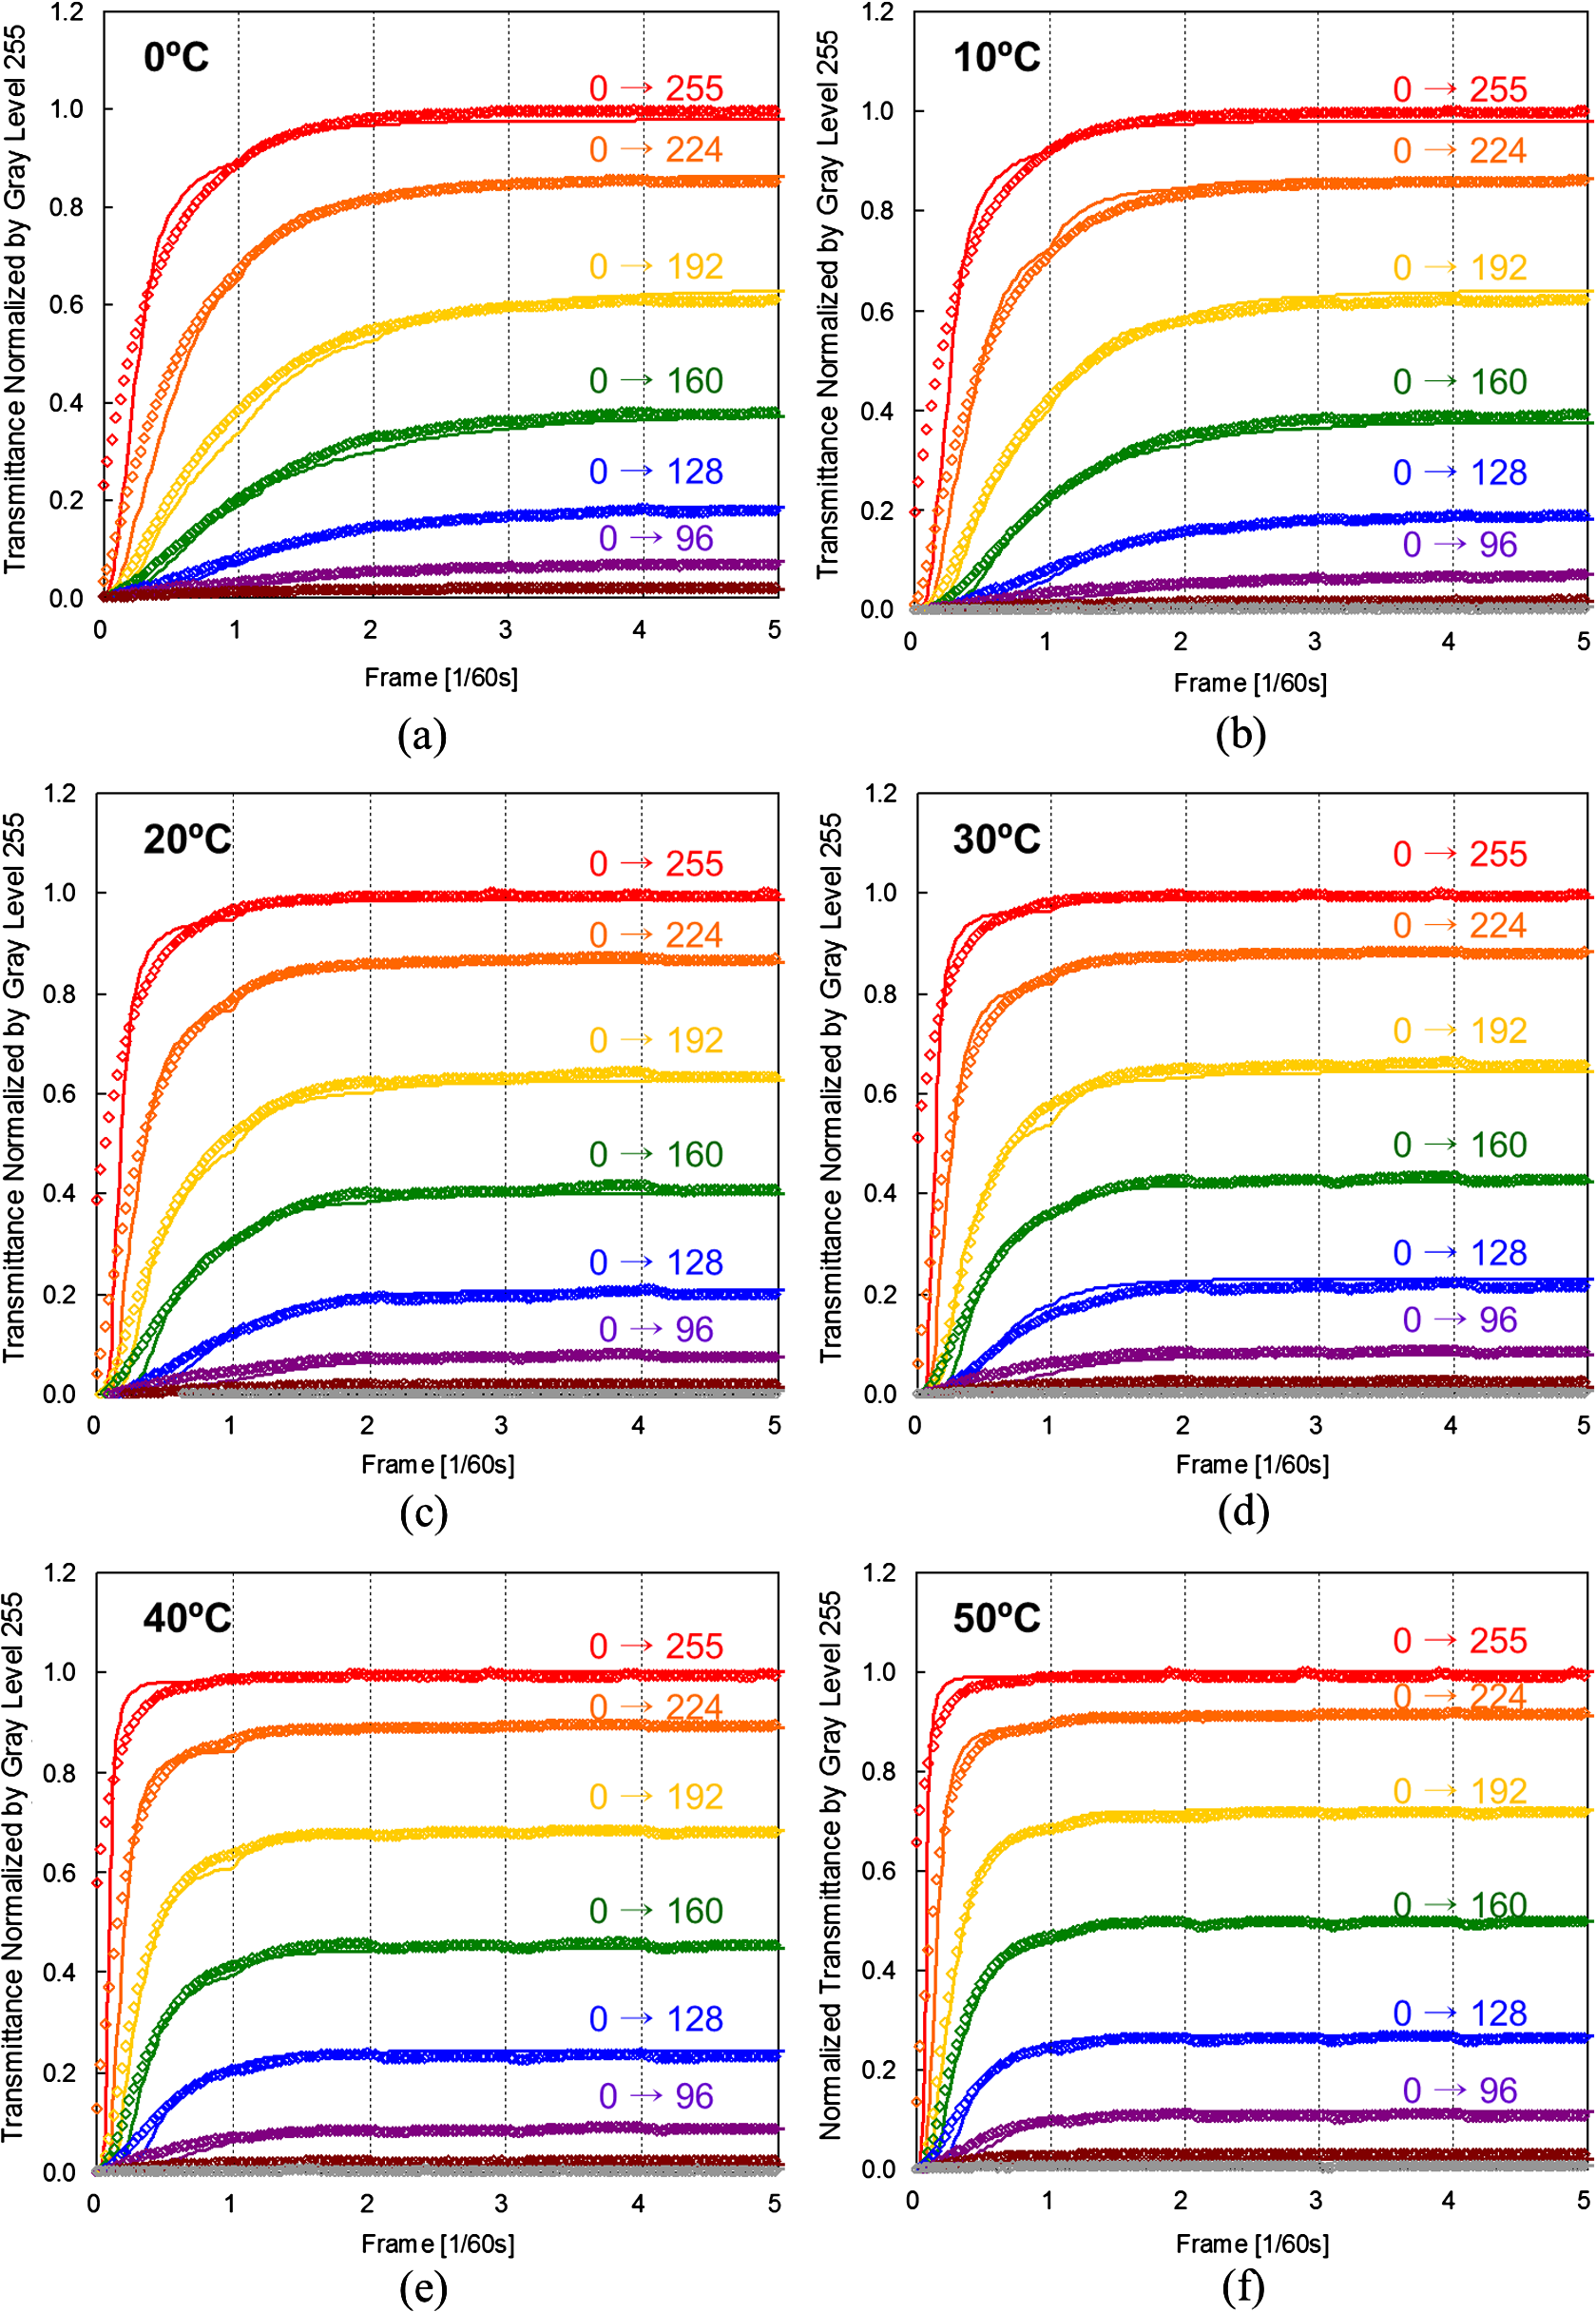 The work described here deals with the behavioral model to predict optical responses according to the ambient temperature. The results show that our model can accurately predict the optical responses of FFS AMLCD panel regardless of the ambient temperature. It is found that the time-constant parameters ( and that describe the movement of LC molecules have a linear relationship with the ambient temperature. The response characteristics of FFS panel can be estimated using the four parameters given by Eq. (9). If response characteristics of FFS panels can be accurately predicted, panel manufacturers can provide customers with expected response characteristics of FFS panels before mass production so that the customers can take the temperature dependency into account while designing the display product. In addition, the findings of this study can be applied to overdrive technologies for improving responses of LCD panels. It is reported that the overdrive values are highly dependent on the temperature.15,16 Accurate prediction of responses enables engineers to obtain overdrive values for all transitions. We have been able to accurately predict the responses regardless of temperature. Therefore, we can easily obtain very accurate overdrive values depending on temperature without any time-consuming work of extracting overdrive values at several temperatures. The research results presented in this paper will make a significant contribution to the manufacturing and designing of LCD panels and products, as designers will be able to predict optical performance very accurately regardless of temperature. 5.ConclusionWe have proposed a behavioral model of AMLCDs for precise prediction of optical responses by using a first-order circuit system. The time-constant parameters that describe the movement of the LCs have a linear relationship to the ambient temperature. The simulation results of transient optical responses with linearly estimated time-constant parameters show an excellent match with the measured results regardless of the ambient temperature. This research will contribute significantly to designing LCD products because designers will be able to predict optical performance accurately regardless of the temperature. In addition, the research results can be applied to overdrive technologies for improving responses of LCD panels. Accurate prediction of responses enables engineers to obtain overdrive values for all transitions regardless of temperature. ReferencesS.-W. Lee,
“Intelligent liquid crystal display (i-LCD) for next generation television application,”
IEEE Trans. Consum. Electron., 53
(4), 1247
–1253
(2007). http://dx.doi.org/10.1109/TCE.2007.4429208 ITCEDA 0098-3063 Google Scholar
H. Lim et al.,
“Simultaneous intermediate-view interpolation and multiplexing algorithm for a fast lenticular display,”
Opt. Eng., 46
(11), 114003
(2007). http://dx.doi.org/10.1117/1.2802511 Google Scholar
J. Kirsch and B. Jones,
“Real-time, full-resolution liquid crystal based stereoscopic display,”
Opt. Eng., 47
(4), 044001
(2008). http://dx.doi.org/10.1117/1.2911722 Google Scholar
S.-W. Lee,
“Common voltage control technology for high reliable active matrix liquid crystal displays,”
Opt. Eng., 47
(2), 024001
(2008). http://dx.doi.org/10.1117/1.2824378 Google Scholar
J.-M. Kim et al.,
“Liquid crystal displays with temperature-independent characteristics,”
Opt. Eng., 51
(7), 077402
(2012). http://dx.doi.org/10.1117/1.OE.51.7.077402 Google Scholar
J.-M. Kim et al.,
“A liquid crystal display with consistent moving image quality regardless of viewing angles,”
Opt. Laser Technol., 60 34
–40
(2014). http://dx.doi.org/10.1016/j.optlastec.2014.01.004 OLTCAS 0030-3992 Google Scholar
H. De Smet, J. Van Den Steen and D. Cuypers,
“Electrical model of a liquid crystal pixel with dynamic, voltage history-dependent capacitance value,”
Liq. Cryst., 31
(5), 705
–711
(2004). http://dx.doi.org/10.1080/02678290410001675129 LICRE6 0267-8292 Google Scholar
M. R. Costa, R. A. C. Altafim and A. P. Mammana,
“Electrical modeling of liquid crystal displays-LCDs,”
IEEE Trans. Dielectr. Electr. Insul., 13
(1), 204
–210
(2006). http://dx.doi.org/10.1109/TDEI.2006.1593418 Google Scholar
Y. Cho et al.,
“A behavioral circuit model of active-matrix liquid crystal displays for optical response simulation,”
IEEE Trans. Electr. Dev., 59
(5), 1430
–1438
(2012). http://dx.doi.org/10.1109/TED.2012.2188632 IETDAI 0018-9383 Google Scholar
J.-M. Kim et al.,
“Behavioral circuit model of active-matrix liquid crystal display with charge-shared pixel structure,”
IEEE Trans. Electr. Dev., 60
(5), 1673
–1680
(2013). http://dx.doi.org/10.1109/TED.2013.2253323 IETDAI 0018-9383 Google Scholar
J.-M. Kim et al.,
“Precise prediction of optical responses of all types of liquid crystal displays by behavioral models,”
J. Soc. Inf. Disp., 21
(1), 2
–8
(2013). http://dx.doi.org/10.1002/jsid.143 JSIDE8 0734-1768 Google Scholar
J.-M. Kim, S.-H. Lee and S.-W. Lee,
“Behavioral model of patterned vertical alignment pixel in active-matrix liquid crystal displays,”
IEEE Trans. Electr. Dev., 61
(11), 3783
–3789
(2014). http://dx.doi.org/10.1109/TED.2014.2356199 IETDAI 0018-9383 Google Scholar
J.-M. Kim and S.-W. Lee,
“Temperature-dependent behavioral model of twisted nematic pixel in active-matrix liquid crystal displays,”
in Society for Information Display Symp. Digest of Technical Papers,
1536
–1539
(2015). Google Scholar
M. Watanabe et al.,
“Macro-modeling of liquid crystal cell with VerilogA,”
in Proc. IEEE Int. Behavioral Modeling and Simulation Workshop,
132
–137
(2007). Google Scholar
K.-C. Lee et al.,
“Thermally adaptive response-time compensation for LCDs,”
J. Soc. Inf. Disp., 16
(3), 421
–428
(2008). http://dx.doi.org/10.1889/1.2896319 JSIDE8 0734-1768 Google Scholar
M. Kim et al.,
“Overdrive technology compensating for ambient temperature,”
Opt. Eng., 54
(2), 023107
(2015). http://dx.doi.org/10.1117/1.OE.54.2.023107 Google Scholar
BiographyJong-Man Kim received his BS and MS degrees in physics and information display at Kyung Hee University, Republic of Korea, in 2010 and 2012, respectively. He is currently working toward his PhD in the Department of Information Display at Kyung Hee University. His research interests include driving methods and circuits for LCD and e-paper displays and driving technology for color motion performance of LCDs. Seung-Woo Lee received his MS and PhD degrees from KAIST in electrical engineering in 1995 and 2000, respectively. He joined Samsung in 2000, where his work has focused on the development of key driving technologies for active-matrix liquid-crystal displays. He is currently an associate professor in the Department of Information Display at Kyung Hee University. He has been active with SID as a senior member. He became an IEEE senior member in 2010. |