|
|
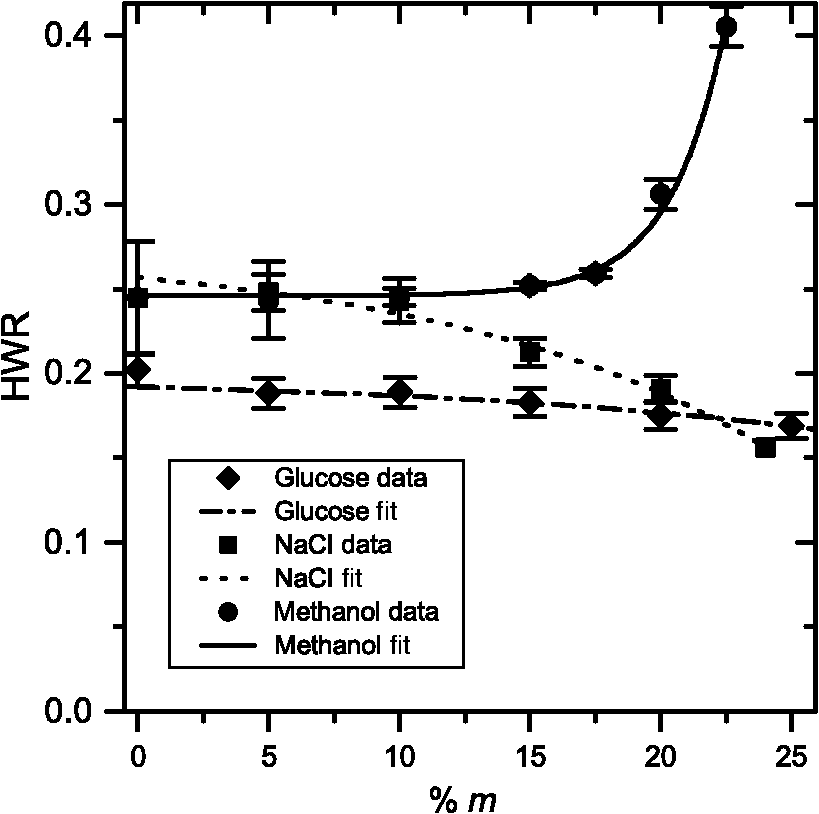
1.IntroductionGlass has been the standard for high-quality optics due to its hard surface, making it polishable and scratch resistant. It also has a larger range of refractive indices compared with polymers (i.e., 1.5 to 1.9 compared with 1.5 to 1.7), meaning lenses can be thinner, and it can be melted together to create gradient index optics. Despite these advantages, polymer optics are an attractive substitute for glass materials because the starting materials are less expensive, less dense, and more break resistant. Advances in polymer materials have focused on increasing the index of refraction and improving the tooling for fabrication.1,2 Additionally, there has been ample research around using polymers to fabricate microlens arrays.3–8 Taking advantage of the initial liquid state of many polymeric materials, polymer lenses are fabricated using a variety of methods. For example, manufacturers inject the liquid polymer into flexible molds.9,10 However, techniques that employ molds necessarily limit the surface quality of the optic due to the interaction between the polymer and the mold surface. Other methods use surface tension to create a lens shape, either by dropping the polymer onto flat surfaces or injecting the polymer between two liquids of different densities.7,11 These techniques are preferable since the surface quality is not affected by the roughness of solid surfaces. However, these have only been introduced on the microscale. In this paper, we focus on manipulating the shape of macroscopic (0.5 to 2.5 cm) polymer lenses made using a system of two interfaces: one between a substrate and a liquid resin and the other between the resin and air. This is a similar concept to that used by Sun et al.12 to produce microlenslets. The air-liquid-resin system allows us to take advantage of the surface tension of the substrate and wetting (i.e., spreading) of the resin to develop a controllable lens shape with a range of focal lengths from 5 to 25 mm. Since a small volume of resin spreads across the entire surface while the remainder forms a lens shape, we refer to our system as having pseudopartial wetting.13 This partial wetting adds a manipulatable force due to surface tension along the substrate that acts to flatten the lens. In this paper, we present the effects on lens geometry due to varying the container width and manipulating the temperature and intermolecular spacing of the substrate liquids on which the lenses are formed. 2.Lens Fabrication, Analysis, and RepeatabilityTo fabricate the lenses, we used a micropipette to deposit a constant volume (0.2 ml) of a thiolene/methacrylate photopolymerizable resin on hydrophilic substrate in a container of known diameter. The photopolymerizable resin formulation is described in Baylor et al.14 and is hydrophobic. The interfacial surface tension between the hydrophobic resin, hydrophilic substrate, and air results in a lens-shaped object [Figs. 1(a) and 1(b)]. Upon exposure to UV light (Bacchus & Associates LS-100-2) with intensity at 365 nm for 200 s, the resin solidifies and maintains its shape on the substrate boundary [Figs. 1(c) and 1(d)]. Due to oxygen inhibition and partial wetting, there is a thin film of liquid resin across the surface of the substrate and the air–lens interface after polymerization. This film is removed from the lens by applying a small amount of acetone to the flat side and wiping clean. It is similarly removed from the container using acetone and methanol. Fig. 1Diagram of the lens formation process: (a) a single container is shown with the substrate only; (b) the substrate and liquid resin; (c) the substrate and resin during exposure; and (d) the resulting solid lens. 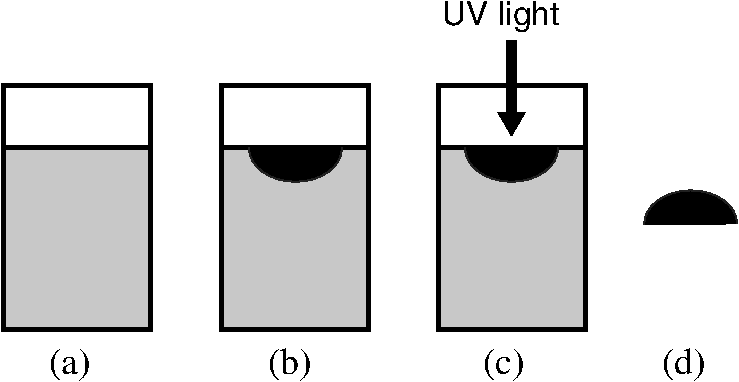 To preserve experimental conditions and increase fabrication efficiency, we constructed an array of wells using a polyethylene disk. The disk was placed in a larger container such that each well functions as an isolated experiment under the same test conditions, and many iterations can be performed at once (Fig. 2). We smoothed the interior well surfaces to minimize irregularities and measured the diameter to a precision of 0.001 in. To measure the lens profile, we used an optical projection system and analyzed the photographs of the lens cross-section to extract a lens profile [Figs. 3 and 4(a)–4(c)]. Then we fit the profile to a Gaussian or a parabola and used the fit to determine the height-to-width ratio (HWR), as shown in Fig. 4(d). The uncertainty for the data was found using the standard deviation of the fitted profiles. Finally, we found the focal lengths of the lenses using the fit parameters for each lens. For all the lenses, we found the radius of curvature at the center of the lens to approximate the focal length. Fig. 2An illustration of the disk-well system. Each well acts as a single container, yet all have the same substrate since they are all in a larger container. Thus, we are able to achieve multiple trials at once. 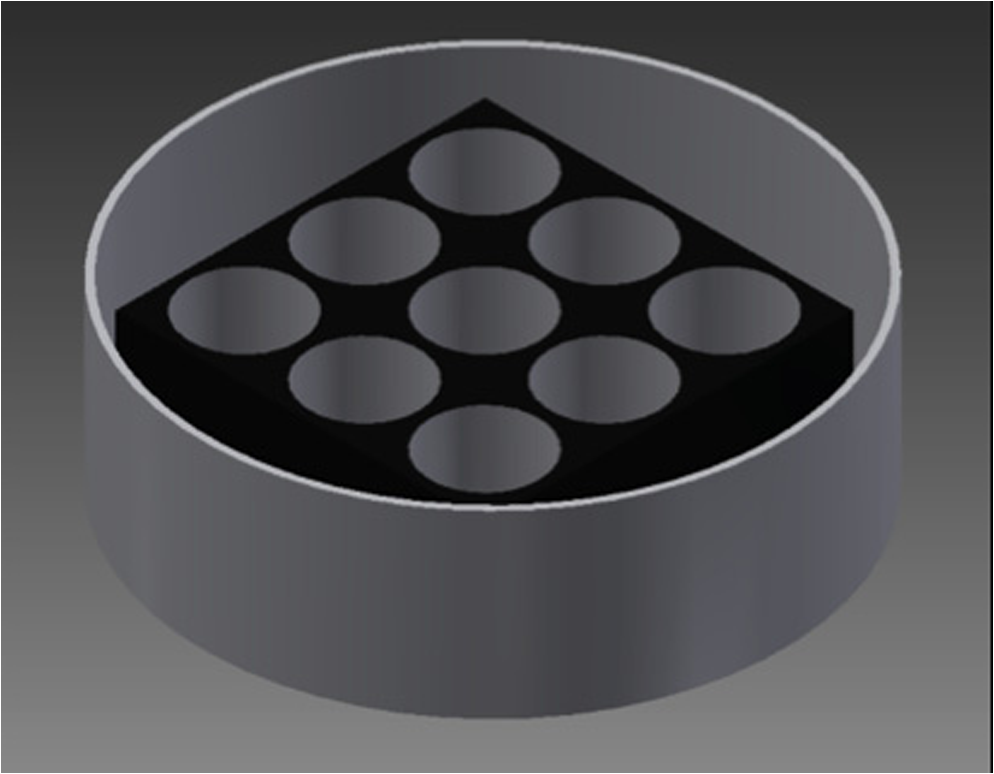 Fig. 3A schematic diagram of the imaging setup. A 635-nm laser diode (A) is spatially filtered (B) with a objective and pinhole. An iris (C) is used to block stray light, and the beam is collimated using a 2-in.-diameter lens (D). One or more neutral density filters (E) are used to prevent saturation of the detector. The lens is placed on a pedestal (F). A shadow of the lens cast on the ground glass screen (G) is captured by the camera, an Olympus Stylus 1010 (H). 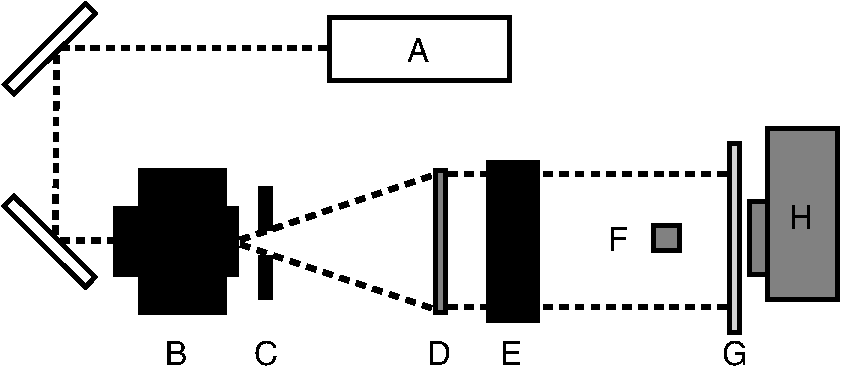 Fig. 4An illustration of the lens profiling process: (a) A lens before imaging; (b) the shadow projection captured by the camera. The pedestal shown was used to calibrate the image, (c) the trace of the lens profile compared with the image, and (d) the final profile and its mathematical fit. Note that the final profile and mathematical fit appear pixelated due to our imaging software; however, the original lens is quite smooth as shown in (a). 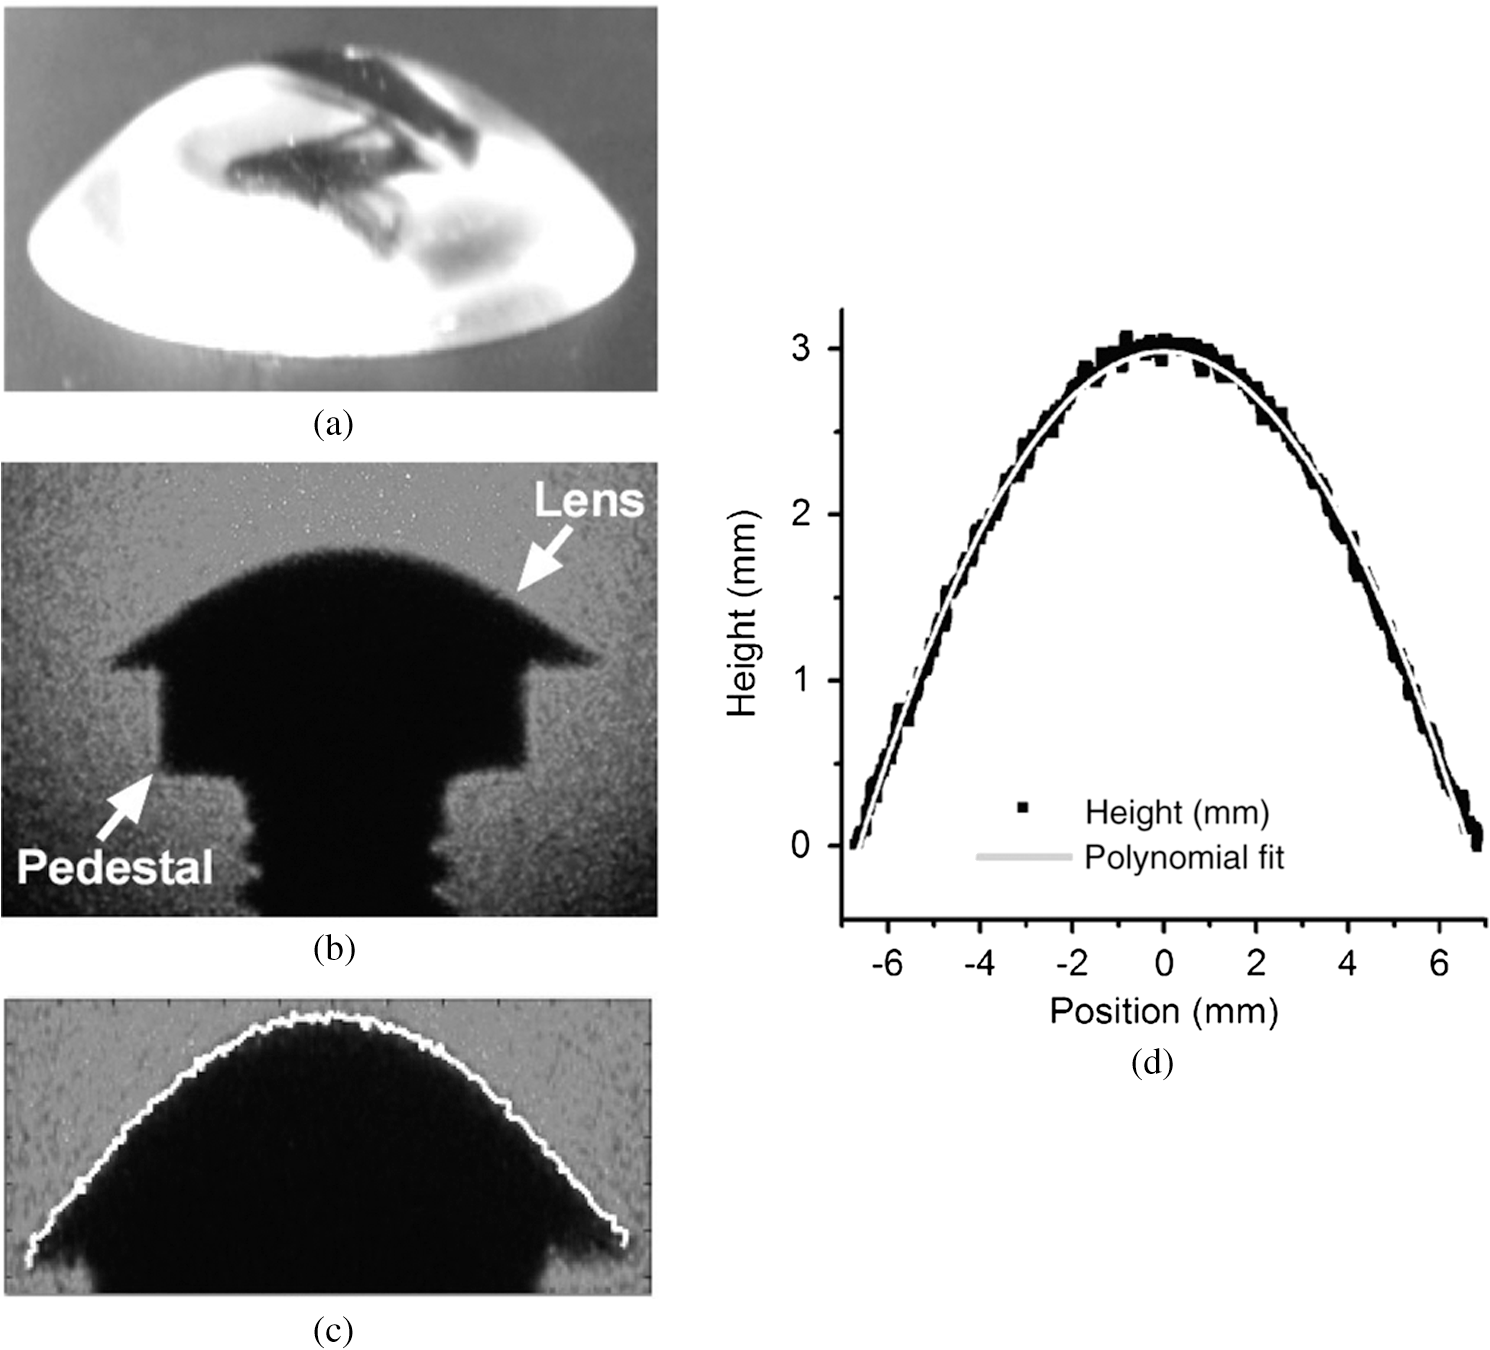 To determine whether it would be necessary to control for temperature, we fabricated lenses on deionized water at temperatures from 2°C to 80°C. The lenses were fit to Gaussian functions, and the data in Fig. 5 show that the temperature does not affect the HWR. We expect surface tension and density of deionized water to decrease with temperature.15 We also expect that since we are using a small volume of resin compared with the volume of substrate, the resin will quickly equilibrate to the temperature of the substrate. In order to maintain a constant trend with temperature, these data suggest that the density of the resin must decrease with temperature at the same rate. Since all experiments were performed at room temperature with less than 2°C variation, we do not expect temperature to affect our results. Therefore, we did not control for temperature throughout these experiments. Fig. 5Height-to-width ratio (HWR) versus temperature. The dashed line represents an average HWR across all data points shown. There is very little deviation from , meaning little deviation from the average, suggesting temperature has no effect on lens geometry. 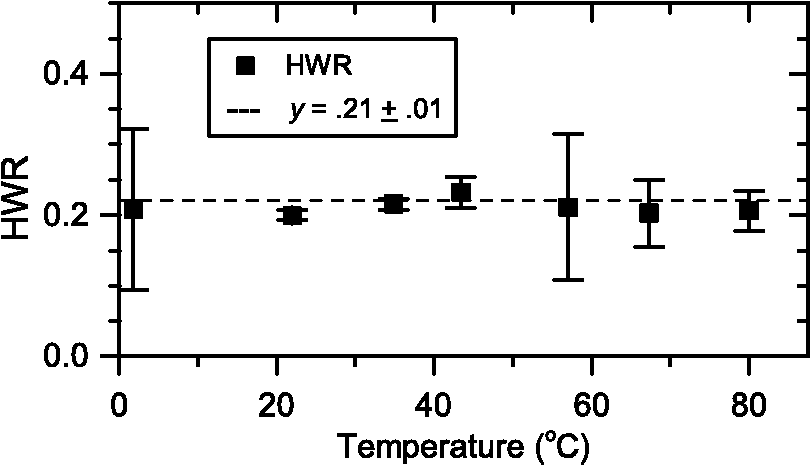 Finally, we did notice a shift in our data taken by different researchers. While trends remained stable, the HWR values for a particular dataset were shifted in a systematic way for different researchers. We believe that this shift is due to each individuals’ particular style of dropping the resin from the micropipette. Therefore, all our individual datasets are completed by one researcher. We recommend that for future experiments, a reproducible dropping method be developed. 3.Varying the Experimental ConditionsWith the basic lens shape established, we are interested in how to “tune” the geometry by changing the surface effects that determine the shape of the resin on the substrate liquid. There are two attributes we vary to control lens shape: the degree to which the resin spreads and the surface tension of the substrate. We manipulate these characteristics by adjusting the width of the container and the composition of the substrate, respectively, and show that the HWR changes predictably. 3.1.SpreadingThe pseudopartial wetting condition of our resin-substrate-air system means that there is systematic spreading of the resin across the surface of the substrate. To demonstrate that this spreading plays a significant role in lens formation and determine the extent to which it does so, we vary the well diameter and fit the resulting lenses to Gaussian functions. Figure 6(a) shows an exponential relationship between the well diameter and HWR of the lenses. The lenses made with the smallest beaker width are quite difficult to realize, as the well size approaches the lower limit of the lens width at volume 0.2 ml, leading to larger error bars for small beaker widths. To better understand this trend, we plotted the lens width against well diameter squared [Fig. 6(b)]. The well diameter squared values are used because they are proportional to the surface area of the well. Thus, we are able to see that the lens spreads linearly with increasing surface area of the substrate. The data points shown are averages of multiple trials, and we propagated error using the standard deviation of the height and width values from the fit to the lens profile. Fig. 6(a) HWR versus container width. The HWR decreases exponentially as the width is increased. The fit is given by , where is the beaker width, , in., and . (b) Lens width versus beaker width squared. Notice the linear trend suggests that the lens width is primarily affected by spreading of the resin across the substrate surface. 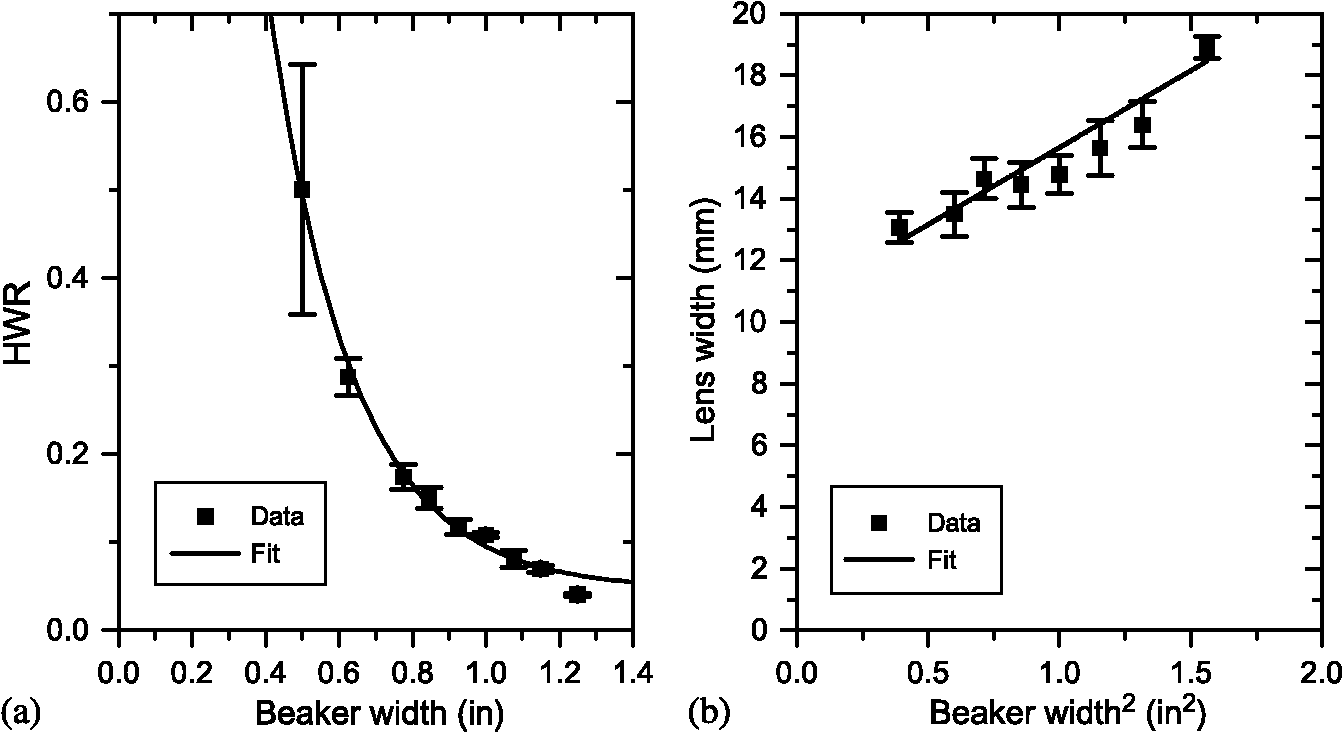 To explore whether the interaction of the thin film with the well affects the HWR of the lens, we applied surface treatments that changed whether or not the resin could interact with the walls of a glass beaker. We used two surface treatments on glass beakers: Rain-X®, which is used to prevent water and polymer from sticking to glass, and silane (Gelest SIM6487.3, methacryloxypropyltriethoxysilane), which is used to adhere polymer to glass. The results of the Rain-X® test can be seen in Fig. 7 and show that the shape of the meniscus formed by the water at the beaker surface is very important to lens formation. Since the water surface was curved down to minimize interaction with the beaker surface, the resin drops were in unstable equilibrium and slid to the sides, forming a ring rather than a lens. The silane-coated beaker resulted in lenses with no significant difference in HWR from lenses made in uncoated beakers of the same width. This suggests that the resin may be interacting with the sides of the wells; however, currently this cannot be separated from natural spreading of the resin. Fig. 7The effects of a hydrophobic surface treatment on lens formation: (a) container coated with Rain-X® and filled with substrate (light gray); (b) the motion of the resin (indicated by dark gray) as it is dropped onto the curved surface; (c) the resin during the curing process; and (d) the resulting ring. 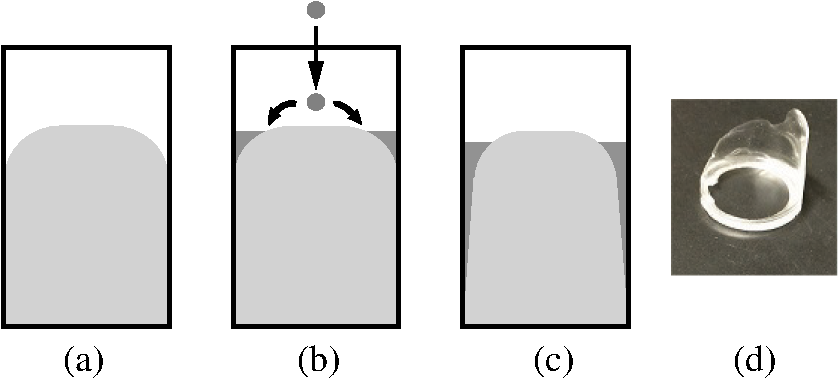 3.2.Substrate CompositionThe substrate composition was also varied to observe the effect on the lens geometry. By adding different solutes to deionized water, we vary the surface tension () of the substrate. As increases, the lens flattens as increased reduces the deformation of the substrate by weight. We used three different solutes to study this behavior: glucose (, Sigma Aldrich G-5400), sodium chloride (NaCl, VWR International VW6430-7), and methanol (, Fisher Scientific A452SK-4). We chose these three solutes as they represent a spectrum of behavior. The glucose minimally increases the surface tension at high concentrations by decreasing intermolecular spacing. The NaCl ionizes in water, causing a tighter distribution of ions along the surface, similarly lowering intermolecular spacing and increasing , but to a much higher degree. The methanol, in contrast, increases intermolecular spacing, decreases , and has the most change in the magnitude of over the concentrations of interest.15,16 These trends are summarized with corresponding values in Table 1. Table 1The change in surface tension (σ) due to a change in percent mass (%m) for glucose, NaCl, and methanol.15,16 Note that σ does not change linearly when looking at a large range of values of %m. Thus, the calculated slope is a first-order approximation to give an indication of the extent of change in σ over the %m of interest.
We created substrate solutions with differing concentrations, which we will discuss as percent mass of solute (), and used them to make lenses. The NaCl and methanol lens profiles were fit to a Gaussian, while the glucose lens profiles were better fit to a parabola. The HWR of the resulting lenses was calculated from the fitted profiles. Figure 8 shows the HWR versus for the three solutes. All three datasets are fit to the same exponential function with the fit parameters shown in Table 2. Table 2The parameter values for Fig. 8, where %m represents the percent mass of the solute.
The fit parameters provide physical insight into how affects the HWR with increased concentration. The fit parameter corresponds to the HWR at zero concentration. Notice that the glucose data show a systematic trend but are shifted due to the fact that one person collected the glucose data and a different person collected the NaCl and methanol data. Although the fit is not sensitive to the value of since its value is on the order of the error, the sign seems to describe whether the solute increases () or decreases () intermolecular spacing with increasing . likely represents the strength of the effect of intermolecular spacing with increased . Notice that the magnitude of , which will be denoted as for compactness, correlates to the inverse of the magnitude of . For example, methanol has the highest value at 0.80 (Table 1), but the lowest magnitude in at 2.1 (Table 2). 4.ConclusionUsing the container width and substrate composition of the fabrication system, we changed the lens HWR. We found that by varying these conditions, the lens HWR followed systematic trends related to specific means of changing the surface tension. To further develop this technique for fabricating macroscopic lenses, we recommend working with a polymer of higher optical quality such as polymethyl methacrylate or another photocurable, high-quality optical adhesive in order to study the optical properties of the lenses. Moreover, additional work is required to connect the measured physical properties of the resin and substrate to a predictive quantitative model in order to design a lens to a desired specification. This method provides a new way to fabricate macroscopic polymer lenses while leaving a smooth surface unimpaired by molds, and its further study will add to our ability to fabricate high-quality, macroscopic polymer lenses. AcknowledgmentsWe would like to thank Mark Zach for use of the machine shop and for helpful conversations; and Brian Mars, Lanhao Yang, Steven Drew, and Gretchen Hofmeister in the Carleton College Chemistry Department and Shawn Galdeen in the Carleton College Biology Department for the use of their materials and for helpful conversations. We would also like to thank Ben Cerjan for his help initiating this project. Charlotte Zimmerman would like to thank the Carleton College Clare Boothe Luce Research Scholar program for funding this research. Mason White would like to thank Carleton College’s Howard Hughes Medical Institute grant for summer research support. ReferencesJ.-G. Liu and M. Ueda,
“High refractive index polymers: fundamental research and practical applications,”
J. Mater. Chem., 19 8907
–8919
(2009). http://dx.doi.org/10.1039/b909690f Google Scholar
P. Tolley,
“Polymer optics gain respect—new materials, improved tooling and innovative design bring plastic optics to the forefront of defense, biometrics applications and more,”
Photonics Spectra, 37
(10), 76
–79
(2003). PHSAD3 0731-1230 Google Scholar
Z. Xuefeng and J. Hongrui,
“Polydimethylsiloxane microlens arrays fabricated through liquid-phase photopolymerization and molding,”
J. Microelectromech. Syst., 17 1210
–1217
(2008). http://dx.doi.org/10.1109/JMEMS.2008.926139 Google Scholar
H. Oh et al.,
“Fabrication of micro-lens array using quartz wet etching and polymer,”
Sens. Actuators, A, 164 161
–167
(2010). http://dx.doi.org/10.1016/j.sna.2010.10.003 Google Scholar
E. McLeod and S. M. Troian,
“One step non-contact fabrication of polymer microlens arrays by thermocapillary lithography,”
in 2011 Conf. on Lasers and Electro-Optics (CLEO),
1
–2
(2011). Google Scholar
L. Kyounggun et al.,
“Fabrication of polydimethylsiloxane microlens arrays by surface tension induced liquid separation,”
Micro Nano Lett. IET, 6 809
–811
(2011). http://dx.doi.org/10.1049/mnl.2011.0377 Google Scholar
D. Xie et al.,
“Fabrication of polymer micro-lens array with pneumatically diaphragm-driven drop-on-demand inkjet technology,”
Opt. Express, 20 15186
–15195
(2012). http://dx.doi.org/10.1364/OE.20.015186 OPEXFF 1094-4087 Google Scholar
H. Jiang and X. Zeng, Microlenses: Properties, Fabrication and Liquid Lenses, CRC Press, Boca Ratan, FL
(2013). Google Scholar
S. H. Cho et al.,
“Fabrication of aspherical polymer lenses using a tunable liquid-filled mold,”
Opt. Lett., 34 605
–607
(2009). http://dx.doi.org/10.1364/OL.34.000605 Google Scholar
C. Huang, Investigation of Injection Molding Process for High Precision Polymer Lens Manufacturing, The Ohio State University(2008). Google Scholar
S. Nakazawa, H. Hidai and H. Tokura,
“Photopolymerization of spherical objects using interface tension between liquids,”
Int. J. Jpn. Soc. Precis. Eng., 68 571
–575
(2002). http://dx.doi.org/10.2493/jjspe.68.571 Google Scholar
R. Sun, Y. Li and L. Li,
“Rapid method for fabricating polymeric biconvex parabolic lenslets,”
Opt. Lett., 39 5391
–5394
(2014). http://dx.doi.org/10.1364/OL.39.005391 Google Scholar
J. Sebilleau,
“Equilibrium thickness of large liquid lenses spreading over another liquid surface,”
Langmuir, 29 12118
–12128
(2013). http://dx.doi.org/10.1021/la402509n LANGD5 0743-7463 Google Scholar
M.-E. Baylor et al.,
“Monolithic integration of optical waveguide and fluidic channel structures in a thiol-ene/methacrylate photopolymer,”
Opt. Mater. Express, 2 1548
–1555
(2012). http://dx.doi.org/10.1364/OME.2.001548 Google Scholar
Handbook of Chemistry and Physics, 72 ed.CRC Press, Inc., Boca Raton, FL
(1991–1992). Google Scholar
E. Aumann, L. M. Hildemann and A. Tabazadeh,
“Measuring and modeling the composition and temperature-dependence of surface tension for organic solutions,”
Atmos. Environ., 44 329
–337
(2010). http://dx.doi.org/10.1016/j.atmosenv.2009.10.033 Google Scholar
BiographyCharlotte Zimmerman is currently a high school teacher at the St. Luke’s School, and graduated from the Carleton College in May 2015 with a BA degree in physics. Mason White is an undergraduate at the Carleton College. He will graduate in May 2016 with a BA degree in physics. Martha-Elizabeth Baylor received her BA degree in physics from Kenyon College, Ohio, USA, in 1998. From 1998 to 2000, she was a middle and high school teacher at the Maret School, Washington, DC. She was an optical engineer at the NASA Goddard Space Flight Center from 2000 to 2002. She completed her physics PhD in optical signal processing at the University of Colorado, Boulder, USA, in 2007. She is an assistant professor of physics at the Carleton College, Minnesota, USA, researching photopolymers for optofluidic devices. |
|||||||||||||||||||||||||||||||||||||||||||||||||||