|
|
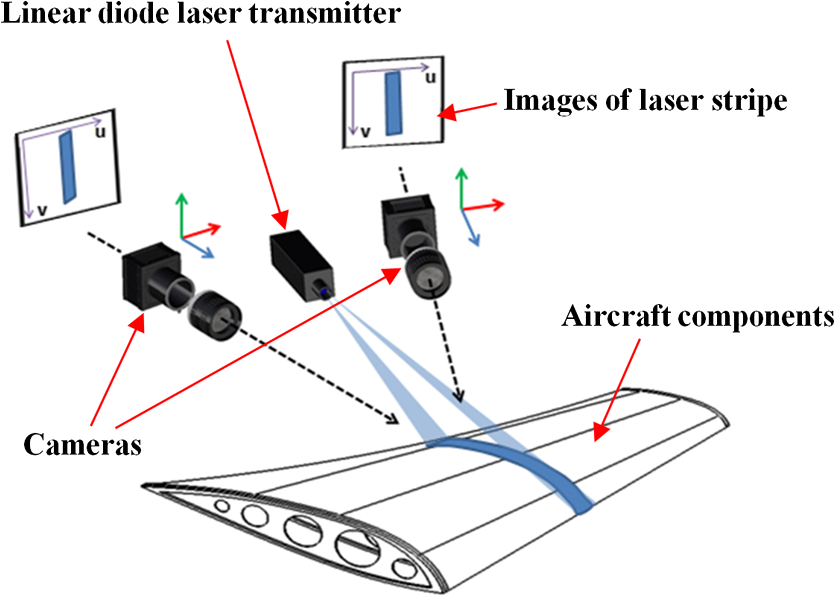
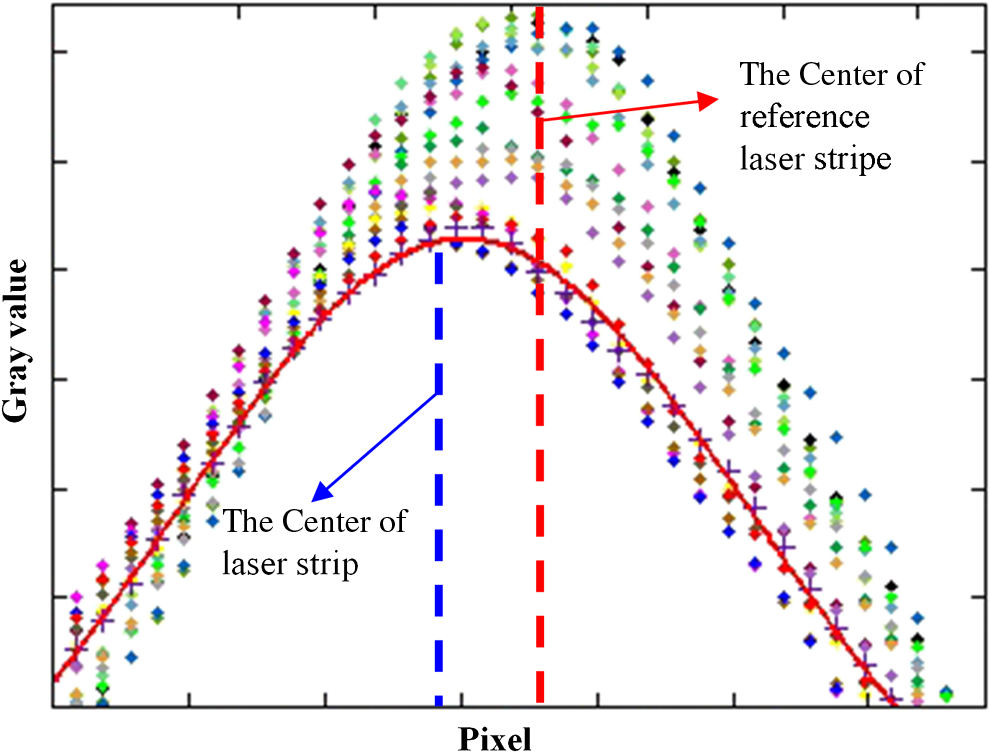
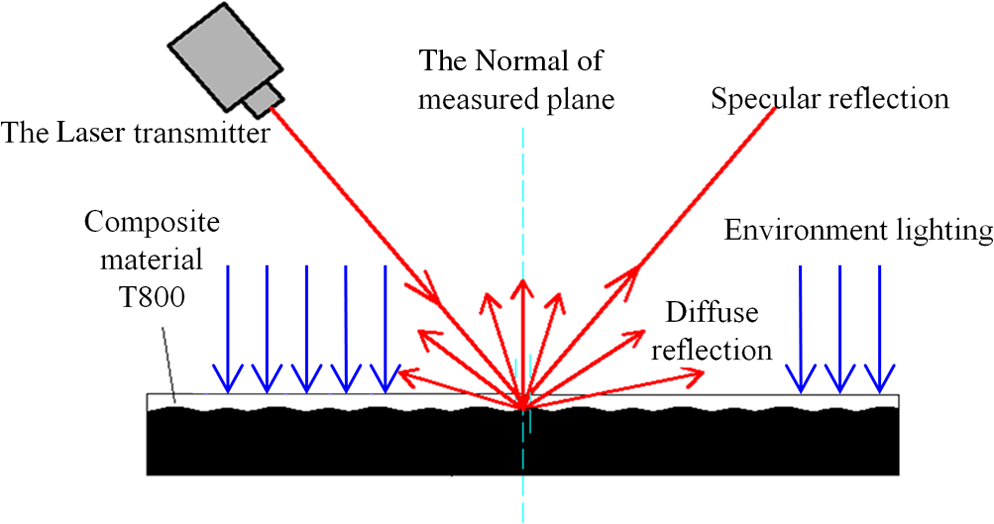
1.IntroductionGeometric accuracies of large-scale aircraft components or parts, including tail and wings, are the essential specifications for determining the airworthiness of the major subassemblies or subsystems of an aircraft.1–3 Geometrical measurements in large-scale aircraft components are fundamental for both aircraft assembly and aircraft reliability testing.4 Nevertheless, the inspection of large-scale aircraft subsystems remains a delicate task because it requires a high measurement range and accuracy.5–7 Machine-vision technologies have become important tools for the three-dimensional measurement of product structures because they can be used for noncontact measurements that can produce results with high efficiency and accuracy.8 Large-scale triangulation scanning measurement systems, which are based on machine-vision technology, are widely used in industry for accurately measuring the three-dimensional profile of large-scale components.9,10 Triangulation scanning measurement systems are characterized by the reconstruction of dynamic laser stripes on scanned large-scale components. The three-dimensional profile is accurately measured by analyzing image sequences of laser stripes recorded by charge-coupled device/complementary metal oxide semiconductor (CMOS) cameras. Because the laser stripe center is a unique feature in the images, the extraction accuracy of the laser stripe center is a decisive factor for measurement accuracy.11–13 However, due to the large size of aircraft components, the laser stripe covers a long scan range. In addition to variations due to multiple lighting effects (illumination, reflectivity of object, light source characteristics, etc.), errors are easily introduced into the center extraction results of large-scale laser stripes. Because conventional center extraction methods cannot be used to extract laser stripes with sufficiently high accuracy for large-scale parts, the development of a highly accurate laser stripe extraction method is essential for measuring large-scale aircraft parts.14 To improve the accuracy of laser stripe extraction, conventional center extraction methods, such as geometric center extraction, barycenter extraction, and Gaussian fitting extraction, are enhanced. Lukas et al. proposed an enhanced Gaussian fitting extraction method.15 In this method, the initial center of the laser stripe was extracted using the conventional extraction method. Then the laser stripe center was extracted using the Gaussian fitting method at the range of 5 pixels around the initial center. Though this method could extract the laser stripe with high accuracy, it was only applied to laser stripes with a uniform gray distribution and width. Jang and Hong proposed a new method for detecting curvilinear structures.16 The edge of the input image was extracted using a Canny edge detector,17 and the distance from each pixel to the nearest edge of the feature is calculated based on a Euclidean distance mapping.18 Thus, the light center could be obtained by removing extraneous points after the extracted curve was refined into a 1-pixel-wide stripe.16 The method proposed by Jang and Hong could be used for comprehensive natural images with good robustness;16 however, it was considered inappropriate for high-accuracy measurement in industry because the measurement accuracy of this method could only reach pixel-level accuracy. Steger first obtained the normal of the laser stripe center using a Hessian matrix. Then the maximum gray value on this normal could be calculated as a subpixel center.19 The resulting method showed high extraction accuracy with high stability; however, because it requires a large number of arithmetic operations, the method is inappropriate for high-speed center extraction. Finally, Wei proposed a robust automatic method that combines erosion, thinning, and the least-median square algorithm to overcome the interference of partial serious reflection for laser stripe center extraction; however, it does not work well for measuring large-scale components.20 In this study, a novel laser stripe extraction method is proposed with high accuracy and efficiency. After analyzing the Gaussian fitting structural similarity and image features of laser stripes, the deviation in the laser stripe extraction can be corrected, thus improving the measurement accuracy of a large-scale triangulation scanning system. Characteristics of a large-scale triangulation scanning measurement system and laser stripe images are described and analyzed in Sec. 2. To determine deviations in the laser stripe extraction, an image evaluation method based on the structural similarity between Gaussian fittings is presented in Sec. 3. In Sec. 4, the relationships between the gray distribution of a laser stripe and the multiple source factors are discussed. Then the center compensation model is established for laser stripes on the surface of composite materials to improve the accuracy of laser stripe extraction. According to the method of laser stripe extraction, specific experimental implementations are performed in Sec. 5. Moreover, the improvement in the accuracy of the large-scale triangulation scanning measurement system is verified by the measurement results of large-scale aircraft components. Some conclusions are discussed in Sec. 6. 2.Characteristics of Measurement System and Laser Stripe Images2.1.Active Triangulation Scanning Measurement SystemThe active triangulation scanning measurement system using laser stripes is composed of two cameras with high speed and resolution, one linear diode laser transmitter with high stability, one automatically controlled platform with high accuracy, and one graphic workstation, as shown in Fig. 1. During the measurement, linear diode laser stripes are projected onto the surface of objects. With the rotation of the automatically controlled platform, the laser stripes are scanned over the object. The image sequences of the laser stripes are captured by binocular cameras. After establishing the three-dimensional system of coordinates through the binocular camera calibration, the profile of a large-scale object can be obtained by extracting the center lines of the laser stripes in the image sequences. Thus, the extraction accuracy of the laser stripe is the decisive factor in improving the accuracy of active triangulation scanning measurements. 2.2.Gray Distribution Features of Laser StripeBecause the image information in the laser stripes is expressed by the intensity pattern (gray distribution), we will demonstrate the gray distribution features of the laser stripe in detail. The luminous theory of the linear diode laser states that a dot laser beam passing through a cylindrical lens generates a continuous optical space. Thereafter, laser stripes with a certain width are formed when the measured object surface intersects with the laser optical space. The fundamental transverse mode of the linear laser, which is an important type of solid laser with high stability, has been widely used in visual measuring systems. According to laser principles, the intensity distribution of the fundamental transverse mode follows a single Gaussian distribution in the space domain (cross-section of laser beam).10 The gray distribution curve of laser stripe is shown in Fig. 2. When the laser stripe is overexposed, the gray distribution of this stripe is a Gaussian curve with a platform (curve ). However, the curve of the nonplatform area still agrees with the Gaussian distribution (curve ). When the laser stripe is projected vertically on the measured object and the observation direction is perpendicular to the irradiated surface, the gray distribution is axisymmetric in the space domain. Moreover, the laser stripe center will coincide with the geometric center of the laser stripe when the laser, camera, and normal vector of the measured surface have the same direction. However, the gray distribution is asymmetric in practical measurement conditions. With changes in the incident angle of the laser transmitter, the laser stripe center deviates from the geometric center, as shown in Fig. 2(b). Thus, this laser stripe center deviation should be considered in the extraction method to further improve the measurement accuracy. Fig. 2Schematic diagram of the active triangulation scanning measurement system showing the gray-scale distribution: (a) laser stripe with the incident angle and (b) reference laser stripe. 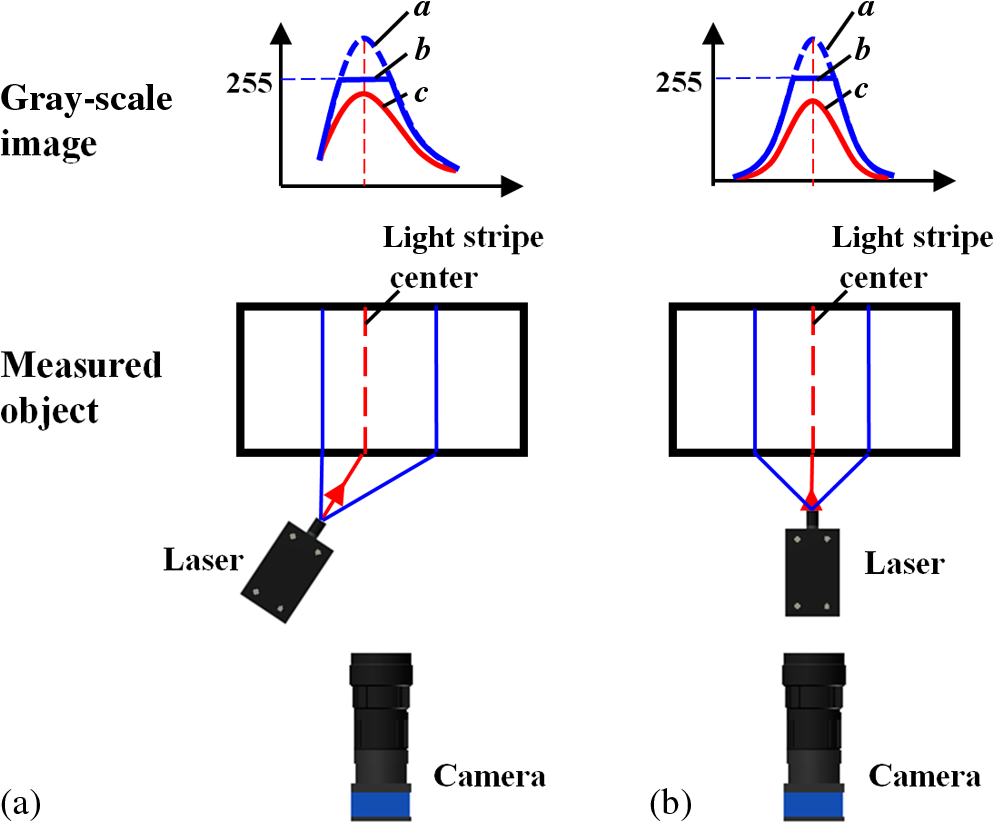 During large-scale component measurements, laser stripes scanned over objects can have a large range of movement. Therefore, a larger incidence angle is produced. Due to the large deviation angle as well as the characteristics of the laser, measured object, and cameras, the center of the laser stripe can significantly deviate from the geometric center. Additionally, the gray distribution is not similar to the standard Gaussian distribution of laser stripes. Therefore, the compensation for the laser stripe deviation must be considered for different incident angles. 3.Evaluation of Laser Stripe ImagesBecause the gray distribution of a laser stripe is asymmetric and a significant deviation in the laser stripe center could occur, we propose an image evaluation method for the laser stripe extraction to determine the degree of deviation between the center of the captured laser stripe and the geometric center. 3.1.Theory of Structural SimilarityThe structural similarity (SSIM) index provides a method for measuring the similarity between the evaluating image and reference image .21 The reference image is a distortion-free image. In particular, the SSIM index includes a comparison of the luminance , contrast , and structure between images and . The SSIM index is given by where , , and are the adaptive scaling index for the luminance comparison, contrast comparison, and structure comparison, respectively. The luminance , contrast , and structure comparison can be expressed as follows: where and are the mean luminance intensities of images and given by and , respectively. Similarly, and are the standard deviations of images and given by and , , respectively. Finally, is the image covariance that represents the structural comparison, and , and are small constants used to prevent a zero denominator. The method for estimation of , , and is found elsewhere.213.2.Gaussian Fitting Structural SimilarityFor a triangulation scanning measurement system, the gray distribution of the laser stripe has a specific Gaussian distribution. To evaluate the degree of laser stripe deviation, we proposed the following image evolution method using the structural similarity of the gray distribution and the Gaussian fitting:
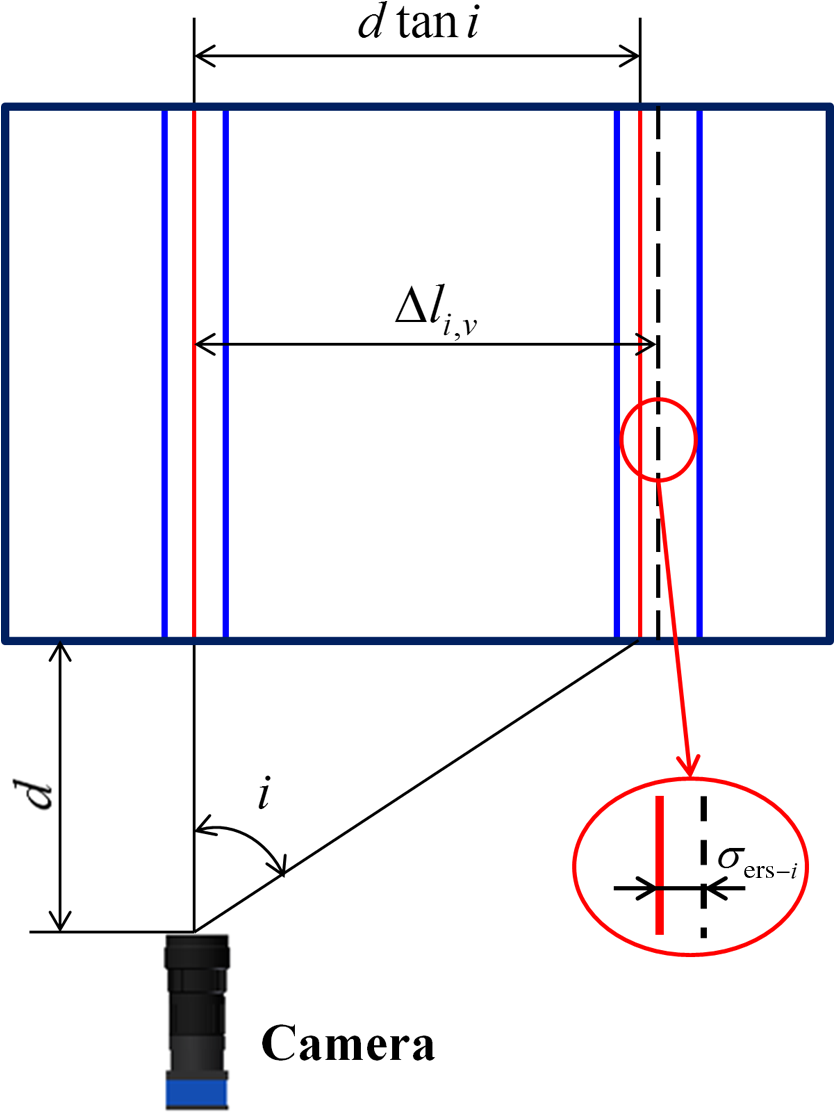
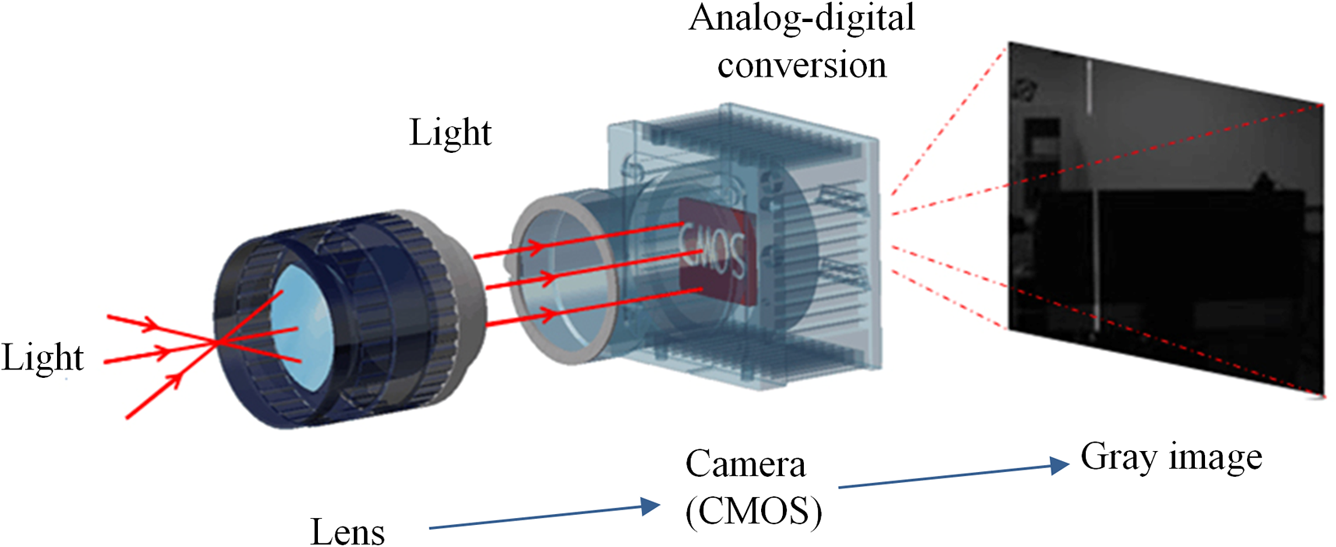
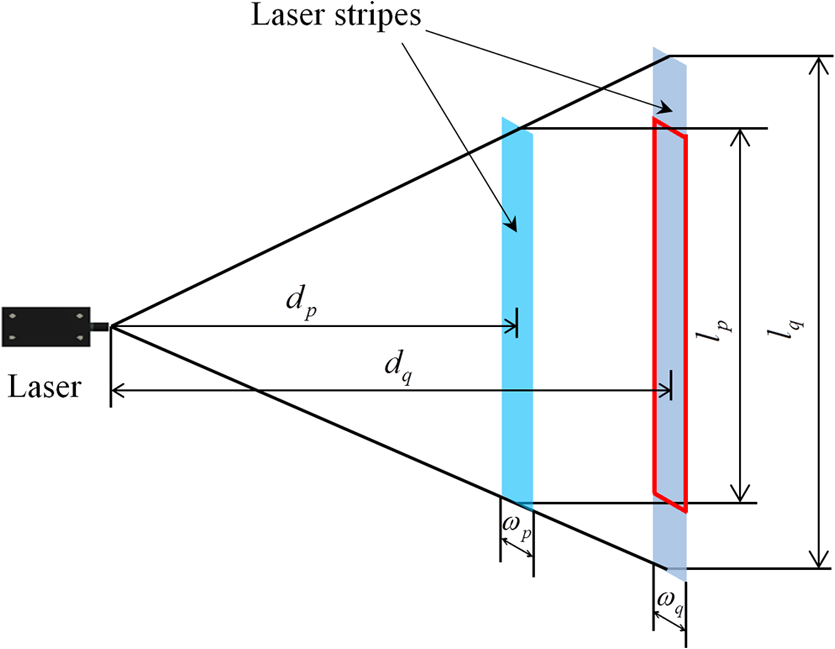
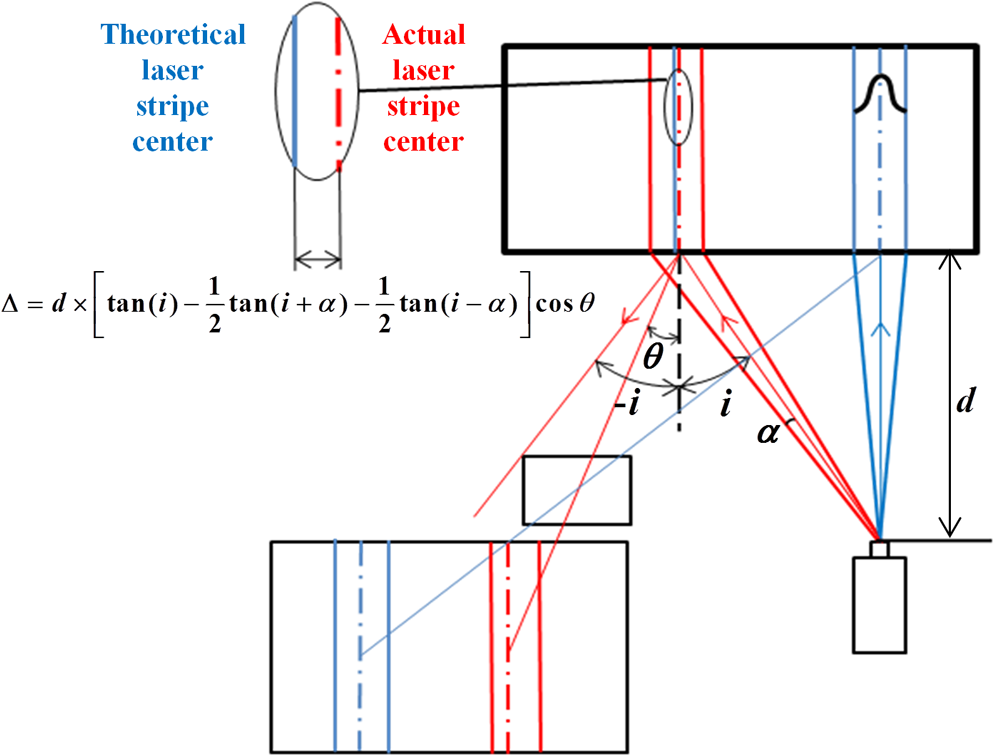
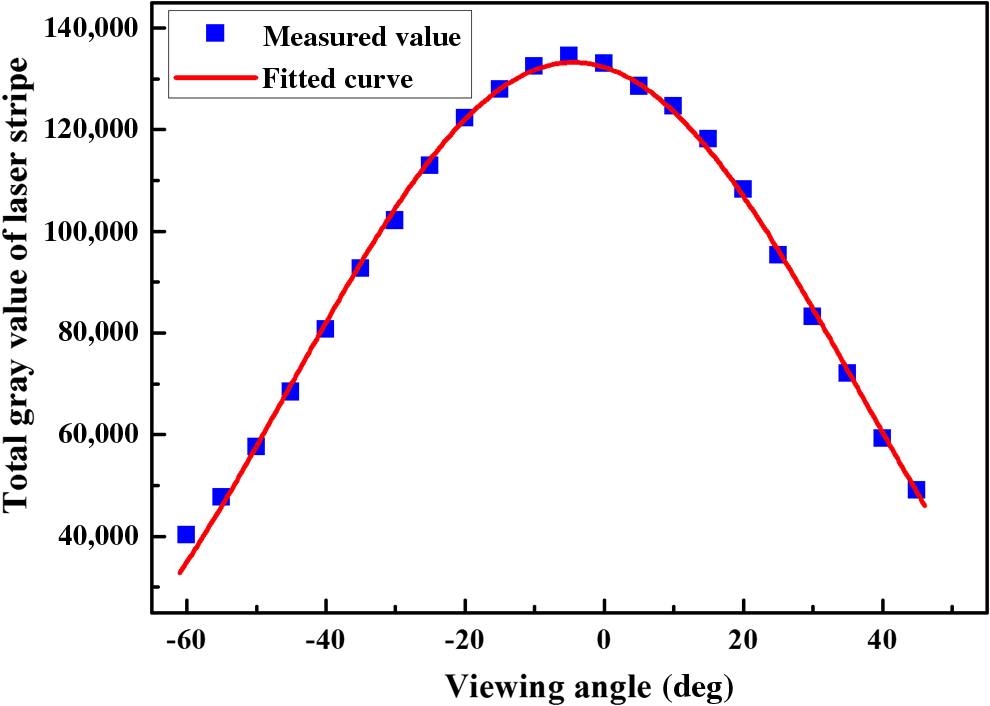
When the laser scans have measured objects over a large-scale measuring range, a large incident angle will lead to a large laser stripe center deviation. On the other hand, in measuring ranges with a smaller incident angle, the laser stripe center has a smaller deviation from the geometric center. Thus, for small incident angles, the laser stripe center can be extracted using the geometric center extraction method. However, in most cases, the gray distribution of the laser stripe significantly deviates from that of the reference image. When the value of Gaussian fitting structural similarity is less than a certain value, the laser stripe center is no longer close to the geometric center. Therefore, compensation should be applied to the laser stripe center after the geometric center extraction is performed. 3.3.Threshold Value of Gaussian Fitting Structural SimilarityThe threshold value of Gaussian fitting structural similarity is used for determining the similarity between the gray distribution of the laser stripe and the reference distribution. In this section, the relationship between the Gaussian fitting structural similarity and the centerline deviation of the laser stripe is analyzed after calculating the Gaussian fitting structural similarity of laser stripes from different incident angles. First, images of laser stripes are captured from different angles, and the gray distributions of laser stripes with various incident angles between 0 and 40 deg are shown in Fig. 3. Gray distribution curves for different incident angles are expressed using different colors. The red dashed line shows the center of the reference laser stripe, while the blue dashed line shows the center of the laser stripe with the maximum (40 deg) incident angle. Then the laser stripe images are processed using the median filter. Additionally, the reference laser stripe image is set as the initial position, which is the position of the laser stripe that is vertically projected on the measured object with a camera observing the light from a vertical position. The spatial relationship between the reference laser stripe and the projected laser stripe is shown in Fig. 4. The distance between the incident position of laser and the surface of measured object is defined as . When the incident angle of the laser stripe is , the theoretical distance from the center of the projected laser stripe to the reference laser stripe is . Therefore, the deviation of the laser stripe center is the difference between the theoretical distance and actual distance. The standard deviation for the deviation of the laser stripe center can be calculated using Peters’ equation.22 where is the number of gray columns for the laser stripe images; is the deviation between the captured laser stripe center and the reference laser stripe center. The relationship between the Gaussian fitting structural similarity and the standard deviation of the centerline is shown in Fig. 5.Fig. 5The relationship between the Gaussian fitting structural similarity and the standard deviation. 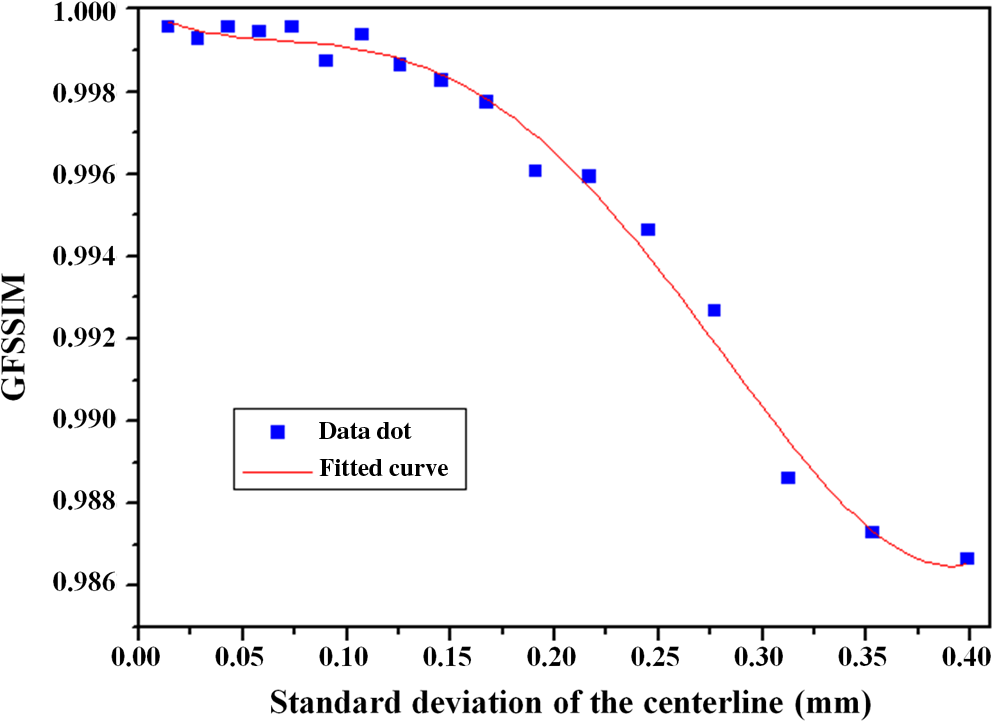 As shown in Fig. 5, with increasing incident angles, the Gaussian fitting structural similarity decreases and the centerline deviation of the laser stripe increases. The Gaussian fitting structural similarity of the stripe is relatively high when the centerline deviation is small, and the value of similarity sharply decreases when the centerline offset exceeds a particular threshold. The relationship between the Gaussian fitting structural similarity and the standard deviation of the laser stripe center deviation can be described by a high-order polynomial curve. Thus, when the centerline deviation is , the value of Gaussian structural similarity can be obtained using the fitting curve. 4.Center Compensation Method Based on the Analysis of Multiple Source FactorsThe center of the laser stripe deviates from the geometric center due to the material surface reflectivity, laser spatial transmission, camera imaging characteristics, and the incidence angle from the camera. When the deviation of the laser stripe center exceeds a certain threshold, the accuracy of the laser center extraction is further decreased by using the geometric center extraction method. Thus, we propose a center compensation method based on the analysis of the multiple source factors (reflectivity characteristics of the material surfaces, spatial transmission characteristics of the laser, and imaging characteristics of cameras) for improving the accuracy of laser center extraction. 4.1.Relationships Between the Gray Distribution of the Laser Stripe and Multiple Source FactorsThe gray distribution of laser stripes is affected in real-time by the spatial light intensity distribution, material reflectivity characteristics, and spatial transmission characteristics. Thus, the real-time information for a laser stripe can be quantifiably expressed by a laser stripe model that is based on associations between the gray distribution of a laser stripe and the multiple source factors. The imaging mechanism for the image sensor is shown in Fig. 6. In the sensitive characteristics of the image sensor, the model of the optical electronic converter is expressed as follows:23,24 where is the electrical output signal of the sensors, is the accumulation of light energy, is the coefficient of electrical output signals, is the electrical output signal of the sensor without lighting, and is the index of the optical electronic converter, which is approximately equal to 1, in general. Thus, the electrical output signal from the sensor has a linear relationship with the accumulation of light energy. The gray distribution of images captured by the image sensor can demonstrate the spatial light energy of laser.In the actual measuring space, the laser stripes are projected on the measuring surface of objects at a certain incident angle. Then the laser stripes are reflected off the surface and captured by the camera. The laser stripe images are affected by the physical and geometric quantities shown in Fig. 7. The relationship between the gray distribution of the laser stripe and the multiple source factors can be written as where is a compound function of laser stripe energy that includes the influence of the laser spatial transmission characteristics, material reflectivity characteristics, imaging characteristics of the cameras, and the spatial light intensity distribution. Moreover, , , represent the functions of laser stripe energy affected by the laser spatial transmission characteristics, material reflectivity characteristics, and imaging characteristics of cameras, respectively, with spatial distance , incident angle , and physical characteristic coefficient .First, we analyze the laser spatial transmission characteristics. The laser is transmitted according to a hyperbolic curve in the time domain. Because the laser transmitters used in large-scale triangulation scanning measurement systems have a better performance quality, the divergence angle of these lasers is quite small. Thus, we assume that the laser is transmitted in a straight line (with no deviation). Figure 8 shows the laser stripe transmission in space. With a certain flare laser angle, the relationship between the length of the laser stripe , and the projection distance , agrees with the theory of similar triangles. Additionally, the measurement range for a large-scale triangulation scanning measurement system is limited. Under a certain measurement distance, the luminous flux of the laser in a certain cross-section is relatively constant. Therefore, the luminous flux in the cross-section of projection distance nearly equals to the luminous flux in the cross-section of projection distance . Thus, the light intensity of the laser is inversely proportional to the transmission length of the laser stripe. The light intensity with certain length for laser stripes with the different projection distances can be expressed as where is the width of laser stripes . On the basis of Eqs. (10) and (11), the relationship between the light intensity of laser stripes and the light intensity of laser stripes can be deduced as where , are the width of laser stripes and , respectively. Compared with the reference image, the light intensity of the laser stripe is given by where is the coefficient of light intensity, is the projection distance of the reference laser stripe, and is the fitting error.After projection by the laser transmitter, the laser stripe is reflected by the surface of the measured object. Then the laser stripe is captured by the image sensor. The reflected laser stripes are affected by the incident angle, the reflection characteristics of the measured material, and the observation angle of cameras. According to the reflection characteristics, the reflected light primarily includes specular reflection light and diffuse reflection light.25,26 The energy of specular reflection light is determined by the incident angle of laser and material reflection characteristic . The energy of diffuse reflection light is related to the material reflection characteristic and the observation angle of the camera . When the intensity of the incident light is , the intensity of the reflected light can be expressed as follows: where is the index of diffuse reflection light.Moreover, when the distance from the laser transmitter to the plane of object is and the incident angle is , the laser transmission distance can be deduced by the equation . According to our impact analysis of the multiple source factors (laser spatial transmission characteristics, material reflectivity characteristics, imaging characteristics, and spatial light intensity distribution), the relationship between the gray distribution of the laser stripe and multiple source factors can be expressed as where is the light intensity of the captured laser stripes and is the light intensity of the environment. Because the light intensity of the environment is much lower than the intensity of the laser, the environmental light intensity can be ignored. Thus, Eq. (13) can be expressed as4.2.Center Compensation Method Based on Geometric AnalysisIn the image capturing process, the position of the camera is fixed. The scanning plane is produced by the motion of the laser stripe over different incident angles. A schematic diagram of a large-scale triangulation scanning measurement system is shown in Fig. 9. Because the gray distribution of the laser stripe is symmetric in the reference image, the center of the laser stripe coincides with its geometric center. As discussed above, when the incident angle of the laser transmitter varies, the center of the laser stripe deviates from the geometric center, and the width of the laser stripe changes. The center of the reference laser stripe is the initial position for our system. The distance between the initial position (reference stripe) and the center of the extracted laser stripe is defined as the position of the laser stripe center. Half of the flare angle of the laser is set as . For the distance from the laser transmitter to the plane of the measured object and incident angle , the laser incident light is projected on the surface of the object at a certain angle. The position of the laser stripe center is extracted by the geometric center extraction method, which is the distance from the last laser stripe to the first stripe, which is described by However, the actual position of the laser stripe center is Thus, the deviation of the laser stripe center can be expressed as In the measurement space, the imaging principle of the camera approximates the pinhole imaging principle, and the measured objects are projected on the imaging plane through the optic center of the lens. When the angle between the direction of observation and the plane vector of the measured object is , the deviation of the laser stripe can be expressed as Because the incident angle is controlled by the rotating platform, the incident angle is a known quantity. Additionally, the observation angle can be calculated by the relationship between the gray distribution of the laser stripe and the multiple source factors. Thus, the center of the laser stripe can be compensated according to Eq. (20). 5.ExperimentThe large-scale triangulation scanning measurement system includes two CMOS cameras (VC-25MC-M/C 30, Korea Vieworks Company) with a resolution of and a pixel size of , linear solid lasers with wavelengths of 450 nm, lens (AF-S-24-70 mm f/2.8G, Nikkor), a controlled platform, and an imaging workstation (Z820, HP). A flat plate of the composite material T800 is selected as the measured object because this is the primary material used in aircraft components. The experimental system is shown in Fig. 10. Using this measurement system, the accuracy of the proposed center compensation method is verified through a large number of tests. Moreover, a flat tail of an airplane was measured in the assembly workshop in an aviation manufacturing company to further validate the proposed measuring method. 5.1.Threshold Value of Gaussian Fitting Structural SimilarityThe Gaussian fitting structural similarity of corresponding stripes is calculated to analyze the gray distribution of different stripes. The relationship between the gray distribution of the laser stripes on T800 aviation composite materials and the corresponding Gaussian fitting structural similarity should be discussed to confirm the threshold value for the Gaussian fitting structural similarity. Images of laser stripes on the composite material T800 are shown in Fig. 9. For capturing the reference image of laser stripes, the laser incidence direction, camera observing direction, and the measured surface normal vector direction are set to the same direction, and the laser incident angle is defined as 0 deg. In this situation, the distance from the measured plane to the laser transmitter is measured by a laser rangefinder. Then utilizing the electric rotary platform with a repeated positioning accuracy of 0.003 deg, the incident angle of laser is changed every 2 deg. The laser stripes with different incident angles are projected on the surface. The original images and gray distribution images of laser stripes with different incident angles are shown in Fig. 11. Fig. 11The original images (top row) and gray distribution images (bottom row) of laser stripes with different incident angles: (a) 0 deg, (b) 12 deg, and (c) 30 deg.  Then the Gaussian fitting structural similarity is calculated for corresponding stripes with different incident angles. Moreover, the movement of the laser stripe on the measured plane can be obtained through the relative vertical distance and the incident angle. Since the part of laser stripe is saturated, of which the gray intensity can be obtained by Gaussian fitting of the gray intensity of unsaturated part. The movement distance and the values of Gaussian fitting structural similarity are shown in Table 1. Table 1The movement distance and the values of Gaussian fitting structural similarity.
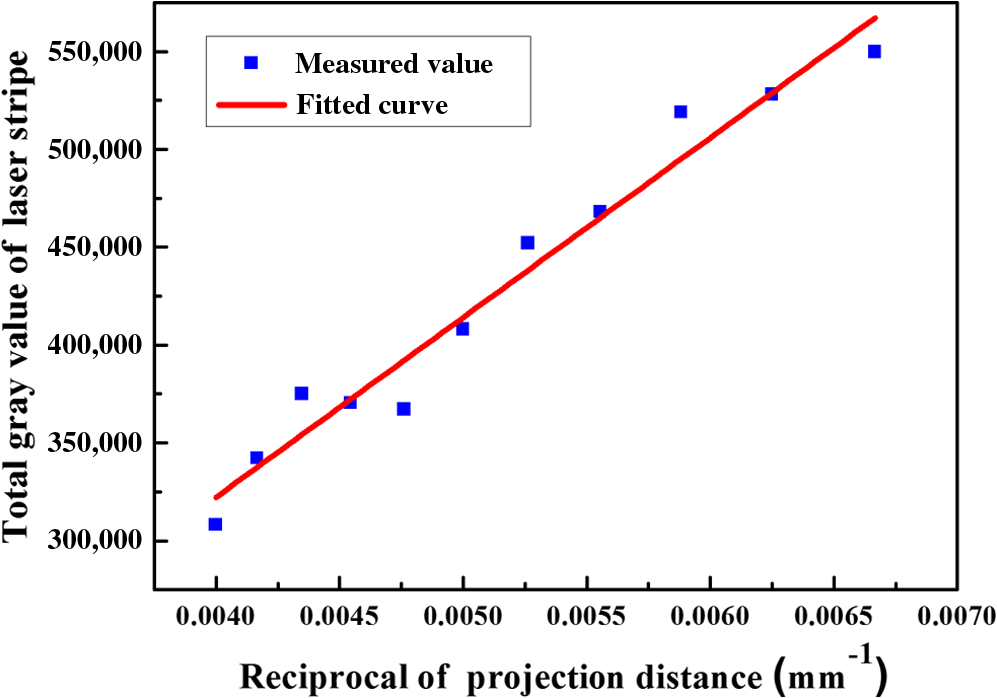
The relationship between the deviation and Gaussian fitting structural similarity is illustrated in Fig. 12(b). In accordance with the accuracy requirement for the actual measurement, the maximal error of the laser stripe extraction is 0.15 mm. Thus, the value of the Gaussian fitting structural similarity should be according to the curve fitting values in Fig. 12(b). The relationship between the incident angles and the Gaussian fitting structural similarity is illustrated in Fig. 12(a). Fig. 12The relationship between the Gaussian fitting structural similarity and (a) the incident angle and (b) the deviation. 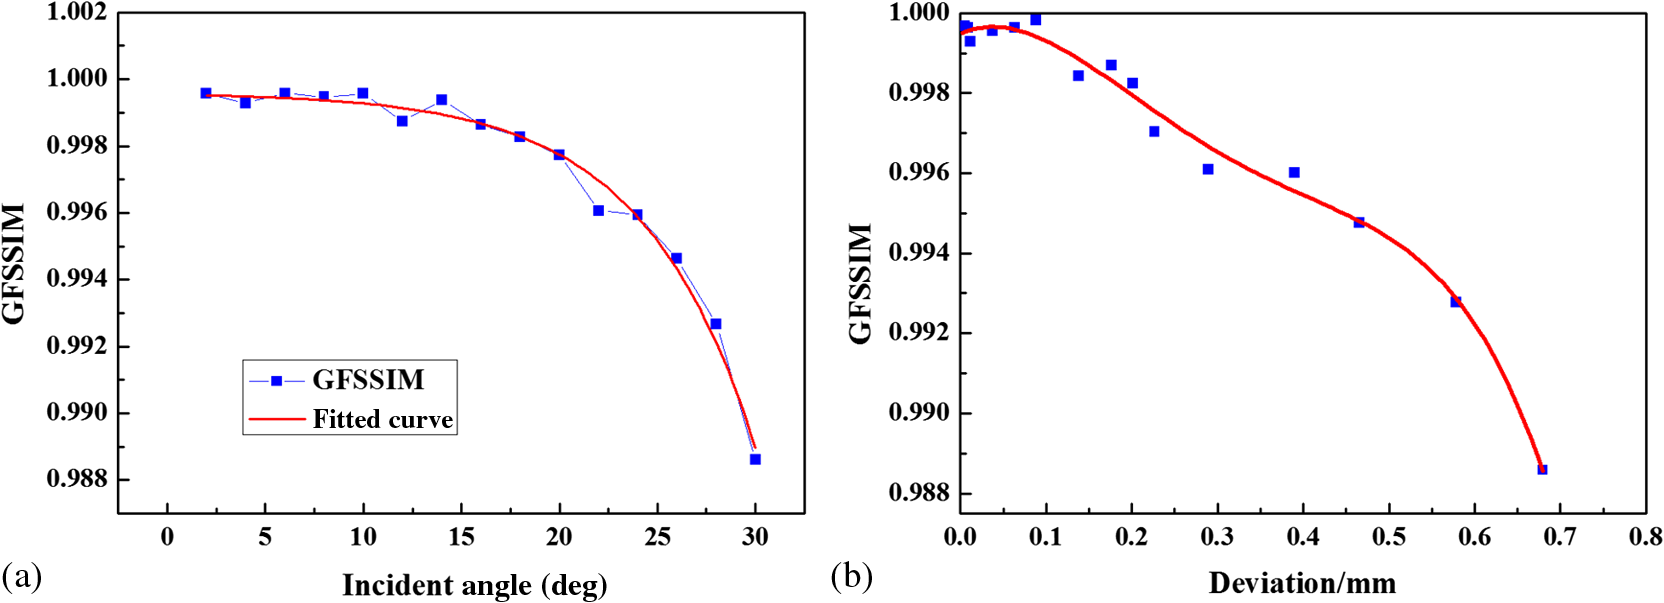 Figure 12 shows that when the value of Gaussian fitting structural similarity is 0.998, the incident angle is 20 deg. In this situation, the deviation from the actual laser center to the geometric center is beyond the acceptable range. Thus, the extraction center of the laser stripe should be compensated. 5.2.Compensation for the Laser Stripe CenterThe relationship between the gray distribution of the laser stripe and these multiple source factors are verified based on the measurement system. To simplify the calculation of the correlation coefficients for the model, the incident angle of the laser and the observing angle of the camera are set to 0 deg according to Eq. (16). Therefore, the laser incidence direction, camera observation direction, and the measured surface normal vector direction are the same. The laser transmitter is moved parallel along this direction. Moreover, the projection distance between the laser transmitter and the object surface changes. The spatial light intensity distribution of the laser must also be considered. The gray values of the laser stripes are shown in Fig. 13. Figure 13 shows that the brightness of laser stripe has a linear relationship with the reciprocal of the projection distance; the fitted curve is based on Eq. (13). These results confirm the theoretical analysis of laser spatial transmission characteristics described in Sec. 4.1. Then with a constant projection distance and a certain incident angle, the laser stripes are captured at different observation directions. The relationship between the camera offset angle and light brightness is shown in Fig. 14, and the fitted curve depends on Eq. (14). With the change in the incident angle, the coefficients of the material reflectivity characteristics and spatial transmission characteristics are calculated using Eq. (16). Thus, we can obtain a laser stripe gray distribution model based on the analysis of the multiple source factors for this experimental condition. Based on this model, both the center extraction method and the compensation method are applied to extract the center of the laser stripe when the laser stripe has a certain angle of incidence. The results are shown in Table 2 with the theoretical deviation of the actual deviation of the laser stripe. Table 2Experimental results.
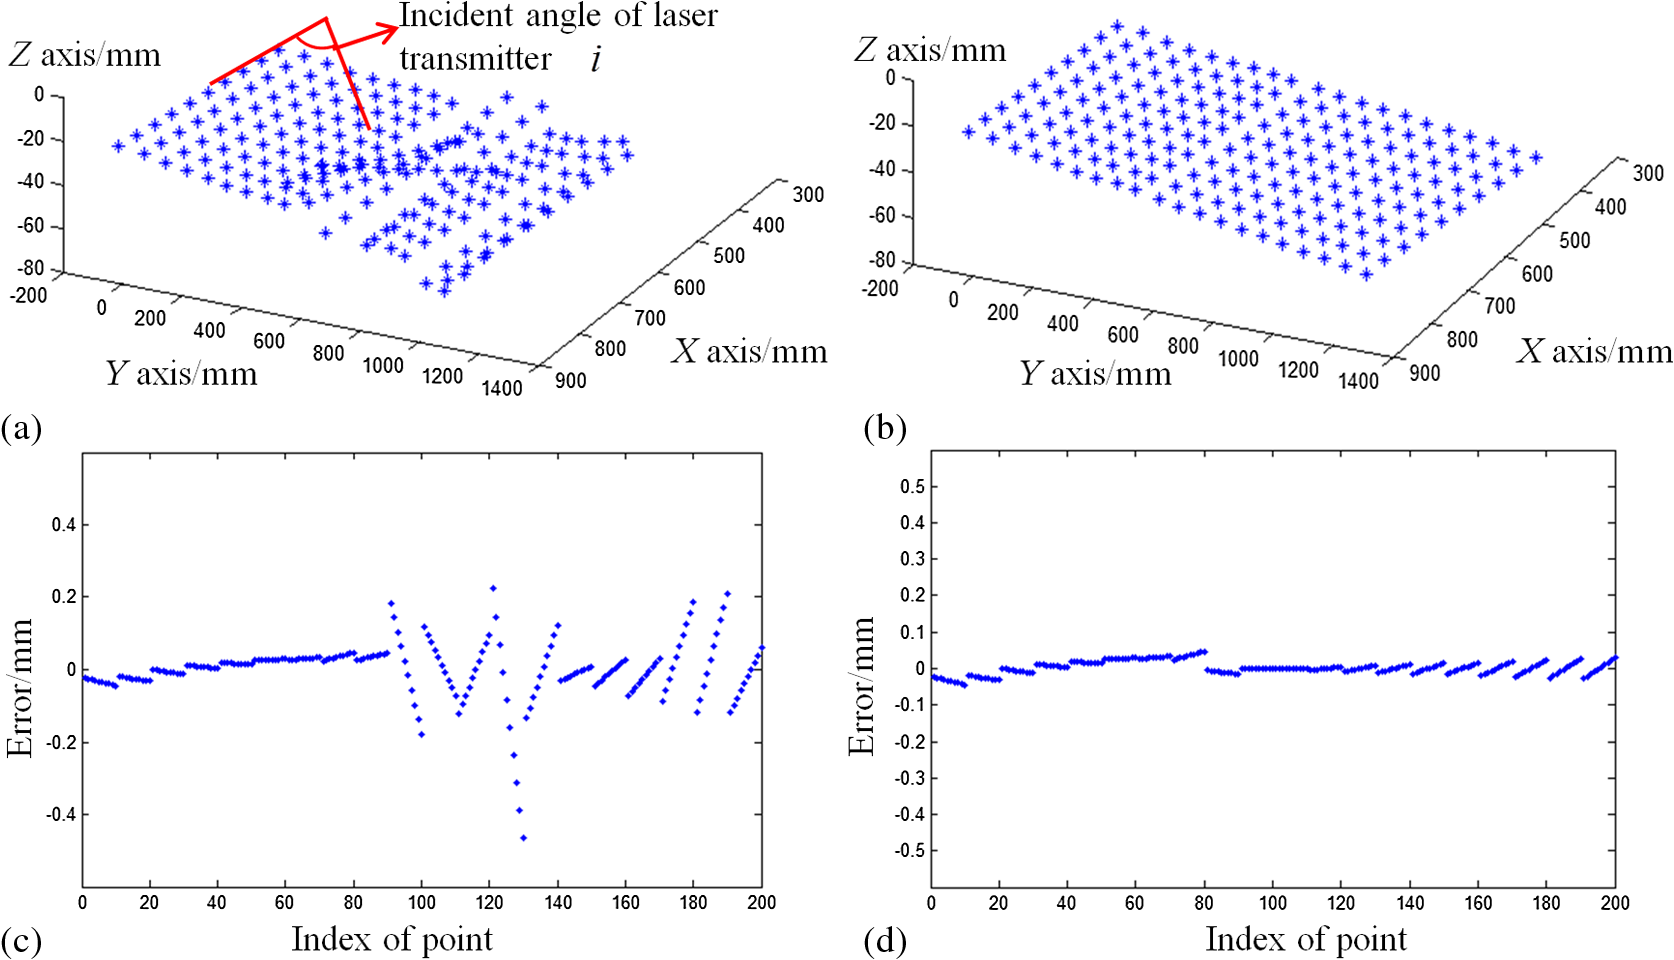
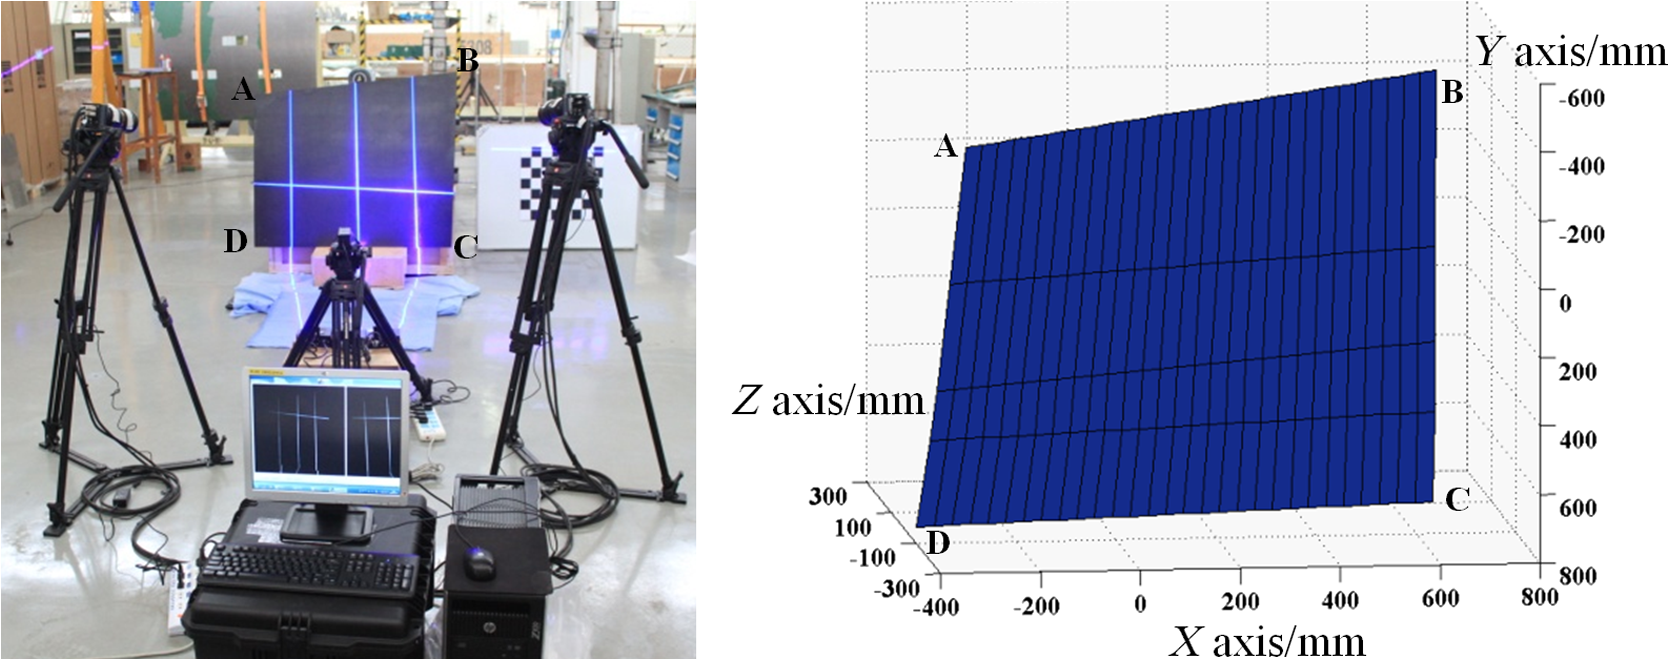
Based on the center extraction and compensation methods, the centers of the laser stripes are extracted. The reconstruction of the measured plane is shown in Fig. 15. The compensation method based on multiple source factors decreases the center deviation of the laser stripe, and the accuracy of measurement is improved by up to 99.86% compared to the center extraction method. 5.3.Field Experiment ValidationIn the assembly workshop of an aviation manufacturing company, a flat tail of an airplane is measured to test the proposed center compensation method. The profile of the composite part is within the size of . The cameras are calibrated using the plane target calibration method, and the intrinsic and extrinsic parameters of the two industrial cameras are determined. The experimental results is shown in Table 3 and the reconstruction of measured plane is shown in Fig. 16. Then the binocular vision measurement method based on laser scanning is used to realize the high-precision reduction of geometric parameters; the accuracy of measurement is up to 99.75% compared with the theoretical size. Table 3The results of field experiment validation.
6.ConclusionIn this study, we propose a laser stripe center extraction method based on the analysis of multiple source factors. The experimental results show that our proposed method significantly improves the accuracy of the laser stripe extraction for large-scale triangulation scanning measurement systems. To achieve this result, the laser stripe evaluation method (Gaussian fitting structural similarity) effectively provides a threshold value for center compensation by evaluating the similarity between the measured images and the reference image. When the value of Gaussian fitting structural similarity is beyond the defined threshold value, the geometric center deviates from the actual center of the laser stripe. This deviation is resolved by the proposed method of center compensation, which is based on our analysis of the spatial light intensity distribution, material reflectivity characteristics, imaging characteristics, and spatial transmission characteristics. The experiments in laboratory are conducted successfully, and the method has also been successfully applied to the measurement of aircraft components. AcknowledgmentsThis paper is supported by the National Basic Research Program of China 973 Project (Grant No. 2014CB046504), the National Natural Science Foundation of China (Grant No. 51227004), the National Natural Science Foundation of China (Grant No. 51375075), the Liaoning Provincial Natural Science Foundation of China (Grant No. 2014028010), and the Science Fund for Creative Research Groups (No. 51321004). ReferencesB. Marguet and B. Ribere,
“Measurement-assisted assembly applications on airbus final assembly lines,”
(2003). Google Scholar
B. J. Marsh,
“Laser tracker assisted aircraft machining and assembly,”
(2008). Google Scholar
M. Saadat and L. Cretin,
“Measurement systems for large aerospace components,”
Sens. Rev., 22
(3), 199
–206
(2002). http://dx.doi.org/10.1108/02602280210433025 SNRVDY 0260-2288 Google Scholar
J. E. Muelaner and P. Maropoulos,
“Large scale metrology in aerospace assembly,”
in 5th Int. Conf. on Digital Enterprise Technology,
(2008). Google Scholar
J. E. Muelaner, B. Cai and P. G. Maropoulos,
“Large-volume metrology instrument selection and measurability analysis,”
853
–868
(2010). Google Scholar
P. G. Maropoulos et al.,
“Large volume metrology process models: a framework for integrating measurement with assembly planning,”
CIRP Ann. Manuf. Technol., 57
(1), 477
–480
(2008). http://dx.doi.org/10.1016/j.cirp.2008.03.017 CIRAAT 0007-8506 Google Scholar
W. Cuypers et al.,
“Optical measurement techniques for mobile and large-scale dimensional metrology,”
Opt. Laser Eng., 47
(3), 292
–300
(2009). http://dx.doi.org/10.1016/j.optlaseng.2008.03.013 Google Scholar
Z. Liu et al.,
“Fast and flexible movable vision measurement for the surface of a large-sized object,”
Sensors, 15
(3), 4643
–4657
(2015). http://dx.doi.org/10.3390/s150304643 SNSRES 0746-9462 Google Scholar
H. L. Fu et al.,
“Innovative optical scanning technique and device for three-dimensional full-scale measurement of wind-turbine blades,”
Opt. Eng., 53
(12), 122411
(2014). http://dx.doi.org/10.1117/1.OE.53.12.122411 Google Scholar
W. Liu et al.,
“Fast dimensional measurement method and experiment of the forgings under high temperature,”
J. Mater. Process. Technol., 211
(2), 237
–244
(2011). http://dx.doi.org/10.1016/j.jmatprotec.2010.09.015 Google Scholar
L. Qi et al.,
“Statistical behavior analysis and precision optimization for the laser stripe center detector based on Steger’s algorithm,”
Opt. Express, 21
(11), 13442
–13449
(2013). http://dx.doi.org/10.1364/OE.21.013442 Google Scholar
Q. Xue et al.,
“Improving the measuring accuracy of structured light measurement system,”
Opt. Eng., 53
(11), 112204
(2014). http://dx.doi.org/10.1117/1.OE.53.11.112204 Google Scholar
H. Yousef et al.,
“An innovative approach in structured light systems,”
Proc. SPIE, 7864 78640N
(2011). http://dx.doi.org/10.1117/12.872394 PSISDG 0277-786X Google Scholar
W. Zhang, N. Cao and H. Guo,
“Novel sub-pixel feature point extracting algorithm for three-dimensional measurement system with linear-structure light,”
Proc. SPIE, 7656 76563V
(2010). http://dx.doi.org/10.1117/12.864563 PSISDG 0277-786X Google Scholar
J. Lukáš, J. Fridrich and M. Goljan,
“Detecting digital image forgeries using sensor pattern noise,”
Proc. SPIE, 6072 60720Y
(2006). http://dx.doi.org/10.1117/12.640109 PSISDG 0277-786X Google Scholar
J. Jang and K. Hong,
“Detection of curvilinear structures and reconstruction of their regions in gray-scale images,”
Pattern Recognit., 35
(4), 807
–824
(2002). http://dx.doi.org/10.1016/S0031-3203(01)00073-5 Google Scholar
J. Canny,
“A computational approach to edge detection,”
IEEE Trans. Pattern Anal. Mach. Intell., PAMI-8 679
–698
(1986). http://dx.doi.org/10.1109/TPAMI.1986.4767851 Google Scholar
P. E. Danielsson,
“Euclidean distance mapping,”
Comput. Graph. Image Process., 14
(3), 227
–248
(1980). http://dx.doi.org/10.1016/0146-664X(80)90054-4 Google Scholar
C. Steger,
“An unbiased detector of curvilinear structures,”
IEEE Trans. Pattern Anal. Mach. Intell., 20
(2), 113
–125
(1998). http://dx.doi.org/10.1109/34.659930 Google Scholar
W. Z. Z. Guangjun,
“A robust automatic method for extracting the centric line of straight structured-light stripe,”
Chin. J. Sci. Instrum., 2
(26), 244
–247
(2004). Google Scholar
Z. Wang et al.,
“Image quality assessment: from error visibility to structural similarity,”
IEEE Trans. Image Process., 13
(4), 600
–612
(2004). http://dx.doi.org/10.1109/TIP.2003.819861 Google Scholar
Y. T. Fei, Error Theory and Data Processing, China Machine Press, Beijing, China
(2010). Google Scholar
Y. He and X. Li,
“Error analysis of laser beam quality measured with CCD sensor and choice of the optimal threshold,”
Opt. Laser Technol., 45 671
–677
(2013). http://dx.doi.org/10.1016/j.optlastec.2012.05.013 Google Scholar
W. Liu et al.,
“An image acquiring method for position and attitude measurement of high-speed target in wind tunnel,”
Sens. Transducers, 160
(12), 635
(2013). Google Scholar
D. M. Guo et al.,
“Illumination model for fast measurement of free-form surface,”
Chin. J. Mech. Eng., 38 7
–11
(2002). http://dx.doi.org/10.3901/JME.2002.supp.007 Google Scholar
Z. G. Liang et al.,
“Sub-pixel feature extraction and edge detection in 3-D measuring using structured lights,”
Chin. J. Mech. Eng., 40
(12), 96
–99
(2004). http://dx.doi.org/10.3901/JME.2004.12.096 Google Scholar
BiographyYang Zhang is a PhD student at Dalian University of Technology. She received her BE degree in mechanical engineering from Dalian University of Technology in 2012. Her interests include three-dimensional measurement, binocular stereo vision, and digital image processing. Wei Liu is an assistant professor at Dalian University of Technology. He received his BE degrees in mechanical engineering from the North China Electric Power University in 2001 and his PhD in mechanical engineering from Dalian University of Technology in 2007. He is the author of more than 50 journal papers and has written one book chapter. His current research interests include precision measurement and precision control. Xiaodong Li is a master’s student at Dalian University of Technology. He received his BE degree in mechanism design, manufacturing, and automatization from Dalian University of Technology in 2013. His interests include large view field measurement, binocular stereo vision, and measurement system calibration. Fan Yang is a master’s student at Dalian University of Technology. He received his BE degree in mechanical design and manufacturing and automatization from Dalian Maritime University in 2014. His interests include camera calibration, three-dimensional measurement, binocular stereo vision, and aircraft assembly. Peng Gao is a master’s student at Dalian University of Technology. He received his BE degree in mechanical engineering from Dalian University of Technology in 2014. His interests include camera calibration, three-dimensional measurement, binocular stereo vision, and aircraft assembly. Zhenyuan Jia is a professor at Dalian University of Technology. He received his BE, MD, and PhD degrees in mechanical engineering from Dalian University of Technology in 1980, 1984, and 1987 respectively. His interests include precision and nontraditional machining, precision measurement, and controlling. |