|
|
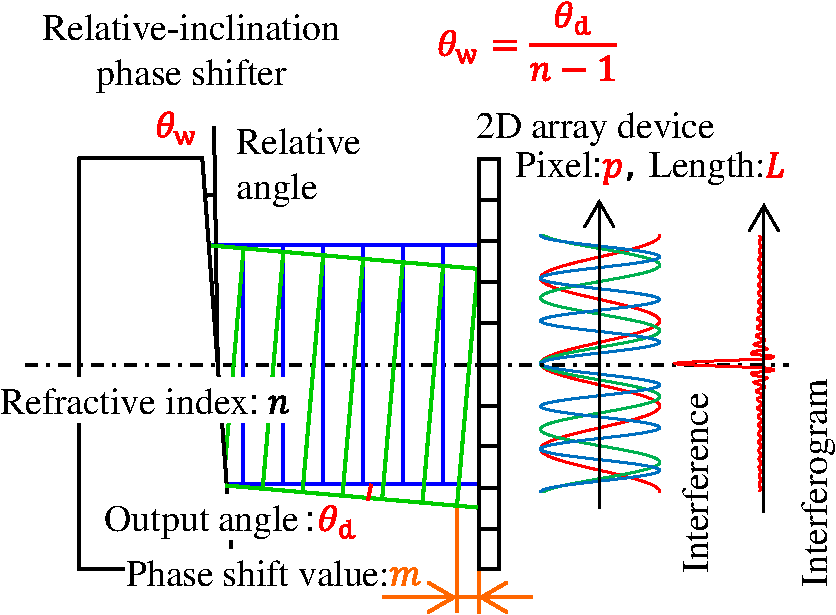
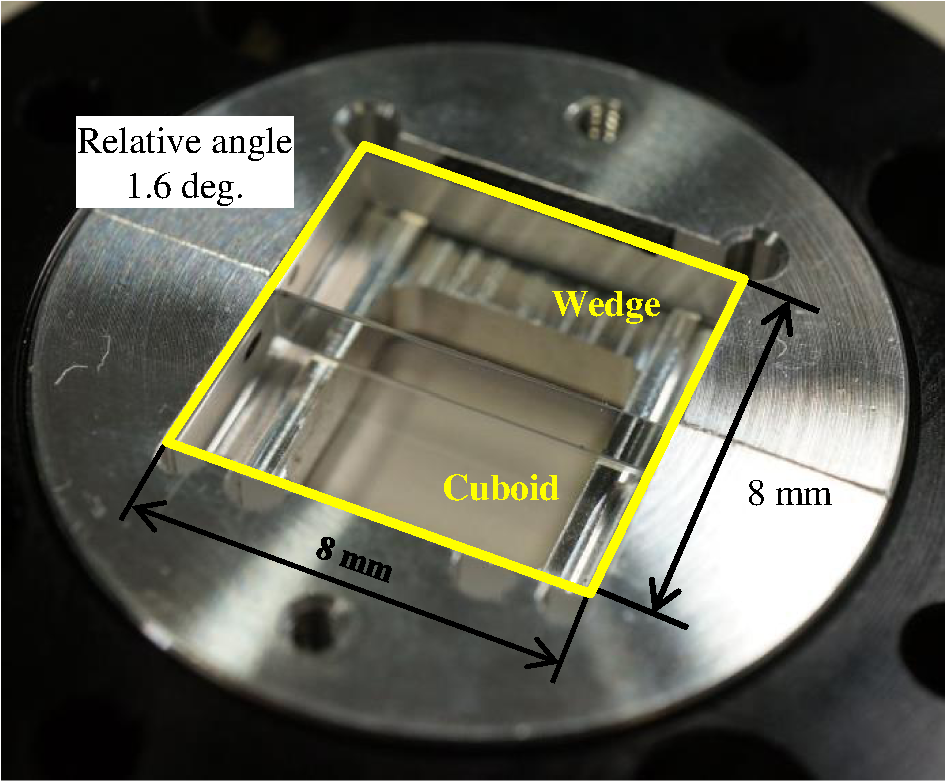
1.IntroductionIn recent years, wearable terminals have entered the arena of daily life, primarily for the purposes of health management. In addition, environmental measurements made using small, unmanned devices known as drones have garnered significant attention. For these reasons, noncontact spectroscopic techniques capable of component analysis have become a focus of interest. Also, the low-cost, compact-size spectrometer is requested and researched.1–8 However, in the conventional method of Fourier-transform infrared spectroscopy—which is based on the use of a Michelson interferometer—a significant driving distance is required for the mirrors. Moreover, because the light is split into two beams, the apparatus must be relatively large and tends to be sensitive to mechanical vibrations. For a spectroscopic device designed to be mounted on a drone, the maximum weight is about 500 g, and the device must offer spectroscopic imaging features. In addition, because spectrometers that use dispersion elements9–13 require long optical paths to disperse the light, they are difficult to miniaturize sufficiently to allow them to be mounted on a wearable terminal. For these reasons, lightweight spectroscopic imaging devices with sizes on the order of a few tens of millimeters are highly desirable. We have recently proposed a two-dimensional (2-D) Fourier-spectroscopic imaging technique,14,15 in addition to one-shot Fourier-spectroscopic tomography as an ultraminiature spectroscopic imaging method.16 The apparatus used in this technique consists solely of a glass slab with a portion of its surface polished at a certain inclination angle—a device we term a relative-inclination phase shifter—simply mounted on an infinite-distance-corrected optical imaging system consisting of two lenses. For this reason, the system may be ultraminiaturized to sizes on the order of a few tens of millimeters, ensuring the possibility in principle of incorporating the device into a smart phone. Moreover, because the technique uses a near-common-path wavefront-division phase-shift interferometer, and has absolutely no need for a mechanical drive unit, it is highly robust against mechanical vibrations. In addition, because our method uses Fourier-transform spectroscopy—which makes use of light at all wavelengths—it offers highly efficient light utilization and an outstanding signal-to-noise ratio compared to devices that incorporate distributed or hyperspectral acousto-optical tunable filters.17,18 The interferogram, which is a pattern formed by interference of waves at all wavelengths, reflects the spatial variation in the intensity of the interference depending on the magnitude of the phase shift. More specifically, one axis of a 2-D array of light-sensing devices is assigned as the phase-shift axis, while the other axis is used as the imaging axis, thus allowing one-dimensional spectroscopic tomography. For this reason, spectroscopic tomography measurements can be performed using a single image—i.e., within a single light-exposure interval—allowing high temporal resolution. This ensures that, in cases where high measurement accuracy is required, multiple measurements can be made in a few seconds, thus offering the advantages of time integration. The remainder of this paper is organized as follows: in Secs. 2, 3 and 4, we present the design methodology for the newly conceived phase shifter; in Sec. 5, we report the experimental and simulation results of tests to validate the principles underlying one-shot Fourier-spectroscopic tomography; in Sec. 6, we report the results of line-spectroscopic imaging about monochromatic light and polychromatic light; finally, we make a summary in Sec. 7. 2.One-Shot Fourier-Spectroscopic TomographyFigure 1 is a schematic depiction of the method of one-shot Fourier-spectroscopic tomography.16 This system is configured with observation optics, spectroscopic optics, and numerical analysis. The measurement field of view can be changed easily using wide lens or microscopic lens in the observation optics. The spectroscopic optics is based on an infinite-distance-corrected imaging optics consisting of an objective lens and a cylindrical imaging lens. The relative-inclination phase shifter is positioned at the back focal plane of the objective lens, which corresponds to the optical Fourier transform plane. The ultracompact relative-inclination phase shifter will be described detail in Sec. 2.1. We first note the conjugate plane, which is shown at the left side of Fig. 1. A slit is introduced to restrict the field of vision of the conjugate plane to 1-D. The conjugate plane can be modeled as a collection of bright points. Light is emitted in multiple directions from each bright point on the plane. These light rays are collimated by the objective lens and collected by the cylindrical lens—which serves as the imaging lens—after passing through the relative-inclination phase shifter. This leads to the formation of bright lines on a 2-D array of light-sensing devices on the conjugate plane. Interference patterns arise as spatially varying bright-dark patterns in the horizontal direction along phase shift axis, which is shown in the right side of Fig. 1. Light with shorter wavelengths will yield interference patterns with shorter periods corresponding to the magnitude of the phase shift. On the other hand, long-wavelength light will give rise to interference patterns with longer periods. Superposing the periodic light-dark patterns for all wavelengths yields an interference pattern known as an interferogram. Thus, the spectral characteristics of perpendicular imaging lines on the object plane are observed in the form of a 2-D variation of the interference intensity on the imaging plane. The spectral characteristics of each bright point are then determined analytically from the intensity distribution for each horizontal line—i.e., by computing the Fourier transform of the interferogram. Moreover, because this device has no drive unit and employs an optical system with a partially shared optical path, it exhibits high robustness against mechanical vibrations, allowing measurements to be made under a wide variety of conditions. In the following sections, we discuss ultracompact relative-inclination phase shifter, the reason of realization the one-shot Fourier-spectroscopic tomography, the interferometric principles, and design methodology for the phase shifter, and then describe the procedure for correcting the inclination of the light beam arising from the inclined glass. 2.1.Ultracompact Relative-Inclination Phase ShifterThe relative-inclination phase shifter is a device consisting of a glass slab in which a portion of the surface has been polished at a certain inclination angle; it divides a parallel light beam into two parts. This device is introduced at the optical Fourier-transform plane to impart a spatial phase shift to half of the incoming light beam. The perpendicular light passing through the flat surface and the inclined light passing through the inclined surface develop a relative phase shift depending on the degree of inclination, creating an interference pattern when they intersect at the imaging plane. The thickness of the relative-inclination phase shifter does affect the phase shift between the two beams; this allows the phase shifter to be made extremely thin, ensuring the possibility of device miniaturization. For example, a glass cover slip with a thickness of 0.3 mm, with one half of its surface polished to exhibit an inclination angle, can function as a phase shifter. Thus, the ultracompact relative-inclination phase shifter can be realized. 2.2.Reason of Realization the One-Shot Fourier-Spectroscopic TomographyThe proposed method uses wavefront-division interferometry, interference phenomena arise only when the perpendicular beam and the inclined beam intersect at the imaging plane. Therefore, only light beams received from the focal plane are involved in the interference, and light from other planes does not contribute. Because the measurement plane can thus be restricted to the focal plane, it is possible to achieve spectroscopic tomography by mechanically scanning the focal plane in the depth direction. 3.Phase Shifter DesignThe parameters important for Fourier spectroscopy are the shortest wavelength—i.e., the highest frequency—in the measurement band, and the sampling interval, which must be chosen to satisfy the conditions of the sampling theorem. Here we will discuss the design requirements for the inclination angle of the relative-inclination phase shifter—which is the only design parameter in the system—to ensure that the system can achieve the desired wavelength resolution in a given wavelength range. Figure 2 shows the optical system that follows the relative-inclination phase shifter. The cylindrical lens, which is the imaging lens, has a minimal effect on the phase shift and is neglected here. First, in the paraxial approximation, the relationship between the refractive index , the relative-inclination angle of the glass, and the deflection angle is The phase shift is determined by the relative inclination between the vertical wavefront and the actual wavefront, which has an inclination angle due to its interaction with the inclined surface. The phase shift is then given as Here is the length of the light-sensing element. On the other hand, denoting the center wavelength of the measurement band by and the wavelength resolution by , the phase shift is given as From Eqs. (2) and (3), the deflection angle is given as Inserting Eq. (4) into Eq. (1) yields an expression for the relative angle of the relative-inclination phase shifter In one-shot Fourier-spectroscopic tomography, the phase-shift axis is assigned to one axis of the light-sensing array, and sampling is performed by pixel rows. The sampling interval is expressed by Eq. (6) in terms of the number of pixels in one row of the light-sensing element and the phase shift . In a typical 2-D light-sensing array, the number of pixels is greater in the horizontal direction than in the vertical direction, so we use the number of pixels in the horizontal direction Thus, for one-shot Fourier-spectroscopic tomography, the sampling interval is the phase shift per pixel, . Next, to reconstruct waveforms from the Fourier transform, the sampling theorem dictates that we must sample at a frequency greater than or equal to twice the frequency corresponding to the shortest wavelength From Eqs. (3), (6), and (7), the number of pixels required in the light-sensing element to satisfy the conditions of the sampling theorem is If we use a light-sensing element with a sufficient number of pixels to satisfy Eq. (8), then the relative-inclination angle can be determined by inserting into Eq. (5) the wavelength resolution , the center wavelength , the length of the light-sensing element, and the refractive index . We used this equation to design a relative-inclination phase shifter for use in the visible light region. Table 1 lists the parameters used in this design, while Fig. 3 shows the fabricated relative-inclination phase shifter. The phase shifter is composed of two glass elements (each with outer dimensions ), one of which is flat and the other inclined. Table 1Design parameters for phase shifter.
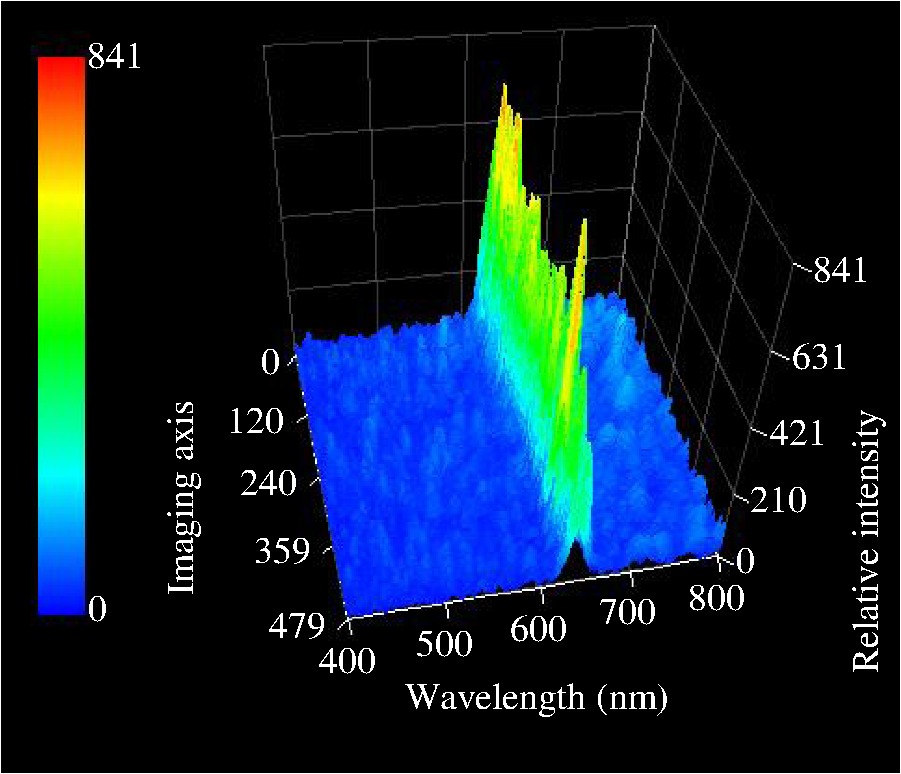
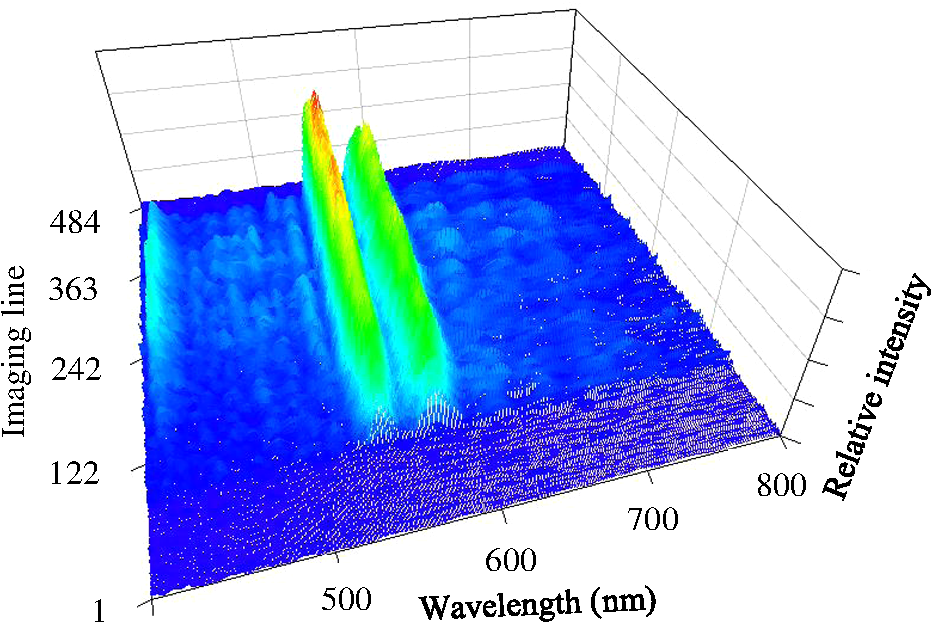
4.Image Position Correction for Interference PatternsWe first consider, as Fig. 4 shows, the case in which the flat and inclined surfaces of the relative-inclination phase shifter intersect at a fixed point on the light axis. In this case, the light beam passing through the inclined plane has an inclination angle . The position at which this beam and the beam passing through the flat surface intersect with a phase shift of zero is offset from the light axis. Interferograms typically exhibit left-right symmetry, with the maximum amplitude occurring at the point of zero phase shift. For this reason, the point in the interferogram corresponding to the maximum interference intensity is shifted in the horizontal direction in the image plane, and it is not possible to measure the contrast waveform. To correct this position, we displace the point at which the two planes intersect a small distance in a direction perpendicular to the light axis. Alternatively, because this is an imaging optical system, we could perform the correction by displacing the slit lying at a point conjugate to the light-sensing plane. The distance from the point of intersection to the image location is twice the focal length of the cylindrical imaging lens. Thus, the magnitude of the correction is given as Alternatively, replacing the deflection angle with the relative-inclination angle yields The spectral characteristic is shown with relative intensity (vertical axis) and wavelength (horizontal axis). The interferogram build from the adding all the waves shifted for each other wavelength, which can be obtained on the imaging plane. The chromatic dispersion derived from each wavelength because of the different refractive indexes. The relative intensity is calculated by mathematic Fourier transform. The chromatic dispersion is no effect on the relative intensity. However, the chromatic dispersion affects the imaging of the optical axis direction. This issue will be cleared by no-chromatic dispersion lens design. 5.Observation of Interference Patterns and Results of SimulationsWe performed interference experiments using the relative-inclination phase shifter to demonstrate the principles underlying one-shot Fourier-spectroscopic tomography. We first carried out point measurements, which allow detailed observation of the interference patterns. Figure 5(a) shows the actual layout of the optical system. The light source was a 542-nm laser (Showa Optronics model 542 solid-state laser J050LS-1A, output power 50 mW). We placed a pinhole at a focal distance of 50 mm from the objective and imaging lenses and the relative-inclination phase shifter is installed on the Fourier transform plane in the infinite-distance-corrected optical imaging system. The optical detector was a black-and-white camera (Sony model XCG-V60E, pixel pitch , pixel count , frame rate 90 fps). Fig. 5Experimental and simulation results for wavefront-division phase-shift interferometry, (a) photo of point spectroscopic optical system, (b) interference image obtained by point measurements at 542 nm, and (c) simulated intensity profiles at bright point for different phase shifts. 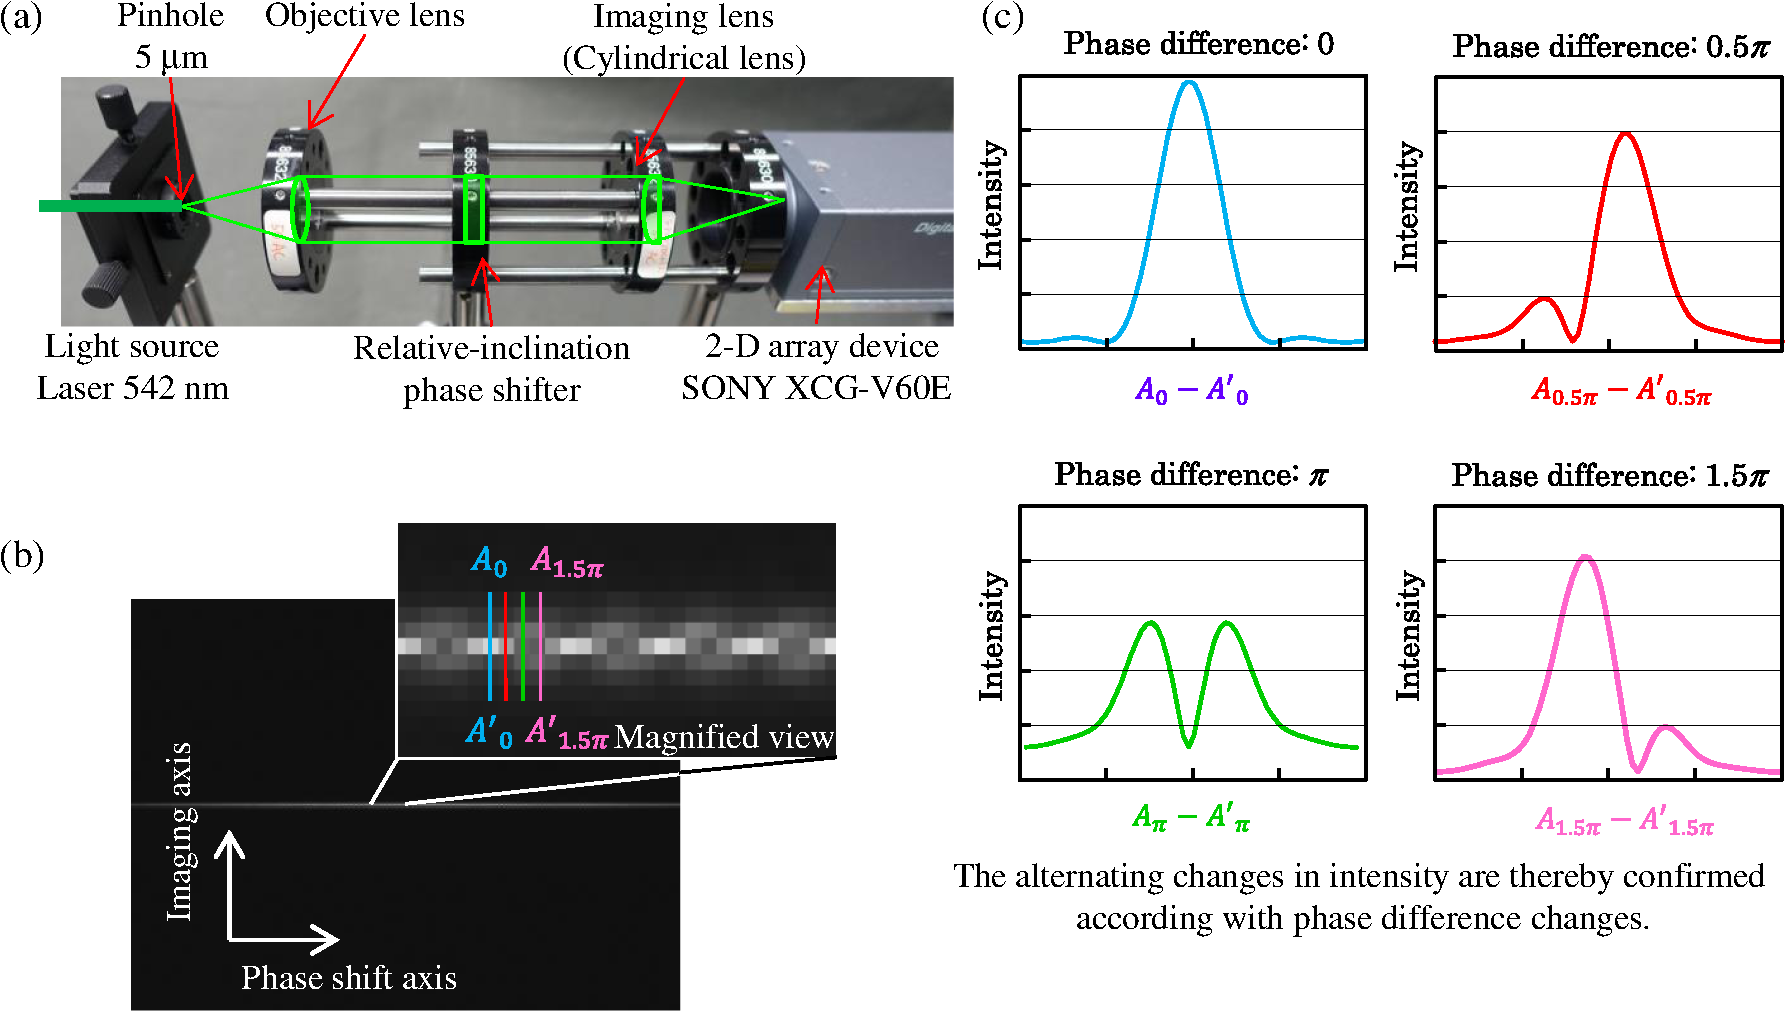 Figure 5(b) shows a captured interferogram and a magnified view is a part of interferogram. The interferogram can be observed at the central region of picture. A single horizontal line is visible in the center of the image. Enlarging this region reveals a periodic bright-dark interference pattern. The interference pattern takes the form of a crosswoven lattice. This arises because the spatial phase shifting procedure creates a periodic distribution in the light intensity. The interference intensity changes of wavefront-division phase-shift interferometry19 are shown in Fig. 5(c). Vertical axis is intensity. Horizontal axis is the section of , , , and . The alternating changes in intensity are thereby confirmed from the sections which is the characteristic of wavefront-division phase-shift interferometry. This is different about the amplitude-division phase-shift interferometry, such as Michael interferometer. In the case of amplitude-division phase-shift interferometry, when the phase difference is 0, the rays strengthen each other, so the interference intensity is bright. On the other hand, when the phase difference is , the rays weaken each other, so the interference is dark. However, in the case of wavefront-division phase-shift interferometry, the interference intensity cannot become dark even if the phase difference is , because the first dark-ring becomes bright. We have confirmed these using simulations. The principle behind one-shot Fourier spectroscopy is shown in Fig. 6(a). Fig. 6Schematic diagram of one-short Fourier spectroscopy and simulated intensity map for imaging line. (a) Schematic diagram of one-shot Fourier spectroscopy, (b) imaging line, and (c) interference pattern. 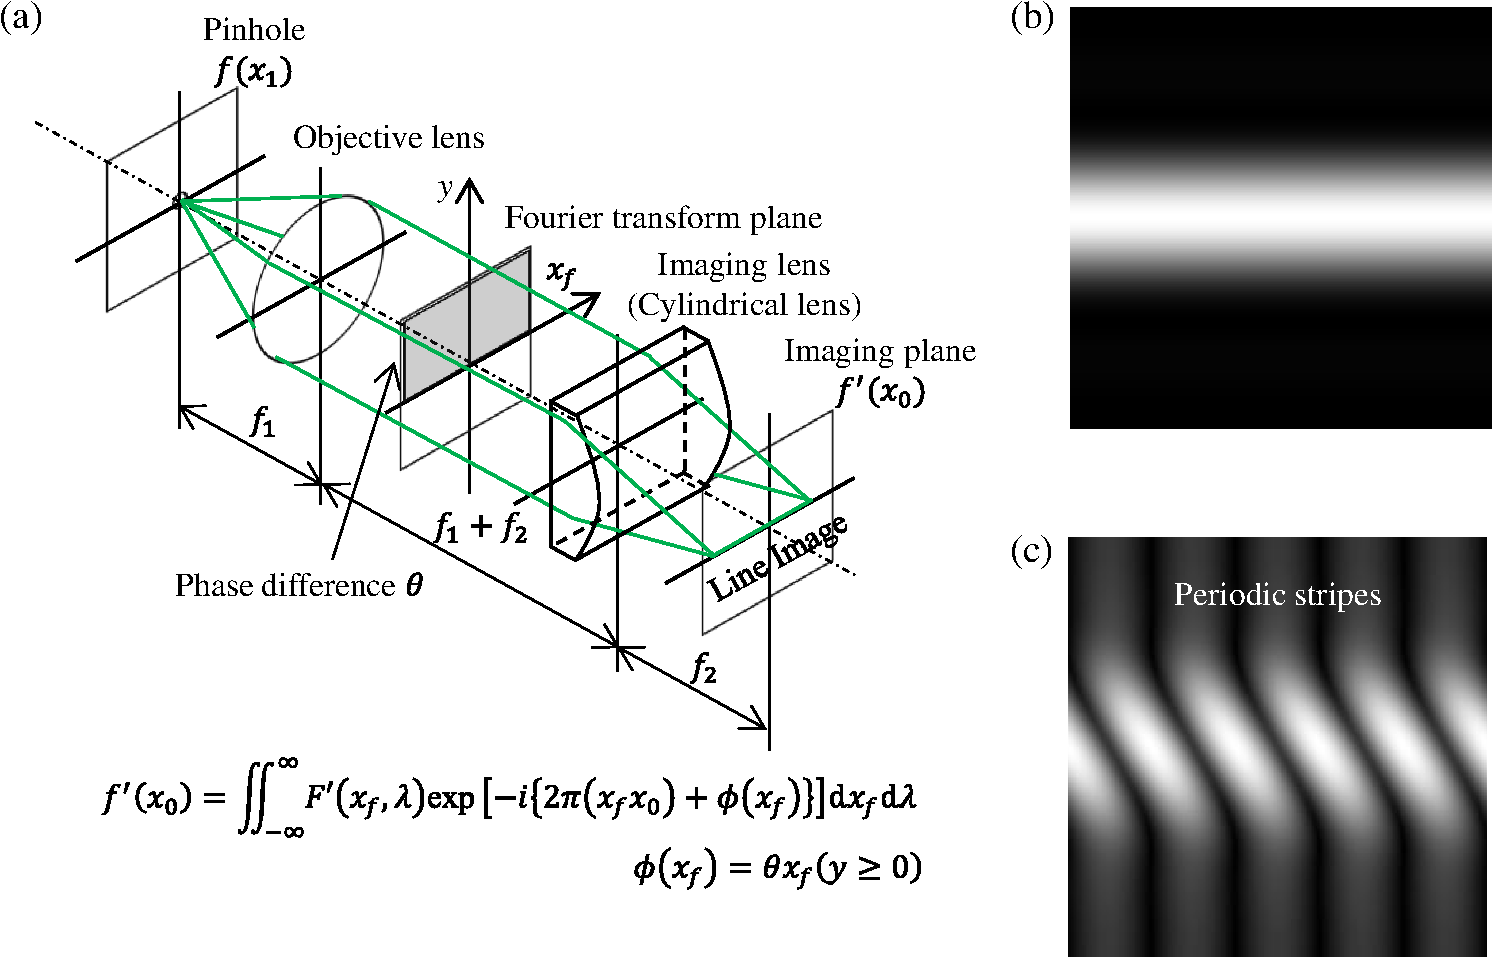 The polychromatic wavelengths-imaging complex amplitude distribution14,15,19 is where is the spatial coordinates on the image plane, is the coordinates on the Fourier transform plane, is the diffracted light distribution for a particular wavelength λ, and is the phase difference distribution. As shown in Fig. 6(a), phase differences are given to half of the objective flux () in the Fourier transform plane. If the no phase difference is given to half of objective flux, there is only line image as shown in Fig. 6(b). If phase differences are given to the half of objective flux, the interference pattern is shown in Fig. 6(c), the periodic stripes can be confirmed. This bright-dark pattern is similar to that observed experimentally. Thus, the experimental results confirm the principles underlying the formation of interference patterns and validate the soundness of our method.6.Line Spectroscopic ImagingHaving confirmed the interference principles underlying our methodology via point measurements, we next conducted line-spectroscopic imaging. Figure 7(a) shows the experimental optical system. Fig. 7Results of line spectroscopic imaging. (a) Photograph of line spectroscopic optical system, (b) measured spatial interference pattern, and pseudocolor plot of pattern visibility, (c) interferogram, and (d) spectral characteristics of image center line (240th line). 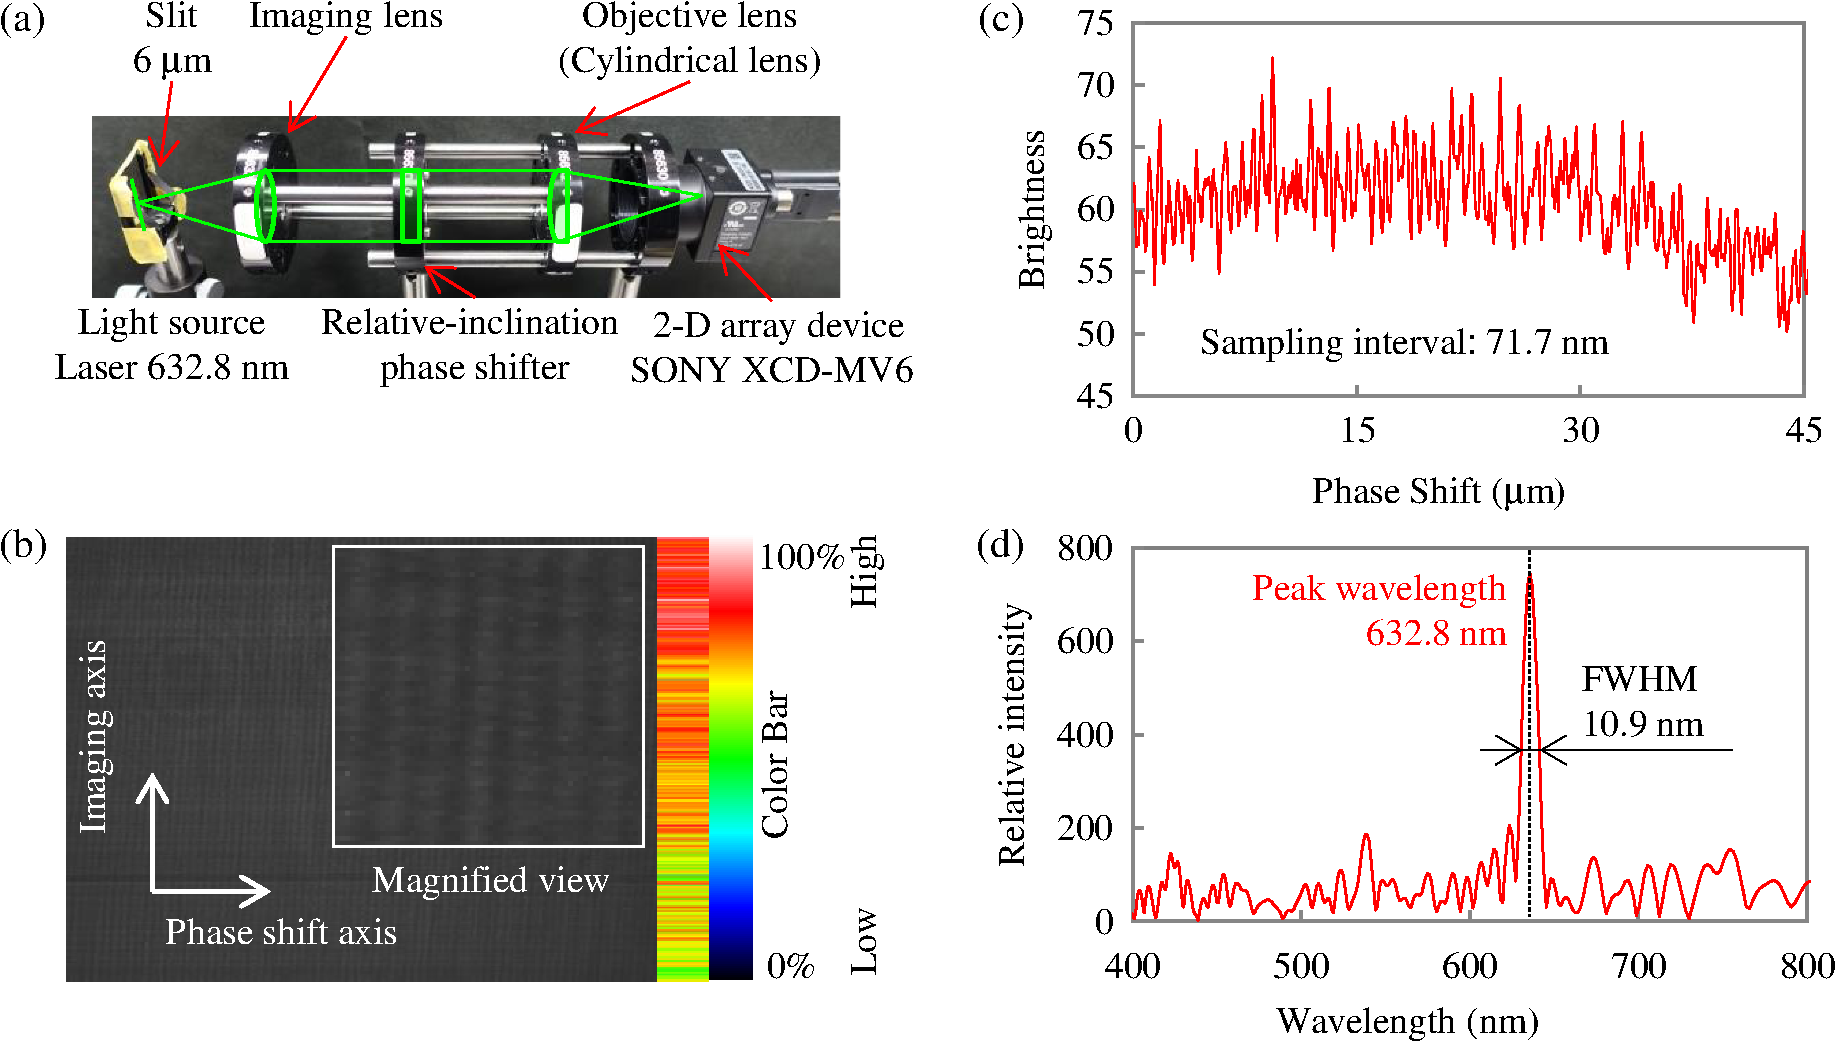 A slit with a width of was used to restrict the field of view. The optical source was a He-Ne laser (Melles Griot model 05-LHP-991, output power 10 mW). We used the same black-and-white camera employed in the design of the phase shifter (Sony model XCD-MV6, pixel pitch , pixel count , frame rate 60 fps) as the light detector. The laser beam was enlarged using a beam expander to illuminate the entire slit. Figure 7(b) shows the observed image and the magnified view of interference pattern; the vertical axis is the imaging axis, and the horizontal axis is the phase shift axis. The region observed had dimensions of in the vertical direction and in the horizontal direction. Vertical stripes are visible throughout the image, confirming the successful observation of interference over the full surface. To the right of the observed image is a pseudocolor plot of the color definition of the interferogram used to obtain the brightness of each line. The color scale is 841. The interference pattern (fringe) of one point is along the phase shift axis, the interference pattern of one line distributed in whole interference image area as shown in Fig. 7(b). It can be seen that the interference is stronger in the upper part of the figure. We believe this is due to the nonuniformity of the illuminating light. The interferogram is obtained from 240th line as shown in Fig. 7(c). The interferogram can be obtained from the arbitrary line on the imaging axis. Easy to see, only one interferogram is plotted. Here the horizontal axis is the phase shift, and the vertical axis is the light intensity. A periodic intensity variation can be seen that tracks the phase shift. Figure 7(d) shows the spectral characteristic obtained by Fourier transforming the interferogram. Here the horizontal axis is the wavelength, and the vertical axis is the relative intensity. The sampling interval is 71.7 nm which can be calculated using Eq. (6), and the performance matches the design values for the relative-inclination phase shifter, for which the half-width is 10.9 nm. Figure 8 shows the results of line spectroscopic imaging based on analysis of the interferograms for all lines. Here, the imaging axis is into the page. It can be seen that a bright-line spectrum of the He-Ne laser at a wavelength of 632.8 nm is obtained for all lines. Moreover, the line spectroscopic imaging of polychromatic light is also conducted, such as metal-halide lamp. The optics is shown in Fig. 7(a). The polychromatic light of metal-halide lamp (Sigmakoki metal-halide lamp model IMH-250) is used as light source. The results of polychromatic light’s line spectroscopic imaging are shown in Fig. 9. The interference image is shown in Fig. 9(a). Vertical stripes can be confirmed by the magnified view. The interferogram [Fig. 9(b)] is obtained from the line which is shown in Fig. 9(a). The spectral characteristics [Fig. 9(c)] are calculated using mathematical Fourier transformation. The spectral characteristics of Hg which contains in metal-halide lamp can be confirmed at the wavelength 546 and 577 nm in Fig. 9(c). Fig. 9Results of polyechromatic light’s line spectroscopic imaging, (a) interference image of polychromatic light, (b) interferogram, and (c) spectral characteristics. 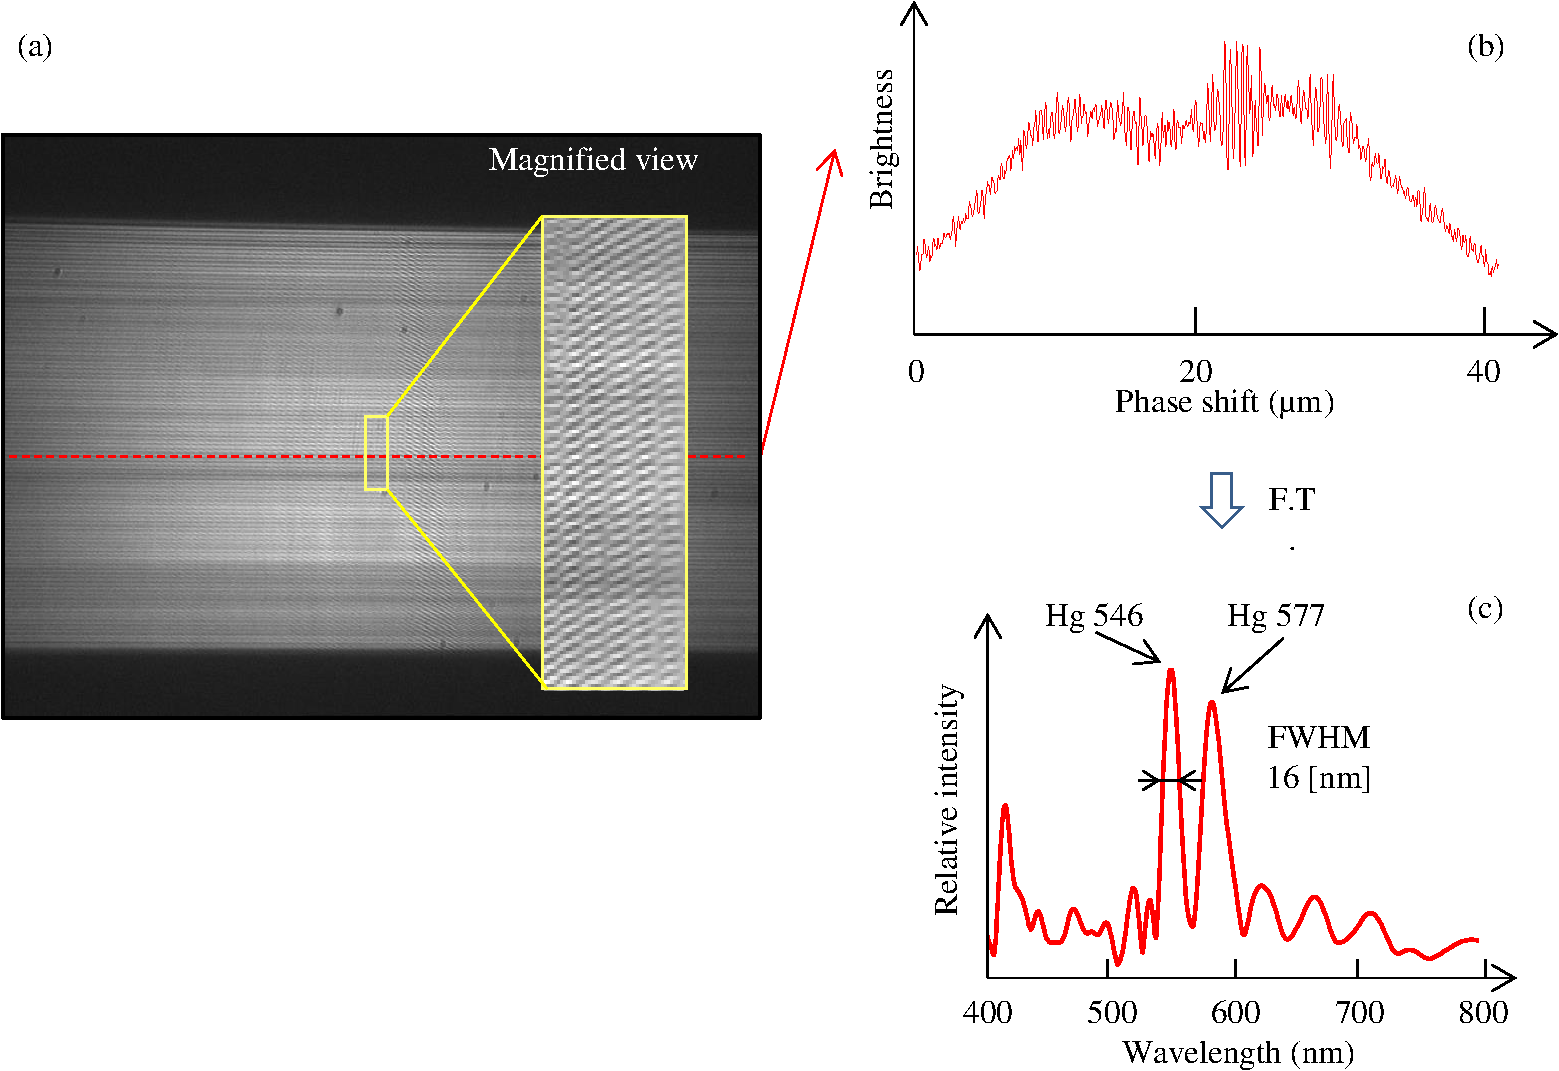 Figure 10 shows the results of spectroscopic imaging based on analysis of the interferograms for all lines. Here, the imaging axis is into the page. It can be seen that two bright-line spectrum of the metal-halide lamp at wavelength of 546 and 577 nm are obtained for all lines. These demonstrate the possibility of using the proposed method to achieve line spectroscopic imaging. 7.SummaryIn this paper, we proposed and validated the principle of one-shot spectroscopic tomography as an ultraminiature spectroscopic imaging technique. We discussed the design principles for a new type of phase shifter, and reported the results of tests to validate the concept of one-shot Fourier-spectroscopic tomography and line-spectroscopic imaging. Thus we have demonstrated the possibility of realizing a spectroscopic imaging device with a thickness of a few tens of millimeters, suitable for incorporation into a smartphone. In future work, we will pay attention to produce the ultraminiature size one-shot Fourier spectroscopy which can be installed in a smartphone. For example, the key part of relative-inclination phase shifter will be produced by surface polished glass. The spectroscopic systems can be realized only a few grams and the thin is only a few tens of millimeters. The realization of smartphone-mounted one-shot Fourier spectroscopy can be expected. Also, measurement sensitivity will be improved by slit design and lens design. ReferencesN. Agladze and A. J. Sievers,
“Miniaturization of holographic Fourier-transform spectrometers,”
Appl. Opt., 43
(36), 6568
–6579
(2004). http://dx.doi.org/10.1364/AO.43.006568 Google Scholar
N. Liao et al.,
“Realization of Fourier transform imaging spectrometer based on all-reflective optics,”
Proc. SPIE, 7506 750615
(2009). http://dx.doi.org/10.1117/12.848691 Google Scholar
M. Kozlova et al.,
“Double Lloyd’s mirror: versatile instrument for XUV surface interferometry and interferometric microscopy,”
Proc. SPIE, 5919 59190Q
(2005). http://dx.doi.org/10.1117/12.618384 Google Scholar
M.-Y. Liang and N.-F. Liao,
“Study on optical design of all-reflective Fourier transform imaging spectrometer,”
Proc. SPIE, 6624 66240C
(2008). http://dx.doi.org/10.1117/12.791063 Google Scholar
N. De Oliveira et al.,
“A Fourier transform spectrometer without a beam splitter for the vacuum ultraviolet range: from the optical design to the first UV spectrum,”
Rev. Sci. Instrum. Am. Inst. Phys., 80
(4), 043101
(2009). http://dx.doi.org/10.1063/1.3111452 Google Scholar
N. Zhang et al.,
“Wave front division interferometer based optical coherence tomography for sensitivity optimization,”
J. Optcom., 285 1589
–1592
(2012). http://dx.doi.org/10.1016/j.optcom.2011.10.074 Google Scholar
H. Choi et al.,
“Depth resolved hyperspectral imaging spectrometer based on structured light illumination and Fourier transform interferometry,”
Biomed. Opt. Express, 5 3494
(2014). http://dx.doi.org/10.1364/BOE.5.003494 Google Scholar
J. Szlachetko et al.,
“Wavelength-dispersive spectrometer for X-ray microfluorescence analysis at the X-ray microscopy beamline ID21 (ESRF),”
J. Synch. Radiat., 17 400
–408
(2010). http://dx.doi.org/10.1107/S0909049510010691 Google Scholar
Y. Yasuno et al.,
“One-shot-phase-shifting Fourier domain optical coherence tomography by reference wavefront tilting,”
Opt. Express, 12 6184
(2004). http://dx.doi.org/10.1364/OPEX.12.006184 Google Scholar
M. Servin et al.,
“A novel technique for spatial phase-shifting interferometry,”
J. Mod. Opt., 42 1853
(1995). http://dx.doi.org/10.1080/09500349514551621 Google Scholar
S. Nakadate et al.,
“Real-time vibration measurement by a spatial phase-shifting technique with a tilted holographic interferogram,”
Appl. Opt., 36 281
(1997). http://dx.doi.org/10.1364/AO.36.000281 Google Scholar
S. Murata et al.,
“Spatial phase-shifting digital holography for three-dimensional particle tracking velocimetry,”
Jpn. J. Appl. Phys., 48 09LB01
(2009). http://dx.doi.org/10.1143/JJAP.48.09LB01 Google Scholar
Y. Inoue et al.,
“Variable phase-contrast fluorescence spectrometry for fluorescently stained cells,”
Appl. Phys. Lett., 89 121103
(2006). http://dx.doi.org/10.1063/1.2356312 Google Scholar
H. Kobayashi et al.,
“Spectroscopic tomography by imaging-type two-dimensional Fourier spectroscopy,”
Optics, 41 136
–144
(2012). Google Scholar
S. Sato et al.,
“Proposal of one-shot-type spectroscopic-tomography for non-invasive medical-measurement,”
in Proc. OSA Biomedical Optics,
8798
(2013). Google Scholar
S. E. Harris and R. W. Wallace,
“Acousto-optic tunable filter,”
J. Opt. Soc. Am., 59 744
–747
(1969). http://dx.doi.org/10.1364/JOSA.59.000744 Google Scholar
J. Katrašnik et al.,
“Spectral characterization and calibration of AOTF spectrometers and hyper-spectral imaging system,”
Chemomet. Intell. Lab. Syst., 101 23
–29
(2010). http://dx.doi.org/10.1016/j.chemolab.2009.11.012 Google Scholar
W. Qi et al.,
“Enhanced interference-pattern visibility using multislit optical superposition method for imaging-type two-dimensional Fourier spectroscopy,”
Appl. Opt., 54
(20), 6254
–6259
(2015). http://dx.doi.org/10.1364/AO.54.00625410.1364/AO.54.006254 Google Scholar
Biography |