|
|
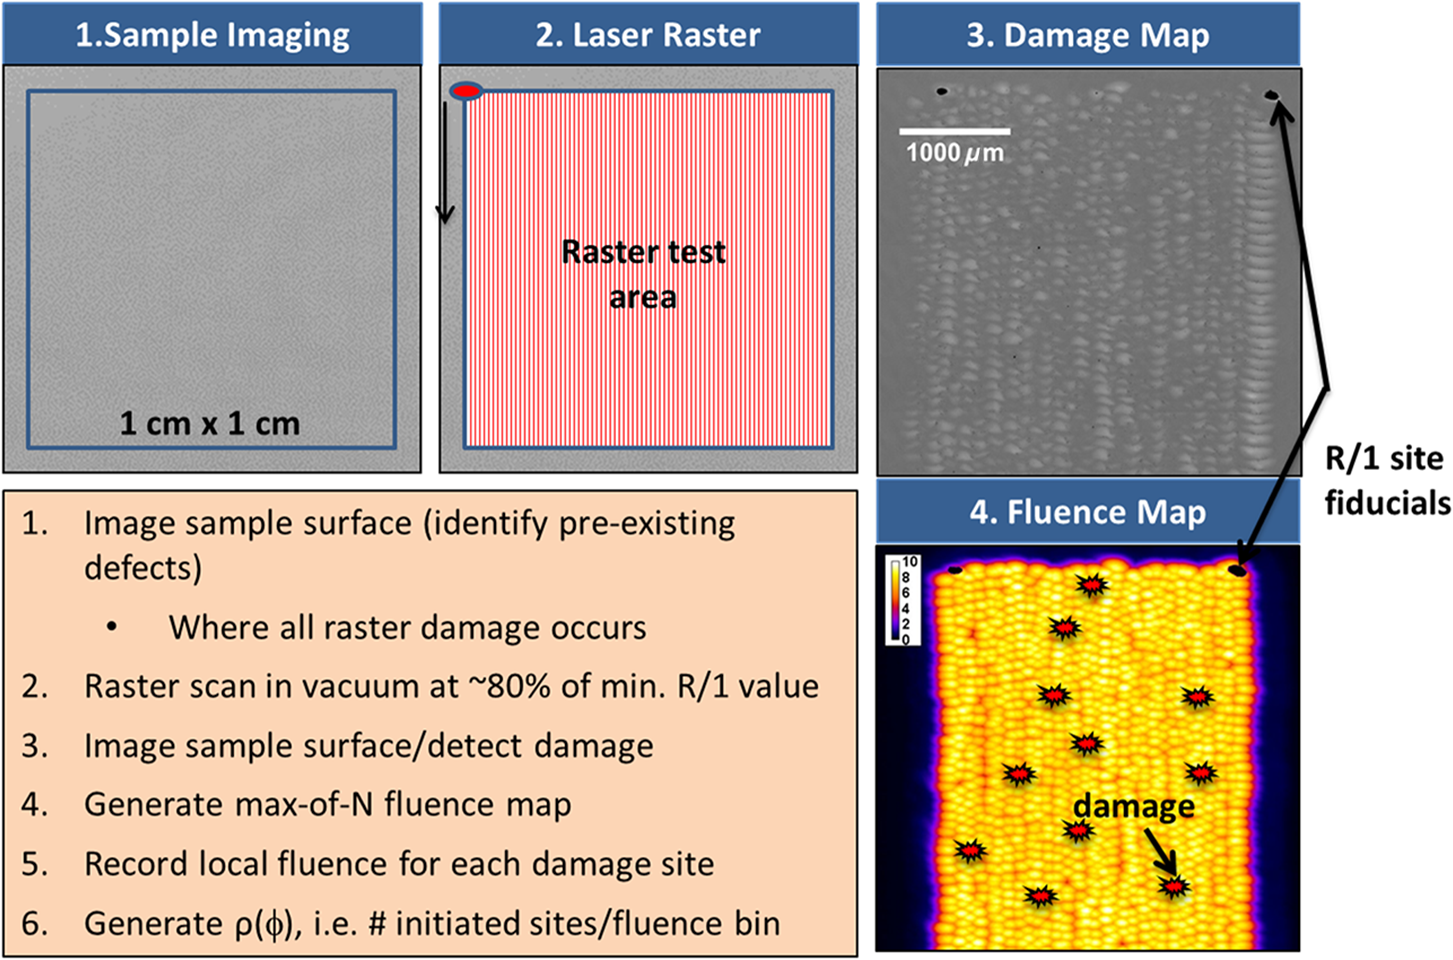
1.IntroductionThere is worldwide interest in the use of high-peak-power/high-energy laser systems1 for a broad range of applications, including direct laser writing in transparent optical materials2,3 and driving intense secondary sources such as energetic electron beams and x-ray sources.4–7 These applications require high laser intensities on target delivered in a short time scale and, therefore, pulse durations range typically from a few hundred femtoseconds (fs) up to a few tens of picoseconds (ps).3 One of the challenges associated with the safe operation of such petawatt-class laser systems is laser-induced damage in optical components. In addition, there are outstanding issues in laser–matter interactions in the ps-pulse regime.2,3,8 Extensive experimental and theoretical studies of laser damage with ns-pulses suggest extrinsic mechanisms (e-field enhancement due to nodular geometry) are in effect, in which localized absorption of incident radiation by isolated defects in the material leads to transfer of energy to the lattice and damage occurs when the deposited heat is sufficient to melt, boil, or fracture the dielectric material.8 In the fs-pulse regime, intensities corresponding to breakdown produce electrons via multiphoton and avalanche ionization and an intrinsic damage threshold of the material is sharply observed.8 However, fewer studies have examined the relative importance of intrinsic versus extrinsic mechanisms in the transition region of 0.5 to 100 ps. The Advanced Radiographic Capability (ARC) coming online at Lawrence Livermore National Laboratory (LLNL) is designed to produce energetic x-rays for backlighting experiments conducted at the National Ignition Facility (NIF).9,10 The ARC laser system implements chirped pulse amplification and subsequent pulse compression on four beamlines of the NIF to produce petawatt-class short pulses (1 to 30 ps) at 1053 nm with a total energy of 3.2 to 13.6 kJ. To avoid buildup of nonlinear effects while propagating energetic short pulses in air or bulk materials, pulse compression, transport, and focusing optics must rely on optical thin-film mirror coatings operating in a vacuum environment. The peak irradiance of the ARC system may be limited by optical damage on these final optics, making it of great interest to qualify their performance in their use environment and gain insight into the fundamental damage mechanisms in the ps-pulse regime. In this study, we characterize the laser-induced damage by near-IR (1053 nm), ps pulses on multilayer dielectric (MLD), high-reflectivity (HR) coatings suitable for large-aperture petawatt laser systems. We employ standard R-on-1 as well as raster scanning using small-area beam test methodologies to quantify the intrinsic coating performance under simulated use conditions and determine whether or not damage with ps pulses is extrinsic (defect-driven) in nature, as is the case with ns pulses. The results obtained from representative subscale witness samples can be used to inform on the multishot, full-scale optics performance at the ARC operation fluence. 2.Experimental Methods2.1.Damage Test Setup and Fluence CalibrationThe vacuum damage test station developed at LLNL was described elsewhere11 and is depicted schematically in Fig. 1. In brief, the output of an optical parametric chirped pulse amplification (OPCPA) laser system12 operating at 1053-nm, 10-Hz repetition rate with energy up to per pulse and tunable duration from up to 50 ps is directed via a 1:1 vacuum-relay imaging system onto a dedicated optical table located in a class-10,000 laboratory. A beam-splitter (BS) provides main and reference beam paths. Two thin-film polarizers (Pol) eliminate residual elliptical polarization from the beam after pulse compression and are used in combination with a motorized half-wave plate () to provide continuous control of the energy delivered to the sample. Fig. 1Schematic of vacuum damage test station driven by a 1053-nm, 10-Hz OPCPA laser system with tunable pulse duration from 0.5 to 50 ps. Pol, thin-film polarizer; , half-wave plate; BS, beam-splitter; SCC, scanning cross-correlator; CCD1 and CMOS are sensors for beam profile monitoring and in situ damage detection, respectively. 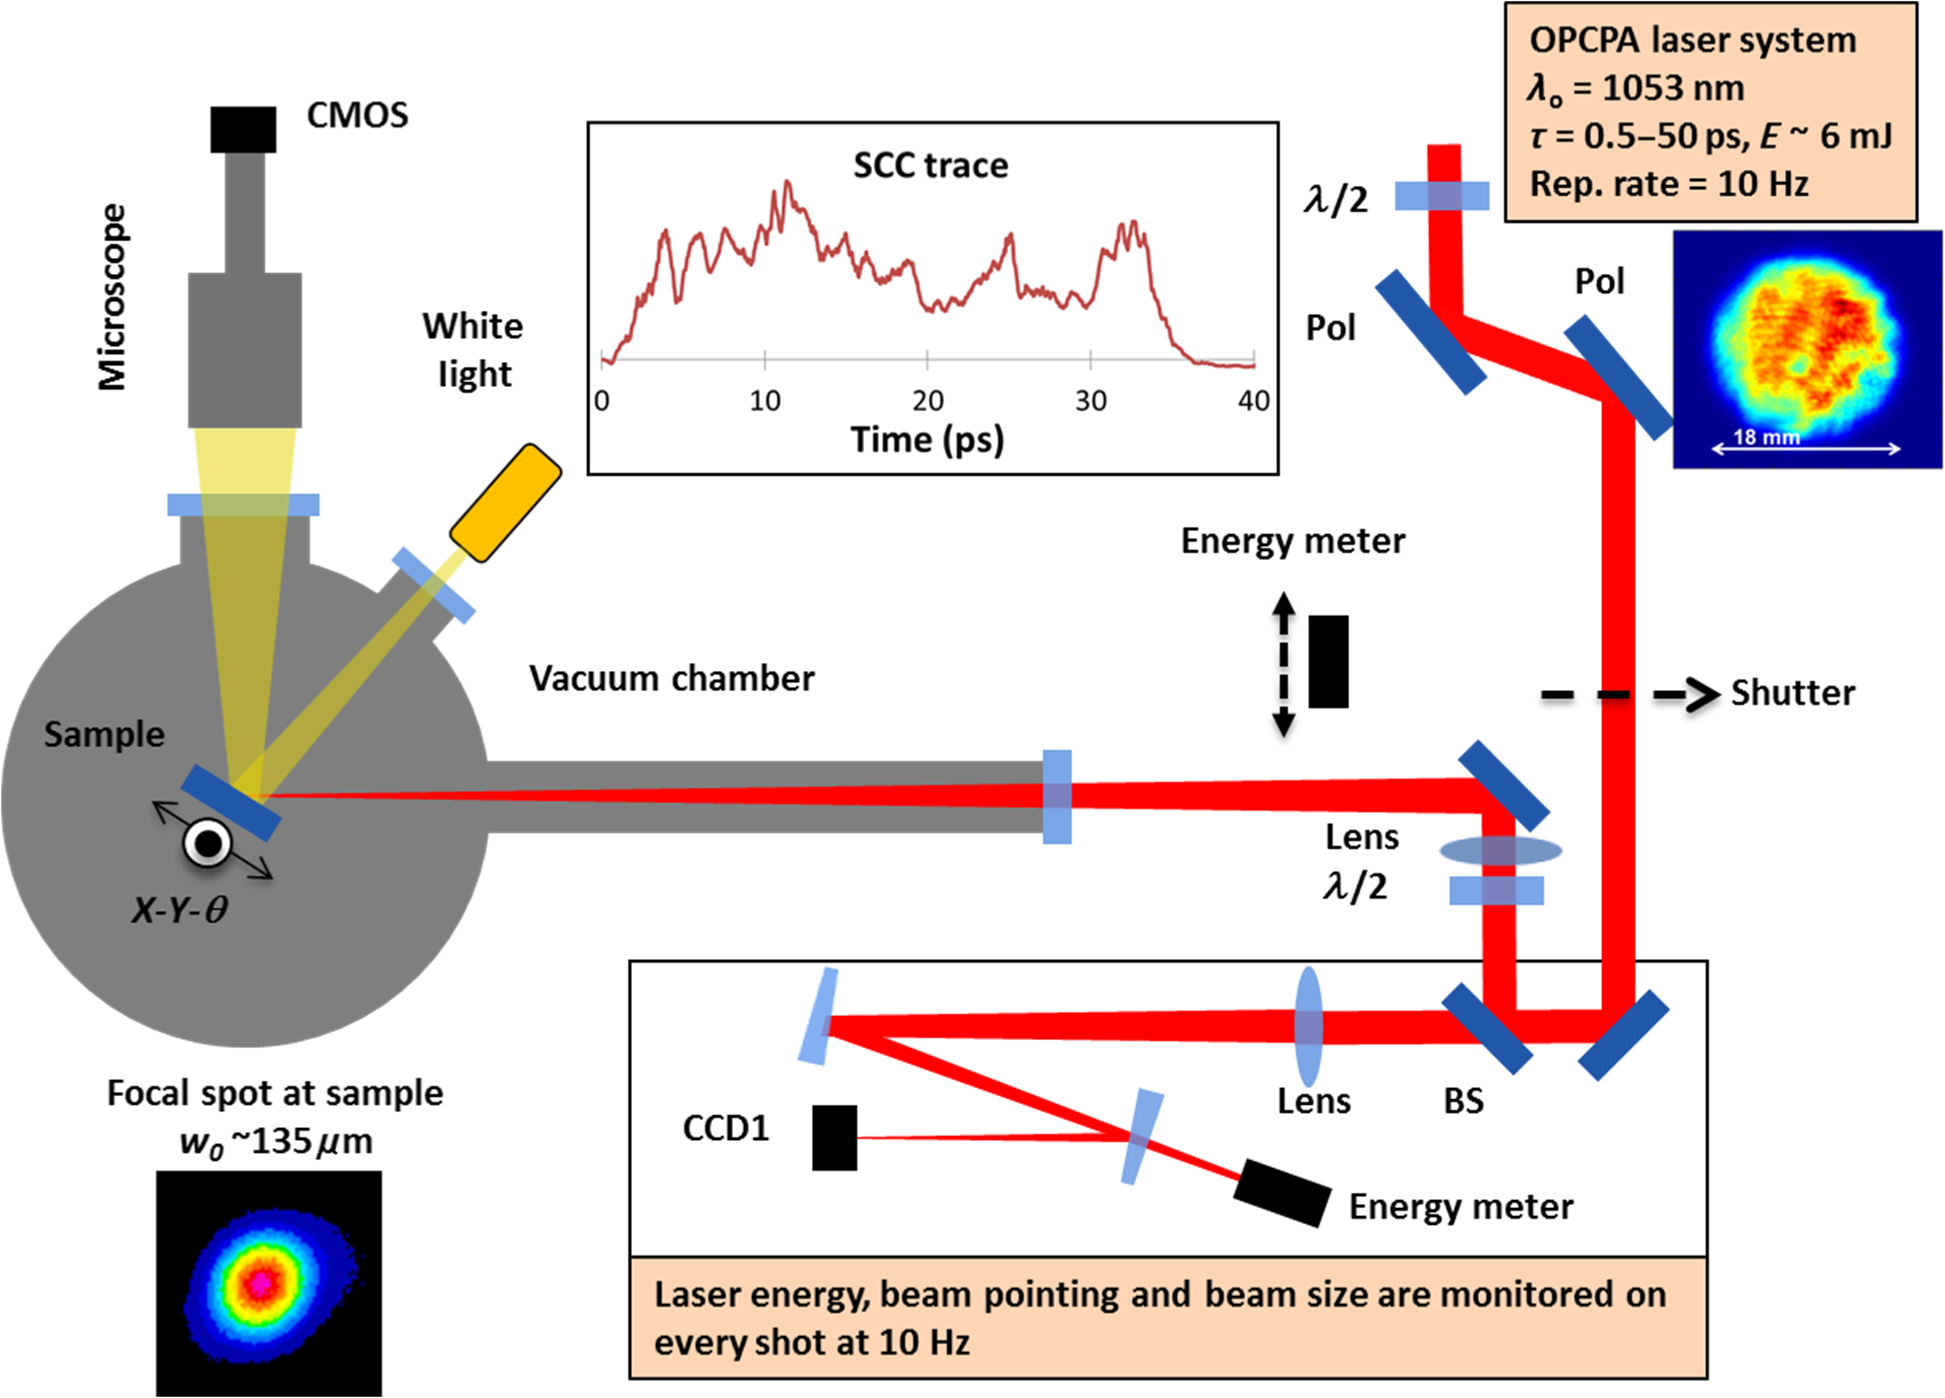 Most of the energy in the beam (95%) is directed toward the vacuum chamber through another half-wave plate (allows setting of S- or P-polarization per MLD coating design) and is focused at the sample plane inside the vacuum chamber via a 2-m focal length, antireflection (AR)-coated lens. The vacuum window is a 1-cm thick, fused silica parallel plate with AR coatings. Our optical system results in a beam waist at the sample plane of about (radius at of maximum intensity). The sample to be tested is mounted on vacuum compatible motorized translation stages and a manual rotation stage () at the vacuum chamber (60-cm diameter) center. In situ damage detection is achieved via a long working distance microscope equipped with a CMOS camera and a white light illumination fiber lamp through two independent ports of the vacuum chamber. The in situ microscope has a field of view of and spatial resolution on the order of . The pressure in the chamber can be varied from 1 atm (in-air, relative humidity of ) down to . Although past studies have examined the effects of pressure and vacuum cleanliness on the damage performance of MLD gratings,11 all tests discussed here were performed in a clean vacuum environment with pressures on the order of to . All coatings investigated in this work were deposited on 2-in. diameter, 0.5- to 1-cm-thick substrates and have been stored in dry atmosphere prior to their testing in vacuum for at least 48 h. The beam transmitted through the BS (5%) is used for diagnostics in a reference beam path to monitor both the beam energy and beam profile at an equivalent sample plane (in this case, at the center of the vacuum chamber). An identical 2-m lens focuses the low-energy reference beam, which is routed and attenuated using a couple of uncoated fused silica wedges (3 deg) to a charge-couple device (CCD1 in Fig. 1). As is the case for most far-field beam profile measurements using CCDs (here Basler model A102f, silicon sensor), additional neutral density filters are necessary to prevent damage to the camera sensor and maintain linearity of response in the ps-pulse regime. A reference energy meter (Coherent Inc., J-10MB-LE) is placed behind one of the wedges and is calibrated against the main energy meter (Coherent Inc., J-25MB-LE) temporarily inserted in the main beam path (see Fig. 1). The equivalent sample plane (i.e., position of CCD1) was determined in the commissioning phase of our damage test station by comparison to a second, identical CCD placed at the vacuum chamber center in-air. The latter allowed us to determine the optimal lens position in the main beam path such as the focal plane of the lens coincides with the center of the vacuum chamber where the test sample will be mounted. Following this alignment step, we then positioned the second (reference lens) at the same distance from the BS and set the position of CCD1 at its focal plane. By performing -scan (translation along the beam propagation direction) measurements, we confirmed that the position of the focal spot monitor (CCD1) is accurate within 1 to 2 mm of the actual sample plane. It should be noted that the Rayleigh range of the 2-m lens is about 2 cm. Due to the inherent shot-to-shot fluctuations of the OPCPA laser, the laser energy, beam pointing, and beam size need to be captured on every shot at 10 Hz. We developed a sophisticated data acquisition and controls system using LabVIEW to handle the beam diagnostics along with other tasks that need to be performed during damage tests, i.e., the number of shots delivered to the sample (via mechanical shutter), energy control via wave plate, sample navigation and in situ damage detection with image acquisition. The fluence at the sample plane on every shot is determined in two steps as follows. Prior to any damage test, we calibrate the reference energy meter by capturing the readings from both reference and main energy detectors along with reference beam profiles (CCD1) for a series of shots with different energy levels. We thus determine an energy calibration factor given by the ratio of energy readings. Second, we calibrate the beam profiles acquired by CCD1 based on the shot energy (equivalent to the total counts in the image of CCD1) and count histogram to derive the peak fluence. For all tests, we report the normal beam fluence (to the propagation direction) and quote the peak fluence at the 90% level (fraction of beam energy above 90% of peak count normalized to the corresponding area using a square pixel of ). Our fluence measurement uncertainties originate from energy meter and camera noise and amount to about error, whereas the accuracy of the absolute fluence calibration is within 5%. The latter was further confirmed by comparison with direct, in situ measurements of laser ablation spots on thin metallic films13 inside the vacuum chamber under similar test conditions to the MLD coatings of interest (e.g., air or vacuum, same pulse duration). 2.2.Damage Test ProceduresThe dominant mechanisms of damage (intrinsic or extrinsic) on MLD coatings in the ps-pulse regime will determine the type of measurement needed. If damage is driven by defects (extrinsic), the fluence at which damage onset is observed will depend on the test area.14,15 This effect can be easily understood, if we consider a sparse distribution of defects on the surface of an optic; the probability of encountering a defect will depend on the test area, i.e., higher for large-area beams leading to a perceived lower damage threshold compared to that obtained using a smaller area beam. The standard damage test methodologies (1/1, S/1, and R/1) using a small-area beam are often used due to easy access to table-top lasers and the simplicity of the tests. However, the sample area tested is on the order of and thus inadequate for assessing the damage performance of meter-sized optics. In addition, the comparison between different test facilities is often difficult due to the different laser-beam parameters involved. Therefore, these small beam tests provide qualitative results and are most useful in comparing samples within the same test facility, e.g., evaluation of different coating runs. Here, we use R/1 methodology to test the onset of catastrophic damage and isolated growth under simulated use conditions of representative MLD coatings used in large-aperture petawatt-class lasers. In Fig. 2(a), we illustrate a typical fluence ramp exposure at a single-site location, i.e., 10 shots per fluence step. The half-wave plate is advanced every 10 shots to increase the fraction of the beam energy directed toward the test sample. In situ inspection of the sample surface being irradiated is performed after each sequence of 10 shots. When damage is detected (defined as a visible change at the sample surface), the test is terminated and the highest fluence shot recorded during the last ramp step is used to construct the R/1 damage probability curve versus fluence, as shown in Fig. 2(b). The R/1 test measures the so-called laser-induced damage threshold (LIDT) and may include, by design, a laser conditioning effect due to the gradual increase in fluence at each test site; the statistics of LIDT are built by repeating the test at 20 or more different locations on the sample. It should be noted that due to shot-to-shot laser fluctuations and uncertainty in the exact shot (out of 10) that initiated laser damage, the damage site morphology varies somewhat and in most cases includes damage growth. If the starting locations chosen for R/1 tests are pristine, the results inform on the onset of catastrophic damage and provide an upper limit for the coating damage resistance. The same procedure is also useful in examining isolated locations on the sample where pre-existing (PE) flaws are observed, as is the case for -size defects found on MLD coatings, which are introduced during the manufacturing process. For this purpose, we use the in situ microscope to align a defect with the incident beam location and perform an R/1 test to assess whether or not those isolated defects are more prone to initiate damage and lead to damage growth upon multiple shot exposures compared to the pristine locations. We can detect the onset of damage growth and even quantify growth rate versus fluence by using more frequent in situ damage inspections in combination with modified fluence exposure sequences, e.g., fewer shots at each step, ramp-up fluence until damage initiation occurs followed by lower fluence and/or reduced fluence step afterward. Fig. 2(a) Typical 1053-nm, 30-ps laser exposure sequence during an R/1 test with 10 shots per fluence step of . (b) Nominal 20-site R/1 damage probability curve versus laser fluence. Each test location is inspected in situ (vacuum) every 10 shots; when a visible modification is detected, the test is terminated and damage is attributed to the highest peak fluence recorded at the last fluence step. 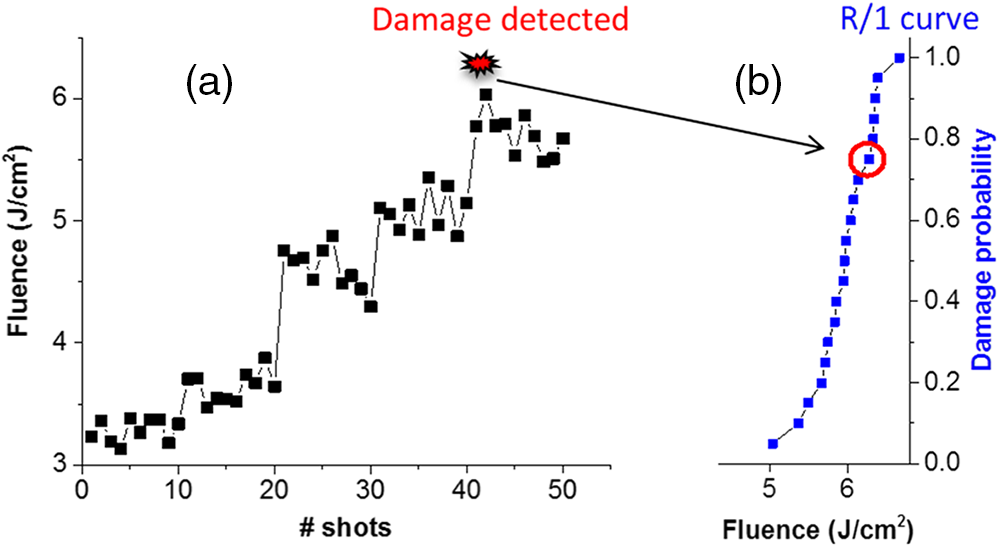 In recent years, there has been a shift in the damage test methodologies toward quantitative damage characterization techniques via damage density measurements or so-called tests, which can reveal the weakest locations on the sample surface, e.g., sparsely distributed defects that damage at lower fluences than the pristine areas and are thus limiting the optics performance.16 The tests sample areas on the order of and often require a large-area beam, are more time consuming and data analysis is complex. As presented in this study, without access to a large-aperture laser facility, which often implies low-repetition rates, such tests can be accomplished via raster scanning using a small-area beam from a table-top laser. Specifically, we simulate fluence coverage over a large area ( or more) by translating the sample at constant speed while the laser is free running at 10 Hz. The resulting fluence contrast at the target depends on the scan speed, the beam size, and repetition rate. For our specific system, we achieve coverage at the 80% or higher peak fluence with translating the sample between shots at 10 Hz. Several steps are involved in the raster scanning procedure and are illustrated in Fig. 3 as follows.
3.Results and DiscussionAs mentioned above, pulse compression, transport and focusing optics for high-energy, petawatt-class lasers rely on optical thin-film coatings operating in a vacuum environment. In addition to high damage resistance, the ability to scale the coating process to large substrates (for large-aperture lasers such as ARC), stringent wavefront and spectral requirements also play a role in the selection of optical coatings for these applications. Past experience from large-aperture laser systems (OMEGA EP, NIF, LMJ) showed MLD coatings consisting of hafnium dioxide and silicon dioxide () exhibit the best damage performance with good spectral and uniformity control.17–20 The e-beam deposition process is typically encouraged due to the flexibility in source materials and coating designs, and relatively low cost in addition to scalability. However, thin-film stresses resulting from the optical coating process, both compressive and tensile, pose a risk to the performance and longevity of the coated components. Specifically, e-beam coatings tend to exhibit high-tensile stresses (particularly on low thermal expansion substrates in dry environments), which could lead to significant substrate deformation and potentially cracking of the coated surface (crazing in vacuum environment).21 We set out to investigate the damage resistance of high-reflector MLD coatings manufactured by alternative deposition methods [e-beam versus plasma ion-assisted deposition (PIAD)] and coating materials (hybrid, in addition to ) while maintaining high damage resistance.22–25 For this purpose, we performed R/1 tests at pristine coating locations using 1053-nm, 30-ps pulses in vacuum on several mirror architectures, primarily a standard quarter-wave design for various angles of incidence (AOI) and use polarization. Results are shown in Fig. 4 and are representative of multiple samples of each coating type (from different coating runs, not all shown). Measurement errors are nominally . The data points at 0% damage probability for 58 deg, S-polarization high reflector indicate no damage up to , the maximum fluence currently available in our damage test setup. These results suggest that the damage performance (1) from densified coatings is lower compared to e-beam coatings for same use conditions, and (2) varies with AOI and polarization, with 45-deg P-reflectors being most challenging. The latter trends are in part correlated with the inverse dependence on AOI of the E-field distribution in the top layers and the increased penetration depth into the layer stack of P- versus S-polarized light and deserve further investigation using other coating designs and AOI. It should be noted that the damage resistance of pristine areas on all types of coatings illustrated in Fig. 4 is satisfactory in the context of typical average operational fluences for most petawatt-class lasers of to . However, as discussed later, other limiting factors need to be considered when evaluating the damage performance of large-area optics. Fig. 4The damage performance of various MLD coatings as a function of deposition methods (e-beam or PIAD), materials (alternating layers of , or layers distributed throughout the stack by replacing some of the layers), and architecture: (a) P-reflectors versus AOI and (b) S-reflectors versus AOI, respectively. All R/1 tests were performed in vacuum using 1053-nm, 30-ps pulses at the use polarization and AOI.  Although we have examined the damage performance over extended areas in all coating samples above using raster scanning, here we limit our discussion to one case study. Specifically, we present the test results and detailed characterization of laser-induced modifications (damage) from an e-beam HR coating designed for , P-pol (see Fig. 5, all results obtained in vacuum with 1053-nm, 30-ps pulses). Fig. 5(a) In vacuum, 1053-nm, 30-ps R/1 damage probability and damage density (defect driven, see text) measurements versus fluence in e-beam HR coating designed for , P-pol. (b) Ex situ optical microscope image of a region of the rastered area (contrast-enhanced) illustrating three types of laser-induced modifications observed in this coating sample: darkening of PE defects (black circles, Type I), onset of plasma scalding over extended areas (white regions, Type II), and pinpoint damage initiations (indicated by red arrows, Type III). 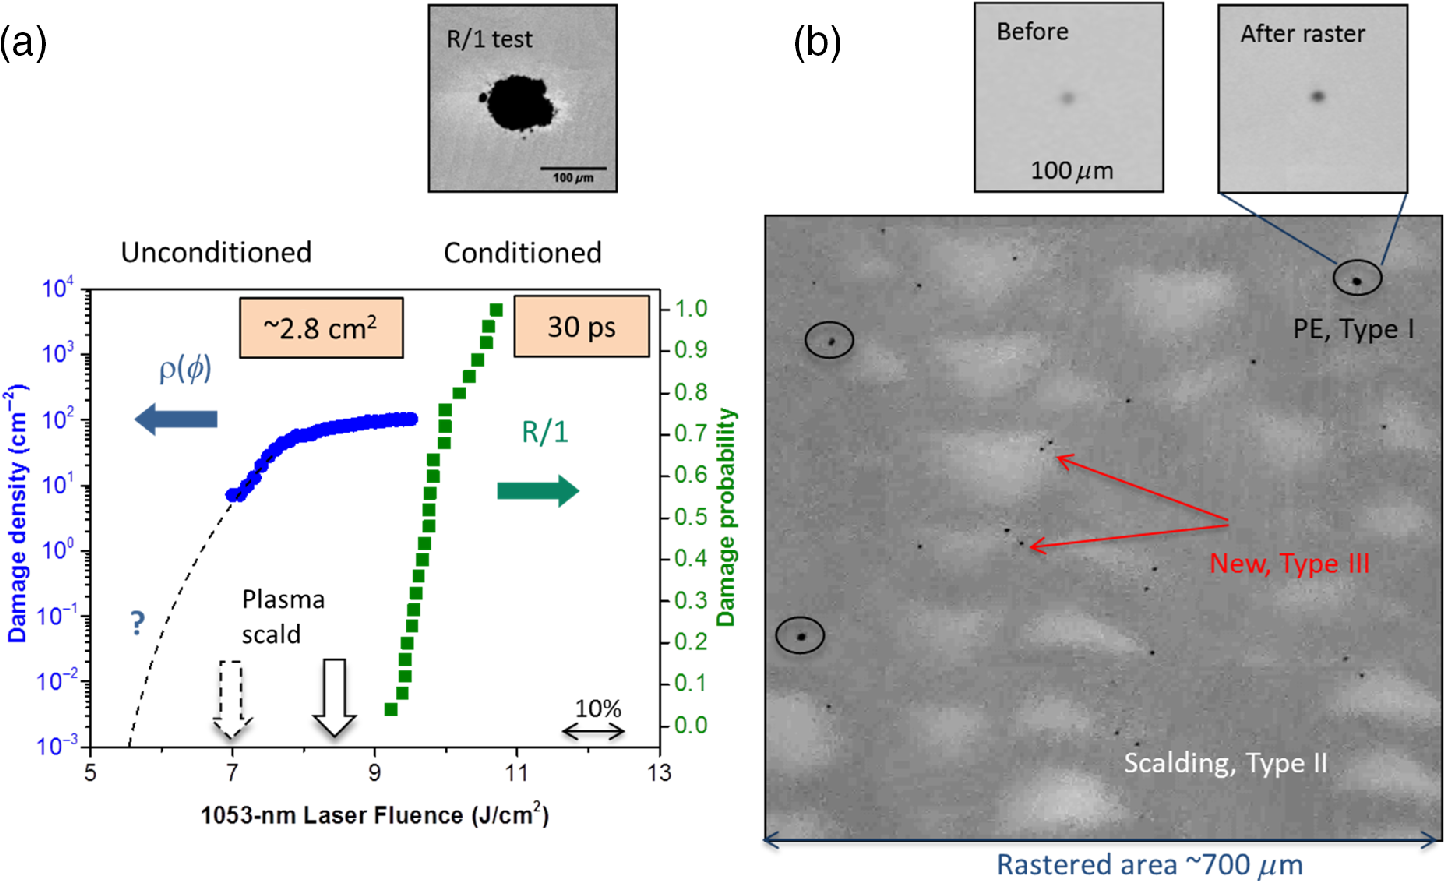 First, an R/1 test was performed at pristine coating locations. The onset of catastrophic damage to the coating was observed at about while the 50% damage probability fluence was as shown in Fig. 5(a). By design, the R/1 test provides an upper limit on the coating damage performance as the fluence is gradually increased at any given location and leads to laser conditioning of the irradiated area. We then used the minimum fluence of the R/1 curve to guide the optimal fluence for raster scanning at the next step, in this case between 7 and over multiple areas totaling up to . Note that irradiation at the raster scan fluences occurs primarily on pristine areas without prior exposure to lower fluences, therefore, these tests probe the damage performance of largely unconditioned coating material, in contrast to the R/1 tests above. Several types of laser-induced modifications (damage) were observed in the rastered area and are competing at these test fluences [see Fig. 5(b)]: (I) darkening of -size, PE coating defects (compared to their appearance before raster); (II) onset of plasma scalding over extended areas; (III) pinpoint damage initiations in the areas of Type II damage. Only Type I damage initiation was counted toward the damage density curve plotted in Fig. 5(a), however, we do not know if these sites will continue to evolve upon subsequent laser exposure. We hypothesize that Type I damage features represent ejection of nodular defects and may be stable up to a threshold irradiation fluence but grow in size at higher exposures (see additional tests below). This defect-driven curve saturates at higher fluences as all the isolated defects encountered in the tested area initiate ( on this sample) while its behavior at lower fluences is unknown. The dotted line in Fig. 5(a) represents an extrapolation to much lower damage densities of (relevant to large-area optics) based on the observation that no damage occurred over tested at 5.5 to . The onset of plasma scalding (Type II damage) in the raster areas over extended areas was observed at about . In contrast, scalding occurred at fluences above during R/1 tests due to laser conditioning effects associated with the latter test (see wide arrows in Fig. 5(a), dotted and solid lines for unconditioned versus conditioned coating material, respectively). Moreover, many damage pinpoints ( in size) were observed in the plasma scalded regions (Type III) but were not counted toward the damage density curve. While Type I damage at isolated coating defects may be acceptable for large-aperture lasers, Types II and III damage represent the onset of catastrophic failure of the coating over extended areas and should be avoided. The effectiveness of laser conditioning on all these types of damage warrants further examination in future work. The laser-induced modifications in the raster area are very subtle and not resolved by optical microscopy. SEM images of various test regions on the same coating sample are shown in Fig. 6. The catastrophic damage observed at R/1 sites is clearly a prominent central feature in Fig. 6(a) surrounded by scalding of the coating top layer, which extends radially out to , in agreement with the near-Gaussian beam profile. In contrast, the higher resolution image of a small area within the raster reveals two discrete, Type III damage initiations in a field of plasma scalding [see Fig. 6(b)]. Such small discrete features can be explained in the context of pulse scaling of damage initiation and growth as well as the limited number of laser exposures at any given location on the sample during the raster (compared to the R/1 test), i.e., long, ns pulses initiate larger damage sites, which can grow in larger quanta per shot compared to short, ps pulses.26–28 Fig. 6SEM imaging of (a) a typical R/1 site and (b) small area within a raster, which contains Type III damage on the same coating sample as in Fig. 5. Charging of the dielectric surface causes artificial contrast in these images. 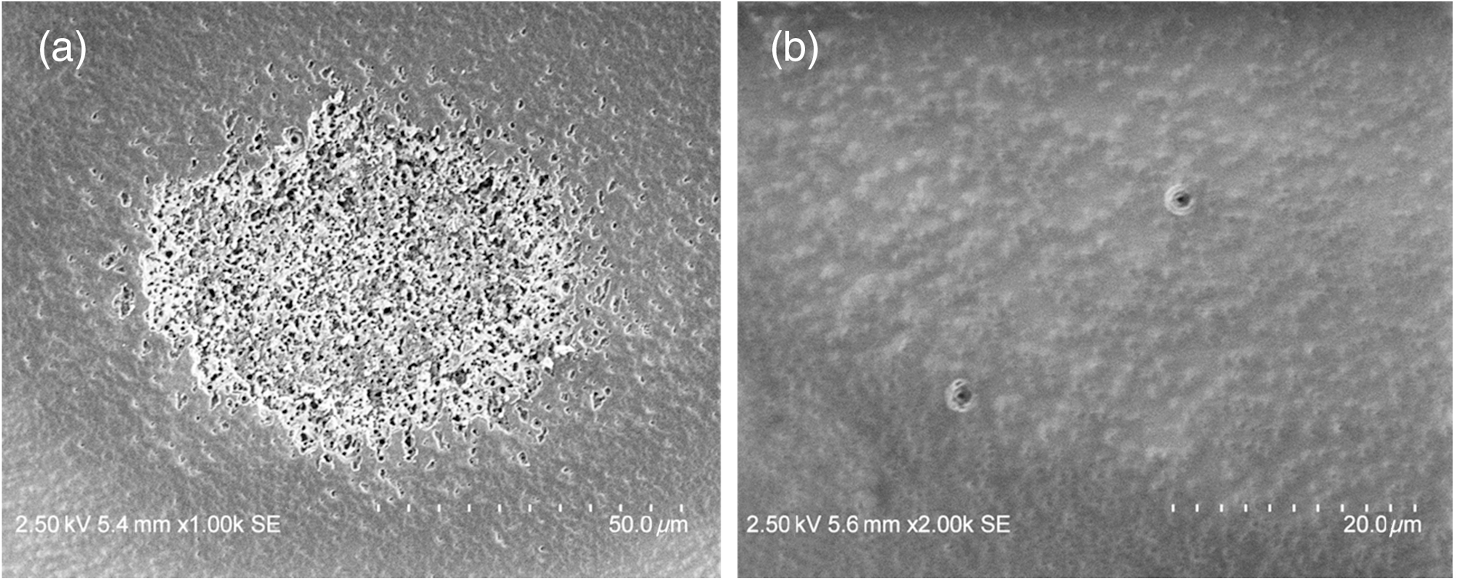 To address the question of whether or not these isolated initiation sites grow upon subsequent exposure, we employed R/1 methodology to target individual coating defects (on a different sample with the same coating design as that shown in Fig. 5) to test the onset fluence for damage growth under simulated use conditions (may include laser conditioning). We rely on the in situ microscope (detection limit of ) to detect and quantify changes at defect locations upon laser exposure in vacuum; as such, each test location was exposed to 50 laser shots at each fluence step with inspections every 10 shots. Most growth tests were limited to about 200 shots to maintain a small site diameter compared to the beam area (ideally, damage growth experiments are conducted under flooded fluence conditions using a large-area beam28). The growth rate measurements using a small, Gaussian beam are most meaningful within the central area associated with its peak fluence. As the site continues to grow from several microns to tens of microns in diameter, its area is exposed to a strong gradient of fluence and growth at the site periphery slows down compared to its center. More involved test procedures can be designed to overcome these limitations, such as successive raster scans over 1 to area containing the defect with increasing fluence. The results are presented in Figs. 7(a) and 7(b). A typical growth sequence with site diameter (ECD, in , black circles) and laser exposure fluence at 1053-nm, 30 ps pulses (blue dots, lines indicate average fluence at each step) versus number of shots is shown in Fig. 7(a). In addition, several in situ images of the tested area captured every 50 shots are included to illustrate the evolution of the defect site size with laser exposures. The pre- and post-test ex situ inspection images reveal the damage site morphology with resolution for comparison to in situ inspections. No significant changes in the site size were observed at exposure fluences below . Upon increasing the fluence exposure, the damage site increases in size at a slow rate and growth appears to be sustained beyond shot 90. The onset of damage growth is thus assigned to the highest peak fluence during the previous 10 shots (80 to 90) and is used to construct the R/1 damage probability curve due to PE defects (dotted arrow). The test was repeated at multiple defect locations to build statistics and the results are shown in Fig. 7(b) as follows: R/1 curve for defects to be compared with the R/1 curve obtained at pristine coating locations (red stars and green squares, respectively) and the low-fluence tail of the damage density curve (dotted blue line), all measured on the same coating sample. The general observations regarding damage growth at isolated defect locations on the coating at 50 deg, P-pol, 30-ps pulses in vacuum can be summarized as follows.
Fig. 7(a) A typical damage growth sequence using 30-ps, 1053-nm pulses in vacuum at a PE coating defect location on the coating. In situ microscope images reveal the onset of sustained growth after shots and provide estimates of growth rate. (b) Damage probability curves via R/1 tests measured from this coating sample at pristine (green squares) and defect (red stars) locations, respectively. The low-fluence tail of the damage density curve is also shown for comparison (dotted blue line). 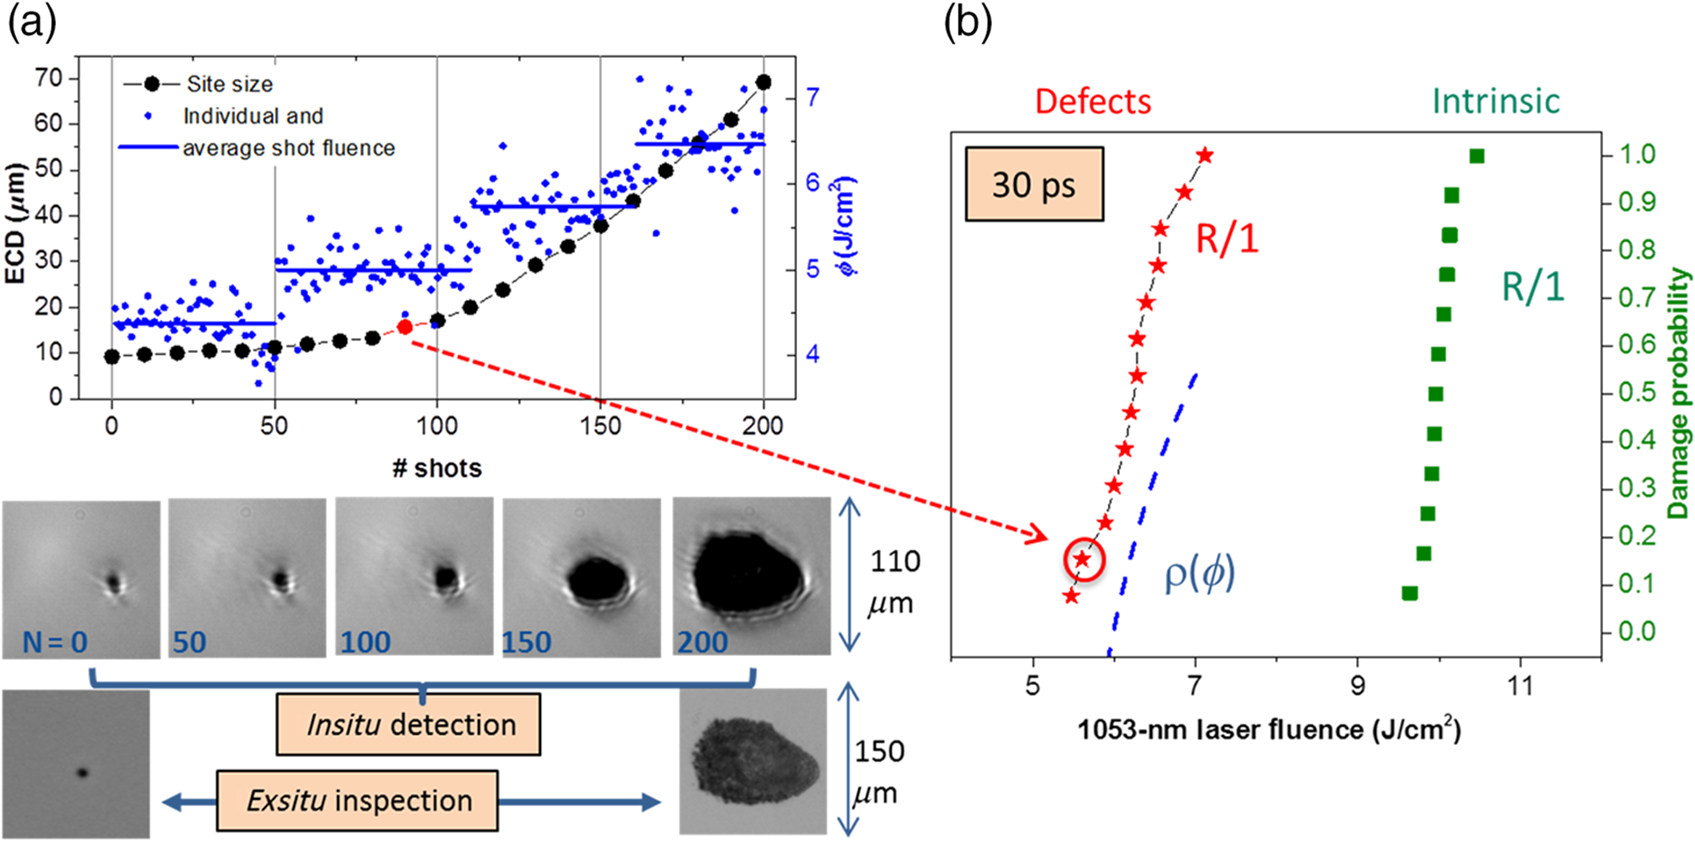 Next, we will use the coating as a case example to estimate the impact of various sources of damage on the performance of large-area coated optics under multiple laser exposures. For this exercise, we extend the damage density versus fluence curve over a larger range of laser fluences based on the observed damage behaviors in Figs. 5–7. Namely, the defect-driven can be approximated by a power law (coefficient ) with onset at followed by saturation beyond as all PE defects present on the optic have initiated damage [dotted blue line in Fig. 8(a)]. Next, we make use of the R/1 damage probability and its fluence span to simulate equivalent damage densities at these higher test fluences as follows: the curve is stretched vertically such that the 0% probability coincides to the saturation density level of the while the 100% probability corresponds to an arbitrary high damage density, i.e., and , respectively [dotted green line in Fig. 8(a)]. It can be seen that the latter addition to the damage density curve is extremely steep as it represents the onset of catastrophic failure in the pristine coating. This last step is of particular value if the laser system for which damage performance is being estimated has significant contrast on its beam. We now have a mathematical construct to approximate the damage initiation density for arbitrary fluences. Several prediction values (solid data points) are noted in Fig. 8(a). In addition, we have observed a slow, fairly constant rate of increase in the site diameter under multiple, 30-ps laser exposures [see Fig. 7(a)]. Let us also assume a simplified fluence dependence to the growth rate per 50 shots as follows: 20, 30, and for three different fluence ranges, 5.5 to , 7 to , and 8.5 to , respectively. Fig. 8(a) Approximated damage density versus fluence (see text for details) over a larger range of laser fluences for the coating to include damage from multiple sources: isolated coating defects [defect-driven , dotted blue line] and pristine coating failure (catastrophic damage via R/1 testing, dotted green line). The damage density predictions for selected fluences (solid data points) are also shown. (b) Percent of beam area obscuration versus number of shots at constant fluences using the damage density prescribed in Fig. 8(a) and the estimated growth rates with 30-ps pulses. 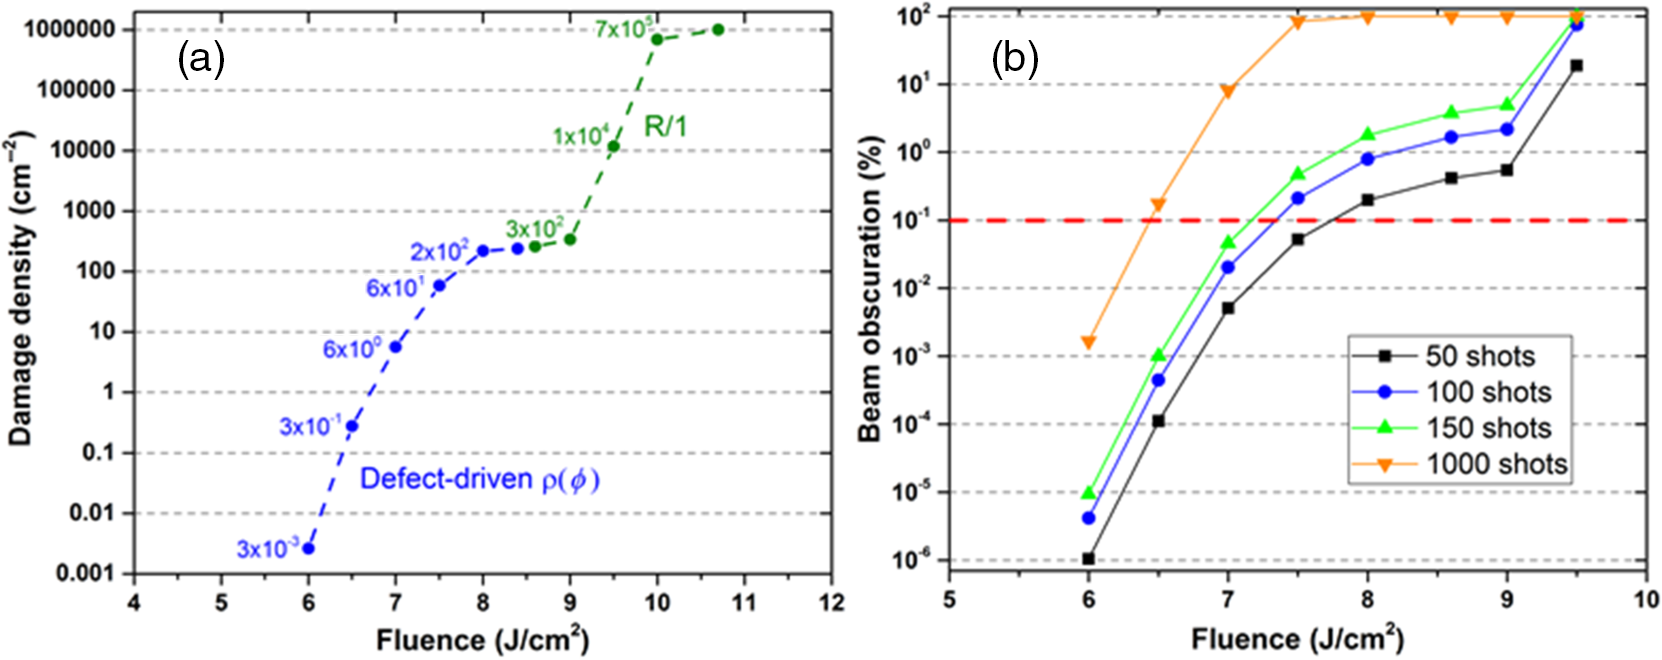 We can now estimate the percentage of beam area obscuration (due to sizable damage sites) versus number of shots at constant fluence as: . This quantity is plotted in Fig. 8(b), where 100% value on the -axis corresponds to the entire optic being damaged. A beam obscuration up to about 0.1% [dotted red line in Fig. 8(b)] is typically acceptable for large-aperture, low-repetition rate petawatt-class lasers. This relaxed constraint combined with anticipated average operational fluences below suggests that damage initiation and growth due to isolated coating defects will not curtail the lifetime of optical components for years of laser operation. However, other types of damage precursors, such as particulate contaminants in the beamline31 and plasma scalding over large areas, along with high-beam contrast (static and dynamic) and shorter pulse duration could accelerate the degradation of the optics. These issues and required mitigation methods will be addressed in future studies. 4.SummaryWe described a vacuum damage test capability to examine MLD coatings performance under conditions similar to those present on ps, petawatt-class lasers. Small beam (R/1) testing was employed to test intrinsic damage thresholds of optical coatings of various architectures and use conditions. Raster scanning over revealed damage onset at isolated defects for all MLD coatings tested here, i.e., the use fluence is limited by damage of extrinsic precursors. The two techniques are complementary in that the small beam test allows both the laser designer to select the best MLD architecture for a particular use condition and the experimenter to determine what fluence to conduct the raster test at, whereas the raster technique provides information about how a given run of material will actually perform and helps establish safe operational limits for the laser. AcknowledgmentsThe authors would like to acknowledge the Laboratory for Laser Energetics (LLE) of the University of Rochester for manufacturing of the coating samples used in this study and to thank A. L. Rigatti and J. B. Oliver for helpful advice and expertise during the coating selection process. This work was performed under the auspices of the U.S. Department of Energy (DOE) by Lawrence Livermore National Laboratory under Contract DE-AC52-07NA27344. They would also like to acknowledge funding from Laboratory Directed Research and Development under Grant No. 14-ERD-014. ReferencesC. Danson et al.,
“Petawatt class lasers worldwide,”
High Power Laser Sci. Eng., 3 e3
(2015). http://dx.doi.org/10.1017/hpl.2014.52 2095-4719 Google Scholar
R. R. Gattass and E. Mazur,
“Femtosecond laser micromachining in transparent materials,”
Nat. Photon., 2 219
–225
(2008). http://dx.doi.org/10.1038/nphoton.2008.47 NPAHBY 1749-4885 Google Scholar
X. Liu, D. Du and G. Mourou,
“Laser ablation and micromachining with ultrashort laser pulses,”
IEEE J. Quantum Elect., 33 1706
–1716
(1997). http://dx.doi.org/10.1109/3.631270 Google Scholar
J. W. Dawson et al.,
“High average power lasers for future particle accelerators,”
in AIP Conf. Proc.,
147
–153
(2012). http://dx.doi.org/10.1063/1.4773687 Google Scholar
S. M. Hooker,
“Developments in laser-driven plasma accelerators,”
Nat. Photon., 7 775
–782
(2013). http://dx.doi.org/10.1038/nphoton.2013.234 NPAHBY 1749-4885 Google Scholar
C. Benedetti et al.,
“Plasma wakefield driven by an incoherent combination of laser pulses: a path towards high-average power laser-plasma accelerators,”
Phys. Plasmas, 21 056706
(2014). http://dx.doi.org/10.1063/1.4878620 PHPAEN 1070-664X Google Scholar
M. Borghesi et al.,
“Laser-driven proton acceleration: source optimization and radiographic applications,”
Plasma Phys. Controlled Fusion, 50 124040
(2008). http://dx.doi.org/10.1088/0741-3335/50/12/124040 Google Scholar
B. C. Stuart et al.,
“Nanosecond-to-femtosecond laser-induced breakdown in dielectrics,”
Phys. Rev. B, 53 1749
–1761
(1996). http://dx.doi.org/10.1103/PhysRevB.53.1749 Google Scholar
J. M. D. Nicola et al.,
“The commissioning of the advanced radiographic capability laser system: experimental and modeling results at the main laser output,”
Proc. SPIE, 9345 93450I
(2015). http://dx.doi.org/10.1117/12.2080459 PSISDG 0277-786X Google Scholar
C. Haefner et al.,
“Performance measurements of the injection laser system configured for picosecond scale advanced radiographic capability,”
J. Phys. Conf. Ser, 244 032005
(2010). http://dx.doi.org/10.1088/1742-6596/244/3/032005 JPCSDZ 1742-6588 Google Scholar
D. A. Alessi et al.,
“Picosecond laser damage performance assessment of multilayer dielectric gratings in vacuum,”
Opt. Express, 23 15532
–15544
(2015). http://dx.doi.org/10.1364/OE.23.015532 OPEXFF 1094-4087 Google Scholar
I. Jovanovic et al.,
“Precision short-pulse damage test station utilizing optical parametric chirped-pulse amplification,”
Rev. Sci. Instrum., 75 5193
(2004). http://dx.doi.org/10.1063/1.1819382 RSINAK 0034-6748 Google Scholar
I. L. Bass et al.,
“‘Metallic burn paper’ used for in situ characterization of laser beam properties,”
Appl. Opt., 55 3131
–3139
(2016). http://dx.doi.org/10.1364/AO.55.003131 APOPAI 0003-6935 Google Scholar
M. D. Feit et al.,
“Extrapolation of damage test data to predict performance of large-area NIF optics at 355 nm,”
Proc. SPIE, 3578 1
–9
(1999). http://dx.doi.org/10.1117/12.344413 PSISDG 0277-786X Google Scholar
T. A. Laurence et al.,
“Extracting the distribution of laser damage precursors on fused silica surfaces for 351 nm, 3 ns laser pulses at high fluences (),”
Opt. Express, 20 11561
–11573
(2012). http://dx.doi.org/10.1364/OE.20.011561 OPEXFF 1094-4087 Google Scholar
C. W. Carr et al.,
“Techniques for qualitative and quantitative measurement of aspects of laser-induced damage important for laser beam propagation,”
Meas. Sci. Technol., 17 1958
–1962
(2006). http://dx.doi.org/10.1088/0957-0233/17/7/039 MSTCEP 0957-0233 Google Scholar
J. B. Oliver et al.,
“High precision coating technology for large aperture NIF optics,”
in Optical Interference Coatings,
(2001). http://dx.doi.org/10.1364/OIC.2001.ThD2 Google Scholar
J. Oliver et al.,
“Thin-film polarizers for the OMEGA EP laser system,”
Proc. SPIE, 5991 599119
(2005). http://dx.doi.org/10.1117/12.638809 PSISDG 0277-786X Google Scholar
J. B. Oliver et al.,
“Optimization of laser-damage resistance of evaporated hafnia films at 351 nm,”
Proc. SPIE, 7132 71320J
(2008). http://dx.doi.org/10.1117/12.805383 PSISDG 0277-786X Google Scholar
B. Pinot et al.,
“Laser megajoule mirrors production with very high laser damage threshold,”
Proc. SPIE, 4679 234
–241
(2002). http://dx.doi.org/10.1117/12.461687 PSISDG 0277-786X Google Scholar
H. Leplan et al.,
“Residual stresses in evaporated silicon dioxide thin films: correlation with deposition parameters and aging behavior,”
J. Appl. Phys., 78 962
–968
(1995). http://dx.doi.org/10.1063/1.360290 JAPIAU 0021-8979 Google Scholar
D. J. Smith et al.,
“Low stress ion-assisted coatings on fused silica substrates for large aperture laser pulse compression grating,”
Proc. SPIE, 7132 71320
(2008). http://dx.doi.org/10.1117/12.817336 PSISDG 0277-786X Google Scholar
E. Lavastre et al.,
“Polarizers coatings for the Laser MegaJoule prototype,”
in Optical Interference Coatings,
(2004). http://dx.doi.org/10.1364/OIC.2004.TuF3 Google Scholar
J. B. Oliver et al.,
“Modification of stresses in evaporated hafnia coatings for use in vacuum,”
in Optical Interference Coatings,
(2010). http://dx.doi.org/10.1364/OIC.2010.WD6 Google Scholar
J. B. Oliver et al.,
“Stress compensation in hafnia/silica optical coatings by inclusion of alumina layers,”
Opt. Express, 20 16596
–16610
(2012). http://dx.doi.org/10.1364/OE.20.016596 OPEXFF 1094-4087 Google Scholar
C. W. Carr et al.,
“The effect of laser pulse shape and duration on the size at which damage sites initiate and the implications to subsequent repair,”
Opt. Express, 19 A859
–A864
(2011). http://dx.doi.org/10.1364/OE.19.00A859 OPEXFF 1094-4087 Google Scholar
C. W. Carr, J. B. Trenholme and M. L. Spaeth,
“Effect of temporal pulse shape on optical damage,”
Appl. Phys. Lett., 90 041110
(2007). http://dx.doi.org/10.1063/1.2431705 APPLAB 0003-6951 Google Scholar
R. A. Negres et al.,
“Growth behavior of laser-induced damage on fused silica optics under UV, ns laser irradiation,”
Opt. Express, 18 19966
–19976
(2010). http://dx.doi.org/10.1364/OE.18.019966 OPEXFF 1094-4087 Google Scholar
X. Cheng et al.,
“Nanosecond laser-induced damage of nodular defects in dielectric multilayer mirrors [Invited],”
Appl. Opt., 53 A62
–A69
(2014). http://dx.doi.org/10.1364/AO.53.000A62 APOPAI 0003-6935 Google Scholar
X. Cheng et al.,
“The effect of an electric field on the thermomechanical damage of nodular defects in dielectric multilayer coatings irradiated by nanosecond laser pulses,”
e80
(2013). http://dx.doi.org/10.1038/lsa.2013.36 Google Scholar
S. R. Qiu et al.,
“Impact of laser-contaminant interaction on the performance of the protective capping layer of 1ω high-reflection mirror coatings,”
Appl. Opt., 54 8607
–8616
(2015). http://dx.doi.org/10.1364/AO.54.008607 APOPAI 0003-6935 Google Scholar
BiographyRaluca A. Negres has been a staff scientist at Lawrence Livermore National Laboratory (LLNL) since 2007. Her research interests include laser–matter interactions and optical materials characterization, time-resolved imaging, ultrafast laser systems, and statistical modeling. Christopher J. Stolz has been in the laser program at LLNL since 1989 researching high-power laser coatings. He is currently responsible for the Optics Production Group for the National Ignition Facility. He has served as a cochair or program chair for numerous conferences including laser-induced damage in optical materials and optical interference coatings. He has coauthored over 90 journals and proceeding articles and two book chapters. |