|
|
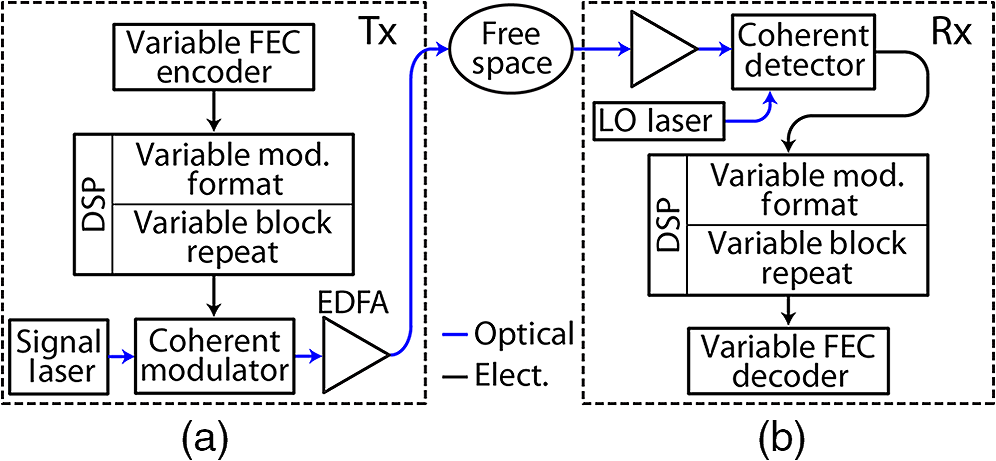
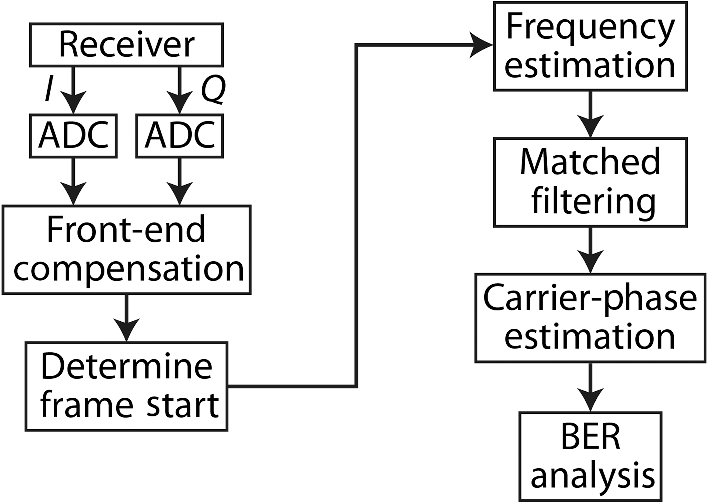
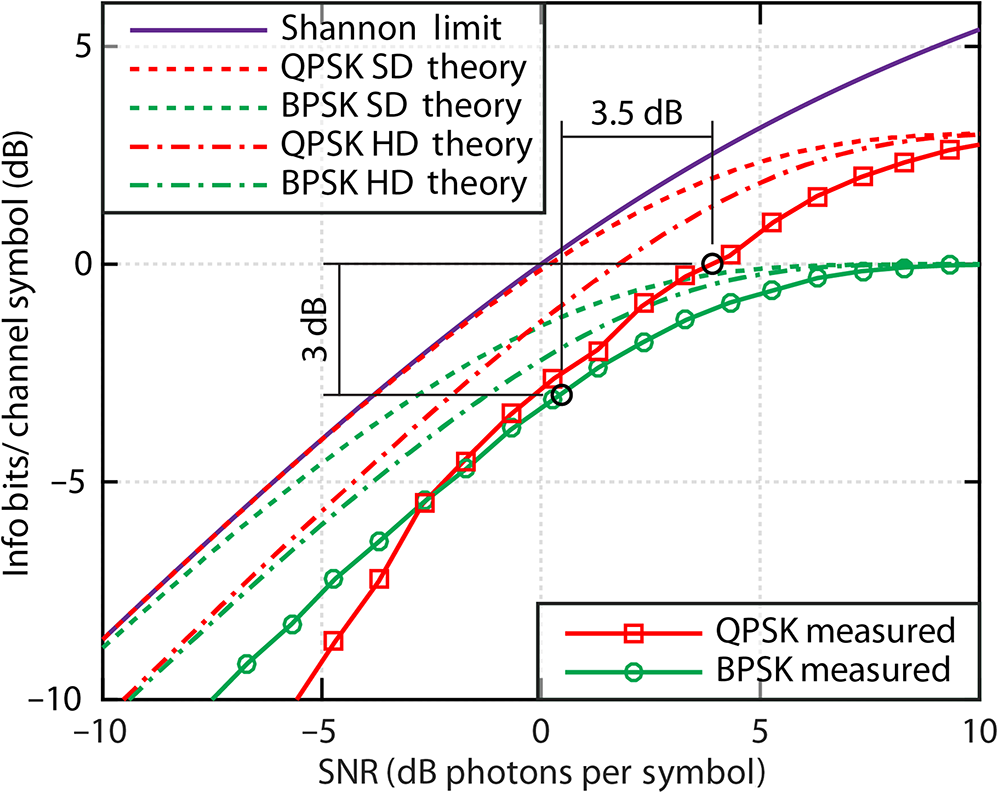
1.IntroductionFuture space-based free-space optical (FSO) communication systems will need to support a wide diversity of missions.1–4 For example, terminals located in Earth orbit could support data links with user rates in the 10’s to 100’s of Gb/s.5 Other links operating at greater distances may be required to provide significantly lower rates to contend with the concomitant increase in link loss. Designing a specialized terminal pair optimized for each use case is a potential path to supporting this variety of missions; however, it would involve costly custom hardware development for each scenario. As an alternative approach, a modem design that can operate at high rates when losses are small and then fall back to lower rates as losses increase (e.g., as the link reach is extended) enables a single hardware architecture that can a support a wide range of mission requirements. In the context of this paper, this trade-off is referred to as “rate scaling.” Wide dynamic-range data-rate scaling ( range of data rates) is difficult to achieve with a single hardware architecture while maintaining excellent sensitivity and minimizing the size, weight, and power (SWaP) on the space platform. An obvious means for rate scaling is to change the system baud rate. This technique, however, is impractical in implementation due to hardware limitations, such as the need to perform clock recovery or filtering efficiently over a wide range of data rates. Many other rate scaling techniques exist that can operate with a fixed system baud rate. For example, a fixed bandwidth transmission system can change its modulation format to either maximize or minimize the spectral efficiency, which in turn leads to variations in data rate. It is also possible to use forward error correction (FEC) to take advantage of the fact that lower FEC code rates can operate error-free at lower SNRs, albeit at lower information data rates due to the increased overhead. Additionally, a transmission system can repeat a block of channel symbols to lower the data rate while maintaining a constant channel symbol rate. Existing approaches to rate scaling with sensitive performance generally cover a range of data rates and use custom optical modems for each specific mission scenario (e.g., Refs. 67.8.9.10.–11). One approach uses pulse-position modulation (PPM), which has been demonstrated experimentally to achieve sensitivities within 1-dB of theory.6 Experimental demonstrations using PPM with variable slot rates and variable number of slots achieved a 12-dB range of data rates from 38 to with sensitivity performance less than 1.1-dB from PPM theory.6,7 Other approaches use burst-rate differential phase-shifted keying (DPSK) to achieve rate scaling by varying the signal duty cycle over a 16-dB range of data rates from to .8,9 Another experimental demonstration using burst-rate DSPK achieved a 30-dB range of data rates from to while maintaining sensitivity performance within 1.0-dB of DPSK theory.10 The lower bound on data-rate scaling for PPM and burst-rate DPSK systems is governed by nonlinear impairments that arise when low duty-cycle signals are introduced to a high-power optical amplifier.10 Systems employing 100% duty cycle waveforms can further extend data-rate scaling. M-ary frequency shift keying (FSK) has also been demonstrated as a technique capable of achieving sensitivities within 1.5 dB of FSK theory while enabling rate scaling from Mb/s to Gb/s using custom receiver architecture.11 Recent advances by the fiber telecom industry have resulted in the development of high-rate high-sensitivity digital coherent communication systems. Essentially, these are software-defined communication systems that employ full-field (i.e., in-phase and quadrature-phase) transmission and reception using multibit digital-to-analog converters (DACs) at the transmitter and multibit ADCs at the receiver, along with digital signal processing (DSP). Coherent transmission systems are unique in that they have the best theoretical sensitivity in the bandwidth-limited regime.12,13 Experimental demonstrations using digital coherent receivers to detect the full field of the optical waveform have achieved sensitivities of 2 to 3 dB photons-per-bit (PPB) at multi-gigabit data rates.14,15 The number of PPB required to achieve error-free performance after FEC is the definition of receiver sensitivity. A summary of published results reporting sensitive optical communication performance has been assembled in Ref. 16. An FSO communications architecture based on a coherent transmission system has the potential to employ several techniques for achieving efficient data-rate scaling while maintaining excellent sensitivity. For example, a coherent transmission system can vary the modulation format to take advantage of higher spectral efficiency modulation formats when there is sufficient SNR at the receiver, or switch to lower spectral efficiency modulation formats that may have improved sensitivity in cases of lower SNR at the receiver. In particular, switching between binary phase-shifted keying (BPSK) and quaternary phase-shifted keying (QPSK) enables maintaining sensitivity in terms of PPB while allowing for twice the data rate when employing QPSK over BPSK. It is also possible for a coherent communication system to use FEC to take advantage of the fact that lower FEC code rates can operate error free at lower SNRs, albeit at lower information data rates due to the increased overhead.17 In particular, an experimental demonstration achieved 8.7-PPB at using a real-time DPSK lasercom system with a hard-decision, Reed-Solomon (255,239) FEC code.18 Leveraging more powerful 25% overhead block turbo codes with soft-decision decoding at in a real-time DPSK system improved error-free sensitivity to 7-PPB.19 Using offline DSP coherent receiver systems, recent demonstrations have made further sensitivity improvements. For example, hybrid PPM formats can achieve 2.7-PPB at , and 3.5-PPB at at bit error rate (BER), the error-free threshold for enhanced 7% overhead FEC.20 By leveraging the software-defined nature of digital coherent communication systems, it is possible to have a single architecture that can variably adjust the FEC code rate depending on link conditions. Coherent communications architectures also support efficient repeat codes. Experimental demonstrations have already shown that rate scaling using incoherent combining with preamplified receivers can only achieve a theoretical 1.5-dB signal-to-noise ratio (SNR) improvement for every doubling of the number of block repeats.9 Systems using incoherent combining with photon-counting receivers can achieve a 3-dB SNR improvement for each doubling of the number of block repeats but are limited to maximum data rates of 2,7 by current detector technology. Alternatively, coherent combining with preamplified receivers can double the SNR for each doubling of the number of block repeats.21 Recent experimental demonstrations have also shown the practical viability of the 3-dB SNR improvement by coherently combining a common block of data received by parallel receivers (i.e., spatial coherent combining).22 Using block repeating and coherent combining does not impose a fundamental architecture limitation to the lowest achievable data rate. However, there are practical limits that will ultimately be reached due to implementation effects (e.g., laser linewidth), clock instability, and other sources of phase noise or channel effects (e.g., atmospheric coherence time). In this paper, we report experimental results of a few rate-scaling techniques in a coherent system. Section 2 discusses efficient data-rate scaling with a coherent architecture using variable modulation formats, variable FEC code rates, and a variable number of block repeats that are coherently combined. Section 3 presents experimental results of data-rate scaling for switching between QPSK and BPSK modulation formats. Section 4 discusses experimental results for data-rate scaling obtained by changing the FEC code rate from rate- to rate-. Section 5 summarizes experimental results for using block repeating and coherent combining to achieve data-rate scaling. Section 6 concludes the paper with a summary of observed performance of all the rate-scaling approaches investigated. 2.Coherent Architectures for Efficient Data-Rate ScalingCoherent communication system architectures enable full-field modulation at the transmitter and full-field detection at the receiver. This can be accomplished by using an in-phase and quadrature-phase modulator (IQM) at the transmitter and a digital coherent receiver based on a 90-deg optical hybrid at the receiver. Coherent communication systems benefit from DSP at both the transmitter and receiver, which replace inflexible analog circuitry. For example, DSP enables dynamically changing modulation formats, the FEC code rate, or the number of times a sequence of data bits is repeated. These specific DSP operations are advantageous since they allow a tradeoff between achievable data rate and required SNR at the receiver for error-free performance. Figure 1 shows a generalized coherent communication system architecture that supports variably changing modulation format, FEC code rate, and number of block repeats. Recent results have shown preamplified digital coherent receivers to achieve excellent sensitivity ( from theory) over dynamic range.14,15 It is important to optimize the tradeoff between the resulting spectral efficiency and sensitivity for the desired application. In this way, the communication system architecture can maximize spectral efficiency while ensuring error-free communication. In this paper, the term “channel symbols” refers to the transmitted symbols over the link at a certain baud rate while “information bits” refer to the effective user data bits. In this way, the channel symbols include overhead from the use of FEC or repeat codes. The ratio of information bits to channel symbols is the spectral efficiency, which can also be represented as the product of the FEC code rate and the number of bits/symbol of the modulation format. The effective information rate is then given by the product of baud rate and spectral efficiency. The received power at the receiver necessary to achieve error-free performance for a desired FEC code rate and modulation format can be specified as a minimum number of PPB (i.e., sensitivity). The number of photons-per-symbol (PPS), the product of PPB and spectral efficiency, is another useful metric for comparing the data-rate scaling between different techniques. In a shot-noise-limited coherent heterodyne receiver, the number of PPS is equivalent to the SNR. 2.1.Variable Modulation FormatThe ability to change the modulation format enables optimizing the choice of modulation to maximize spectral efficiency or sensitivity for a given system. In particular, at a constant data rate, QPSK has twice the spectral efficiency of BPSK but requires twice the number of PPS. Figure 2 shows that changing the modulation format from QPSK to BPSK results in lowering the required PPS by 3 dB while also reducing the data rate by 3 dB. A specific advantage of using QPSK and BPSK modulation formats is that switching between these two formats preserves the theoretical sensitivity in terms of PPB. It is possible to include higher-order modulation formats, such as M-QAM or M-PSK, in the modulation format scheme for systems with sufficient SNR. However, higher-order modulation formats require more than a 3-dB SNR increase for every 3-dB increase in data rate for a fixed channel BER tolerance, which is not desirable for typically power-starved FSO systems. Fig. 2Spectral efficiency versus SNR required for error-free communication when switching modulation formats between QPSK and BPSK and using rate- FEC. The Shannon limit is defined as the capacity limit when using a preamplified coherent receiver with soft-decision FEC. The QPSK and BPSK theory curves are the capacity limits for soft-decision preamplified coherent detection of QPSK and BPSK, respectively. SD: soft-decision. HD: hard-decision.  Changing modulation formats between BPSK and QPSK can be achieved by switching between a Mach–Zehnder modulator (MZM) to generate a BPSK waveform and an IQM to generate a QPSK waveform. Alternatively, an IQM could be used to generate both BPSK and QPSK waveforms by using either common or unique and drive signals, respectively. An advantage of using independent modulators to implement BPSK and QPSK is that the simpler structure of an MZM over an IQM (i.e., nested MZMs) often leads to lower implementation penalties for BPSK. 2.2.Variable Code RateWell-designed FEC improves achievable sensitivity at the expense of increased bandwidth (i.e., reduced spectral efficiency). Figure 3 shows the theoretical spectral efficiency at capacity as a function of SNR for QPSK and BPSK. The effects of decreasing spectral efficiency, even by a minimal amount, results in significant reductions in the required SNR at the receiver, albeit with diminishing returns as the spectral efficiency becomes small. It is important to note that the minimum required SNR values for error-free communication for various FEC code rates shown in Fig. 3 are only possible with ideal soft-decision FEC. Practical FEC has an implementation penalty, which increases the SNR requirement from the theoretical limit. It is also possible to use hard-decision FEC, which has decreased computational complexity and an increased implementation penalty versus soft-decision FEC.17 Fig. 3Spectral efficiency versus SNR required for error-free communications when varying the FEC code rate from rate- to rate- and using QPSK. The Shannon limit is defined as the capacity limit when using a preamplified coherent receiver with soft-decision FEC. The QPSK and BPSK theory curves are the capacity limits for soft-decision preamplified coherent detection of QPSK and BPSK, respectively. SD: soft-decision. HD: hard-decision. 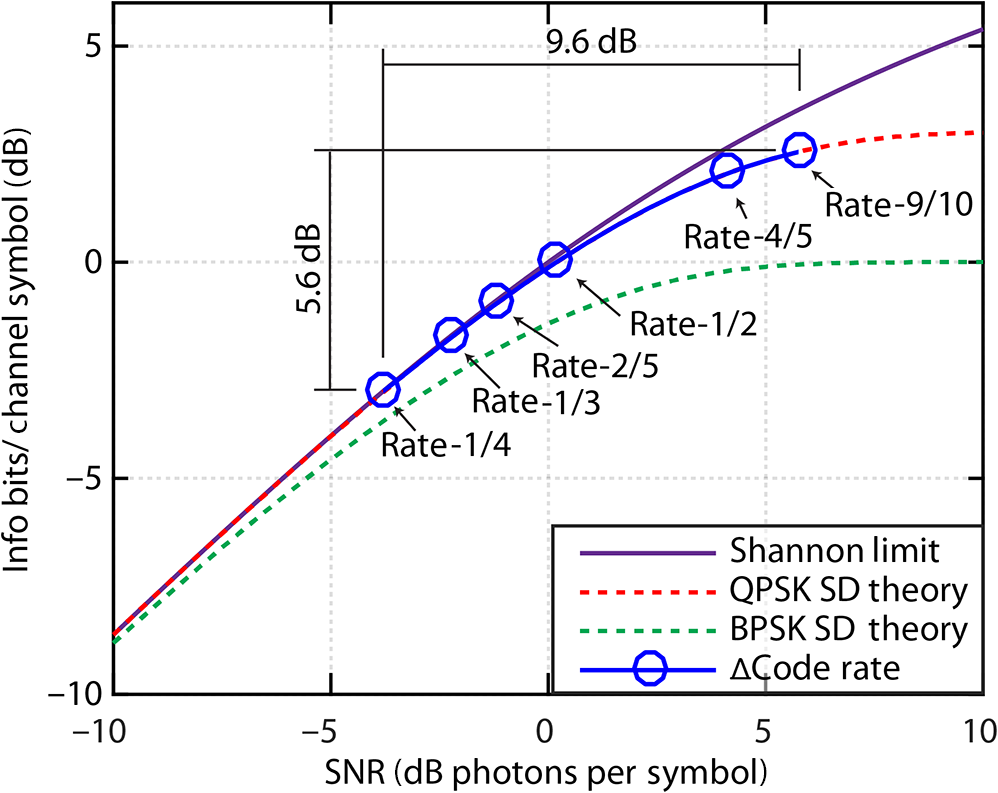 2.3.Block Repeating and Coherent CombiningIn block repeating, a form of temporal diversity, each block of a specified number of channel symbols is repeated times by the transmitter. The receiver then combines the repeated blocks in DSP. The repeated block can be combined incoherently by power combining for an improvement in SNR by a factor of , or coherently, which results in an improvement in SNR by a factor of since the phases of the signal fields being combined can be phase aligned. Coherent combining is more efficient but requires a phase sensitive receiver, such as a digital coherent receiver. By combining digital coherent receivers with block repeating, it is possible to further extend the achievable data-rate dynamic range. Figures 4 and 5 show how increasing the number of block repeats results in a decrease in both data rate and the required SNR for error-free communication, which enables extending the achievable transmission distance or relaxing other system parameters. Fig. 4Block repeating and coherent combining concept. Letters A–H represent unique blocks of symbols. 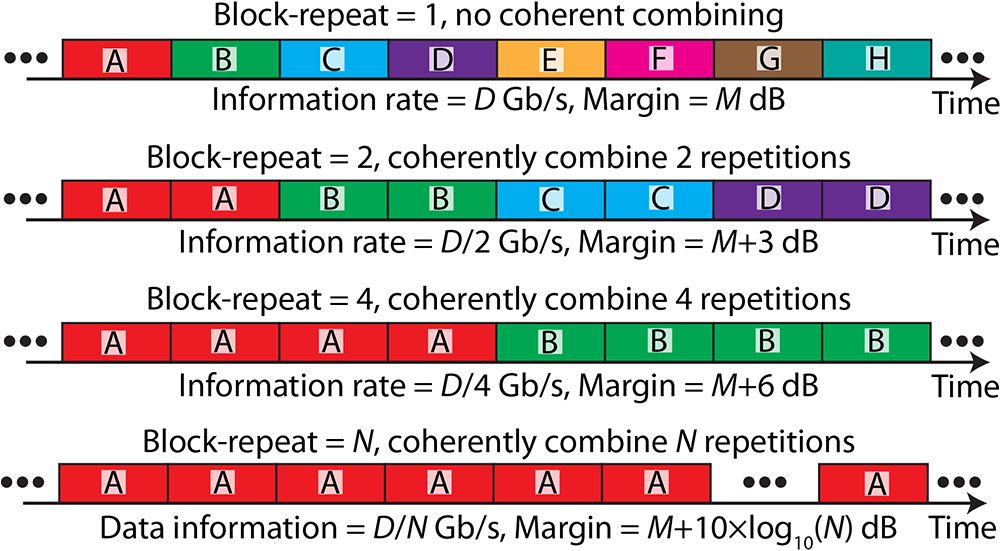 Fig. 5Spectral efficiency versus SNR required for error-free communication when varying the number of block transmissions, , and using rate- FEC with BPSK. The Shannon limit is defined as the capacity limit when using a preamplified coherent receiver with soft-decision FEC. The QPSK and BPSK theory curves are the capacity limits for soft-decision preamplified coherent detection of QPSK and BPSK, respectively. SD: soft-decision. HD: hard-decision. 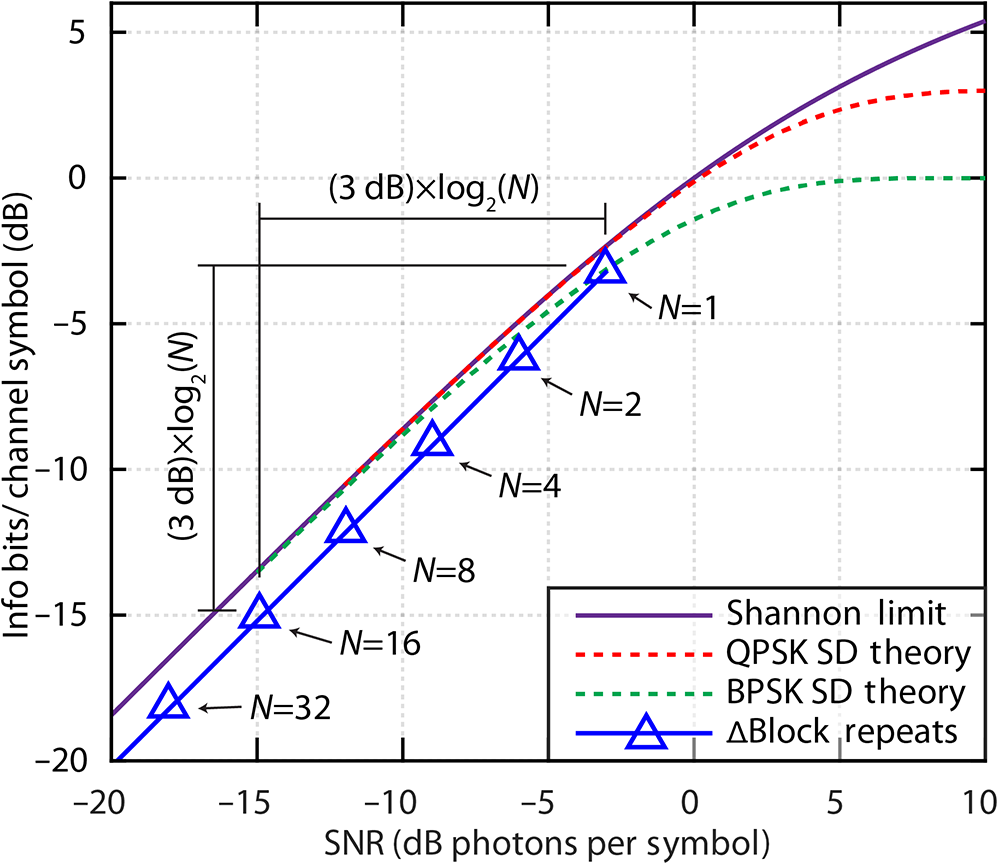 In particular, Fig. 5 shows that the required SNR for error-free communication and achievable information rate decrease by 3-dB for every doubling of the number of block repeats. The blue triangles show the resulting SNR and spectral efficiency when block repeating and coherently combining a rate- BPSK signal. Block repeating and coherent combining can be applied to any modulation format operating at any FEC code rate. The particular choice of modulation format and SNR for the case in Fig. 5 is an example reference point to illustrate the reduction in required SNR with an increasing number of block repeats. Note that in the case of block repeating that a 3-dB decrease in required SNR yields a 3-dB reduction in spectral efficiency. By contrast, a perfect soft-decision FEC code can achieve better than 3-dB reductions in the required SNR for a 3-dB reduction in spectral efficiency. In practice, however, implementing a large number of block repeats is much less computationally intensive than implementing efficient and extremely low rate (e.g., rate-) FEC codes. Block repeating and coherent combining requires that the relative phase between blocks be known and tracked for the total time duration of each set of block repeats to be coherently combined. The information rate can be lowered by coherently combining block repeats as long as the relative phase between each block can be determined. Block repeating can be combined with interleaving, which is typically used to mitigate scintillation in FSO links. Block repeating and interleaving can be configured independently. In fact, the amount of interleaver memory required for fade diversity decreases as the number of block repeats increases since fewer unique blocks of bits are needed in memory simultaneously. 3.Variable Modulation-FormatThis section presents experimental results of changing the modulation format from QPSK to BPSK to achieve an increase in system margin at the cost of reducing the transmitted data rate. 3.1.Variable Modulation-Format Experimental ArrangementFigure 6 shows the experimental arrangement used to achieve transmission of QPSK or BPSK waveforms. The data driver for BPSK consisted of one pattern that fed into an MZM with 40 GHz of bandwidth. For QPSK, two independent pattern generators that each operated at drove the and ports of an IQM with 25-GHz of bandwidth. The narrow-linewidth fiber laser used as the optical signal source had a Voigt linewidth profile with Lorentzian and Gaussian components. Fiber connections enabled switching between the two modulators, although a deployed system could operate in QPSK or BPSK mode using an IQM. After data modulation by the MZM (for BPSK) or IQM (for QPSK), the signal was pulse carved using an MZM to generate 50% return-to-zero waveforms.23 An RF synthesizer operating at 11.52 GHz provided the clock signal for the data driver and pulse carver MZM. Fig. 6Experimental arrangement depicting (a) pulse-carved signal generation that is selectable between QPSK and BPSK and (b) preamplified coherent receiver. EDFA: erbium-doped fiber amplifier. IQM: in-phase and quadrature-phase modulator; MZM: Mach–Zehnder modulator; BPF: band-pass filter; Att.: optical attenuator; DSP: digital signal processing; PIC: photonic integrated circuit. 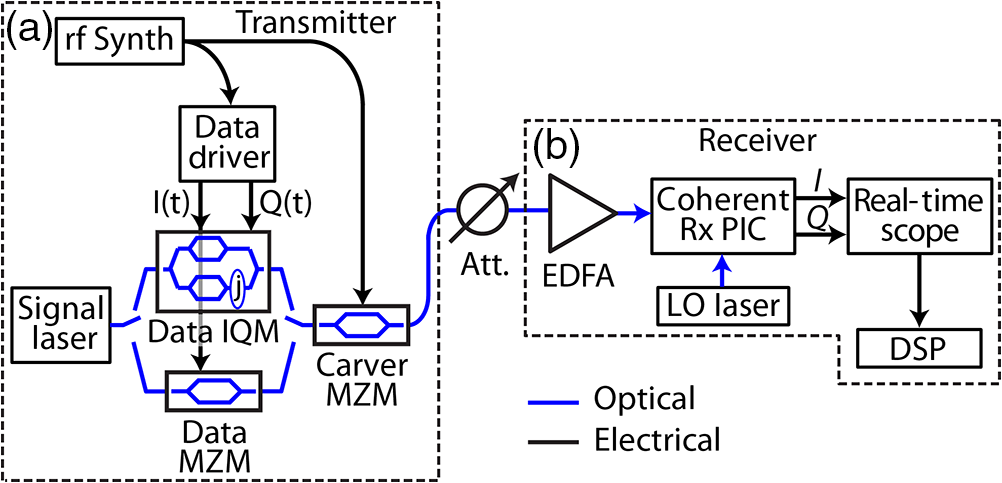 Figure 7 shows the major DSP steps used in the digital coherent receiver. The signals were processed in blocks of 64,800 bits, which corresponds to a single digital video broadcasting satellite second generation (DVB-S2) FEC code word24 discussed in more detail in Sec. 4.1. First, front-end compensation of each set of digitized and signals enabled equalization of the and signal levels and removal of and signal timing skew. Next, a clock recovery algorithm aligned the signal timing modulo a symbol period so that the center location of each symbol was known. The start time of data frames was determined by extracting the first 64,800 symbols of each signal, performing carrier-phase estimation (CPE), implementing a matched filter, and comparing against a known truth sequence. The relative timing between received signals could also be determined using a pilot sequence or by correlating the signals against each other. Next, a frequency estimation algorithm removed the residual beat frequency between the signal and local oscillator (LO).25 The resulting signal underwent matched filtering using a 50% return-to-zero filter to maximize SNR. Next, a CPE algorithm removed the residual relative phase between the signal and LO lasers.26 The sensitivity performance was then assessed through BER analysis. 3.2.Variable Modulation-Format Experimental ResultsFigure 8 shows the measured BER results for BPSK and QPSK over a wide range of received power levels. In particular, Fig. 8(a) depicts BERs over a more than 25-dB range of power levels for both BPSK and QPSK. Figure 8(b) shows the BER curves as a function of dB PPB. Here, the BER curves for both BPSK and QPSK are nearly identical and both track the theory curve. Note that at sensitivities less than PPB, the BER performance of QPSK starts to degrade from BPSK. This is likely due to the more stringent SNR requirement for the CPE algorithm for QPSK over BPSK due to the denser constellation. Figure 8(c) shows that the penalty from theory as a function of BER for both BPSK and QPSK achieves performance better than 2.5 dB over a wide range of BER values. The slight penalty increases at lower BER values, which are likely systematic in nature, while the penalty increases at high BER, which are due to insufficient SNR for the CPE algorithm. Fig. 8BER performance of BPSK and QPSK as a function of (a) received power and (b) dB PPB. (c) Penalty from theory for BPSK and QPSK. 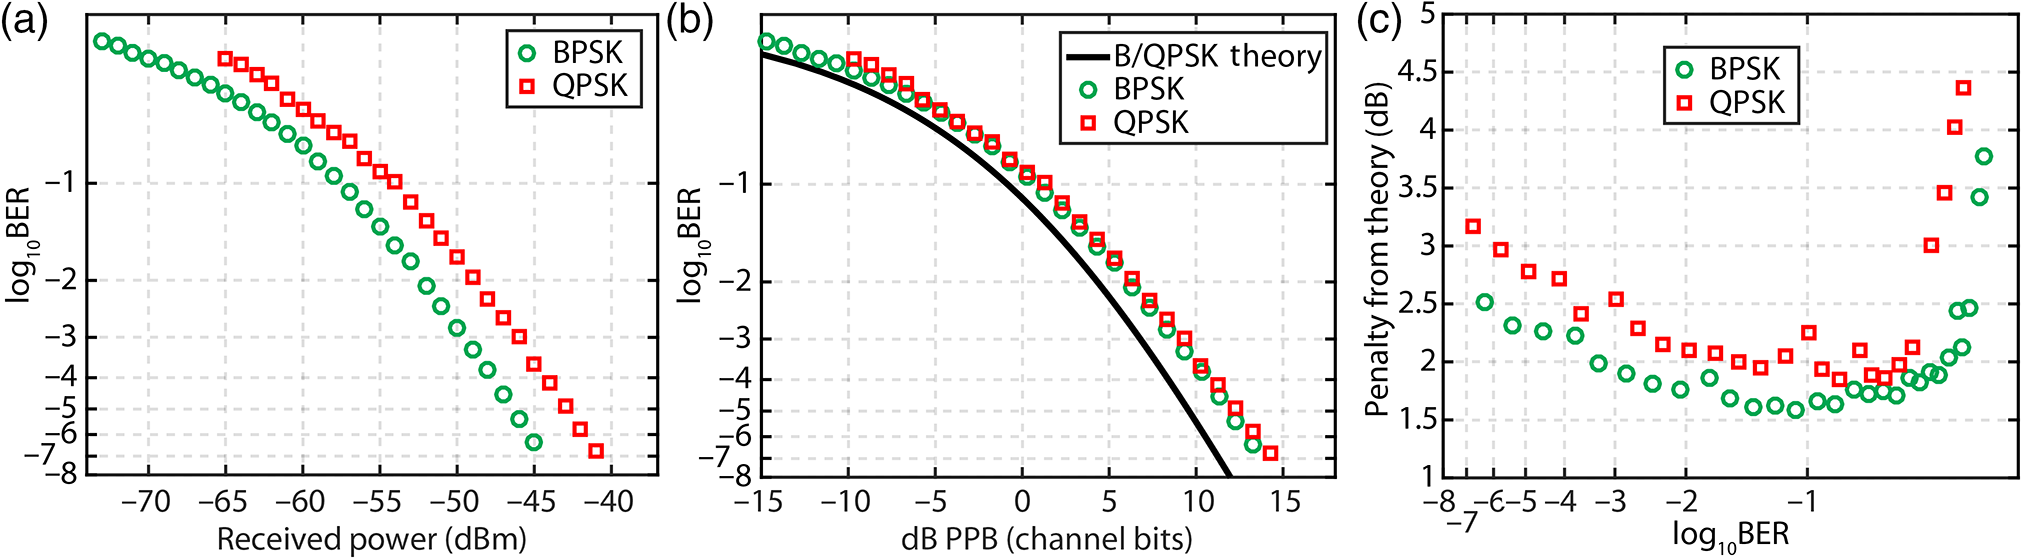 As shown in Fig. 9, the measured BER values from Fig. 8 can be used to calculate the hard-decision FEC code rate required for error-free decoding, which can be used to calculate spectral efficiency. The measured results show that for the 3-dB change in spectral efficiency achieved by switching between QPSK and BPSK, there is a 3.5-dB change in required SNR. The extra 0.5 dB is due to the increased penalty from theory of QPSK versus BPSK that can be seen in Fig. 8(c). 4.Variable Code RateThis section presents experimental results of changing the FEC code rate of a QPSK waveform from rate- to rate- to span an 8.9-dB range in SNR at the receiver while maintaining error-free performance. The changes in code rate were achieved through only changes in software. 4.1.Digital Video Broadcasting Satellite Second Generation StandardDVB-S2 is a powerful soft-decision FEC standard designed for satellite television that includes many modulation formats, code rates, and code word lengths.24 Specifically, DVB-S2 relies on the concatenation of a lower-rate low-density parity check (LDPC) code with a high-rate Bose, Chaudhuri, and Hocquenghem (BCH) code. In this way, the low-rate LDPC code performs the bulk of the FEC and the high-rate BCH code essentially corrects for residual errors from the LDPC code. A DVB-S2 encoder performs a direct mapping of information bits to channel bits, and a DVB-S2 decoder recovers the information bits from the channel bits using an iterative algorithm. More details regarding the performance and implementation of DVB-S2 can be found in Refs. 24, 27–30. This paper focuses on QPSK signals using rate-, rate-, rate-, rate-, rate-, and rate- FEC that utilize a 64,800-bit code word. In particular, the use of DVB-S2 FEC is advantageous due to its extremely steep waterfall curves that can result in post-FEC BER variations of several orders of magnitude for fractions of a dB changes in received dB PPB. Table 1 summarizes pertinent details for DVB-S2 operating at these code rates. Note that the code gap is between 0.64 and 1.50 dB, which enables similar performance for each code rate.12 Table 1Selected DVB-S2 code rate details for QPSK.
4.2.Variable Code-Rate Experimental ArrangementFigure 10 shows the experimental arrangement for achieving ultrasensitive performance using QPSK. Figure 10(a) shows the QPSK transmitter setup for generating pulse carved QPSK waveforms for various code rates. The software-based DVB-S2 encoder produced two parallel-encoded bit sequences that consisted of 32 unique code words for both the and channels that were each interleaved across all 32 code words. In this way, the and channels were treated as two orthogonal BPSK channels. The data driver consisted of two independent pattern generators that each operated at to drive the and ports of an IQM with 25-GHz of bandwidth. The narrow-linewidth fiber laser used as the optical signal source had a Voigt linewidth profile with Lorentzian and Gaussian components. After data modulation by the IQM, the signal was pulse carved using a MZM to generate 50% return-to-zero waveforms.23 An RF synthesizer operating at 11.52 GHz provided the clock signal for the data driver and pulse carver MZM for all tested code rates. Fig. 10Experimental arrangement depicting (a) pulse-carved QPSK signal generation and (b) preamplified coherent receiver. EDFA: erbium-doped fiber amplifier; IQM: in-phase and quadrature-phase modulator; MZM: Mach–Zehnder modulator; BPF: band-pass filter; Att.: optical attenuator; DSP: digital signal processing; PIC: photonic integrated circuit. 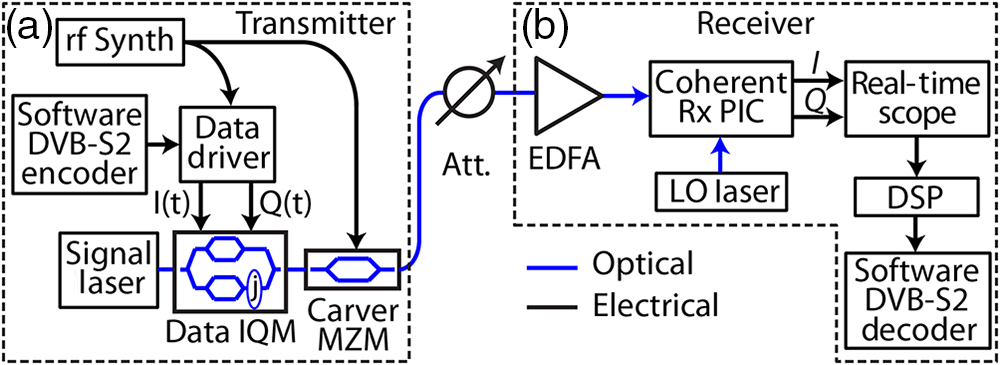 Figure 10(b) shows the receiver, which relied on a preamplified coherent receiver setup. The incoming signal experienced two stages of optical amplification and filtering before mixing with an LO laser in a 90-deg optical hybrid. Photodetection was performed using two pairs of balanced photodiodes to yield the and components. After further RF amplification, a 2-channel, , 20-GHz real-time scope digitized the and signals, which then underwent DSP. The DSP algorithm is the same, as in Fig. 7 and Sec. 3.1, with the addition of FEC decoding before performing BER analysis. 4.3.Variable Code-Rate Experimental ResultsSection 4.2 presented the experimental arrangement used to transmit and receive measured results that consisted of QPSK waveforms with DVB-S2 FEC at a variety of code rates and information rates that achieved ultrasensitive communications performance at multi-gigabit data rates. Figures 11, 12, and Table 2 summarize the measured results achieved for the QPSK waveforms. The code gap for DVB-S2 varies for each code rate, and the achievable sensitivity degrades as the code rate is increased (i.e., decreasing FEC overhead), as shown in Fig. 11, Table 2, and by the capacity curve in Fig. 3. Rate-, rate-, and rate- results all achieved a sensitivity of 2.8-dB PPB or better. Fig. 11Measured results of spectral efficiency versus SNR for QPSK at various soft-decision FEC code rates varying from rate- to rate-. 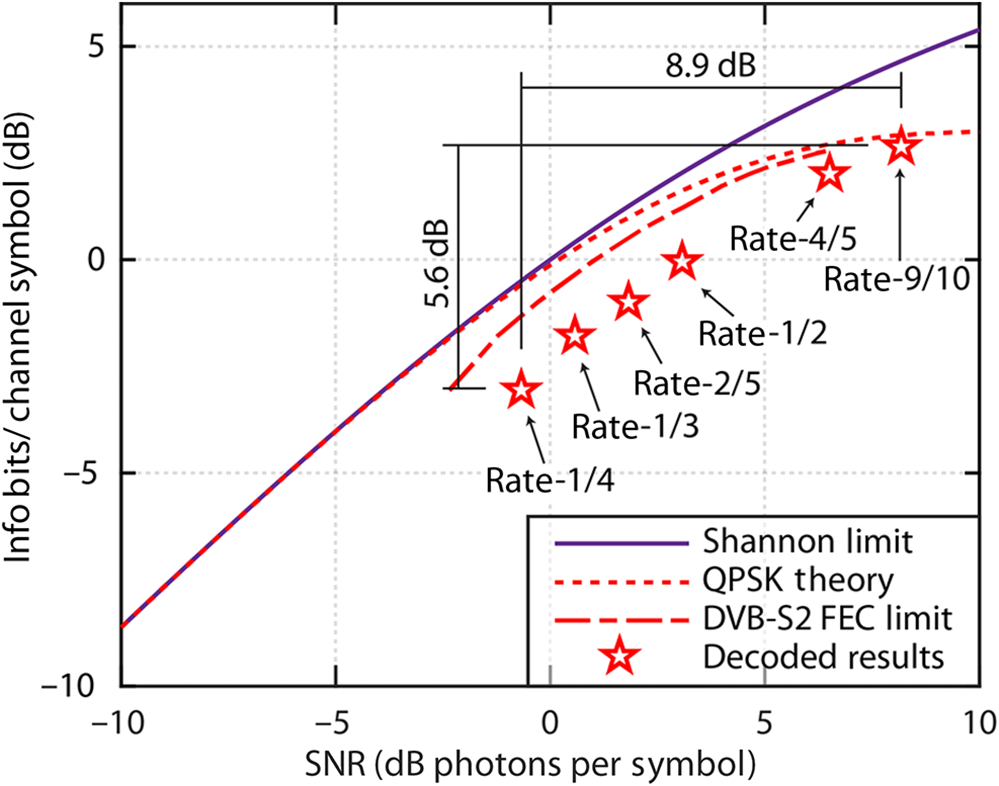 Fig. 12Waterfall BER curves for QPSK results at 11.52-GHz symbol clock rate versus received power for various DVB-S2 code rates. 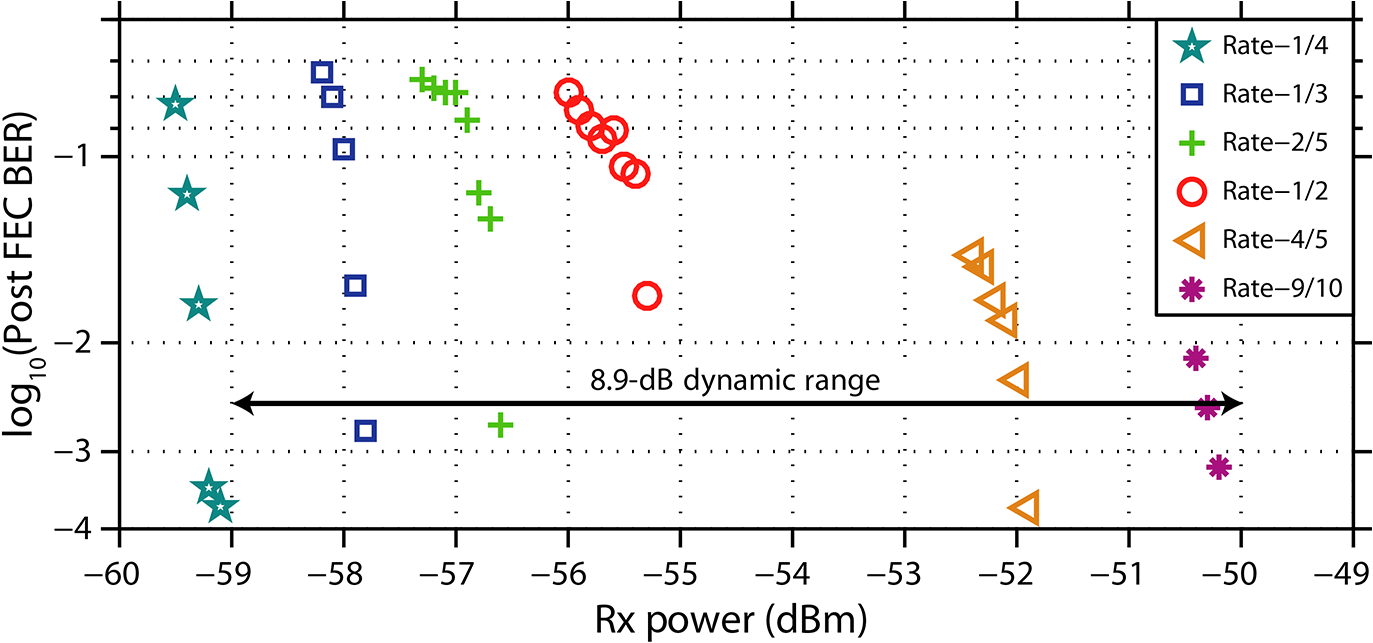 Table 2Summary of measured results at various FEC code rates.
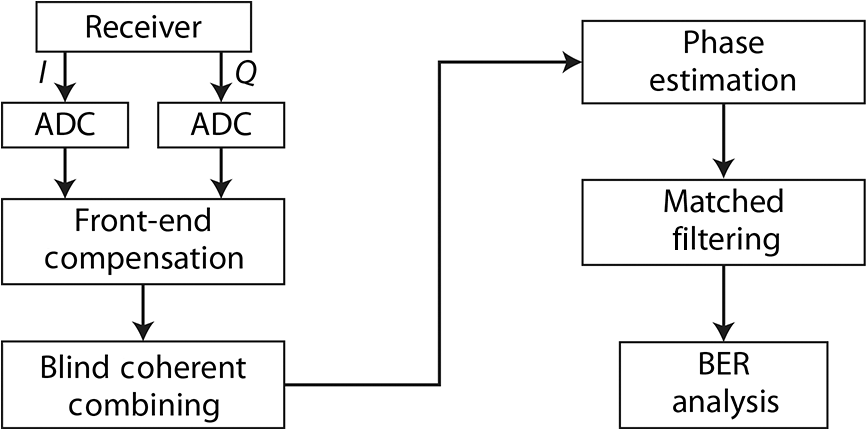
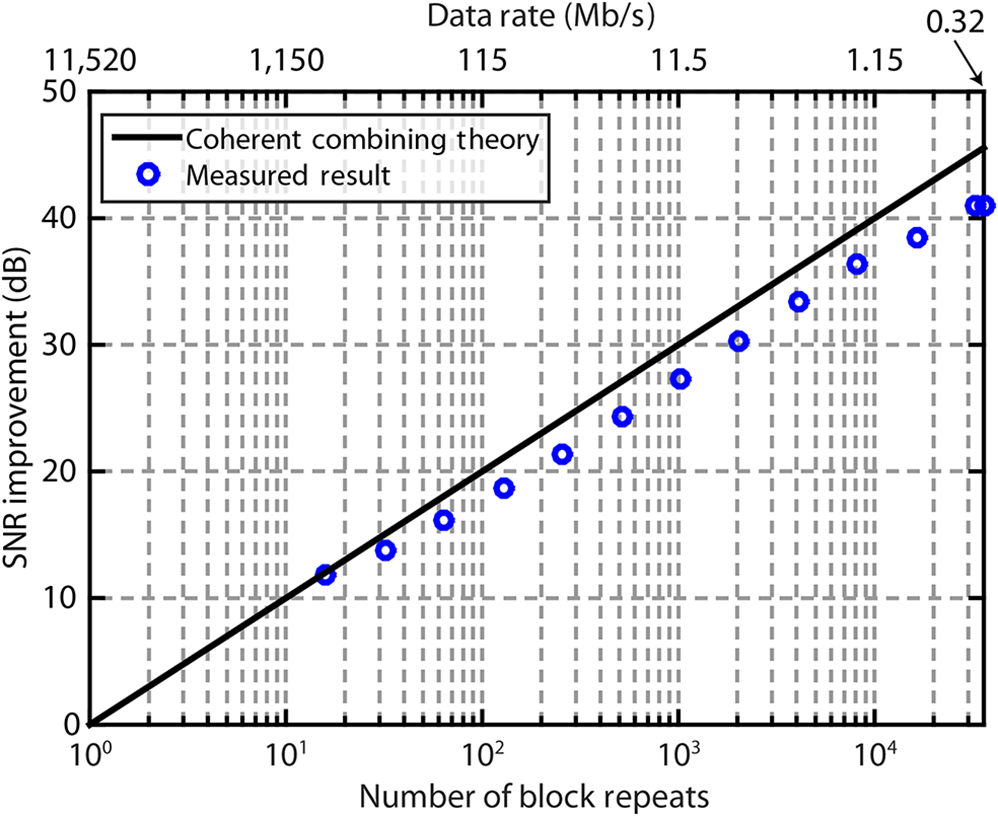
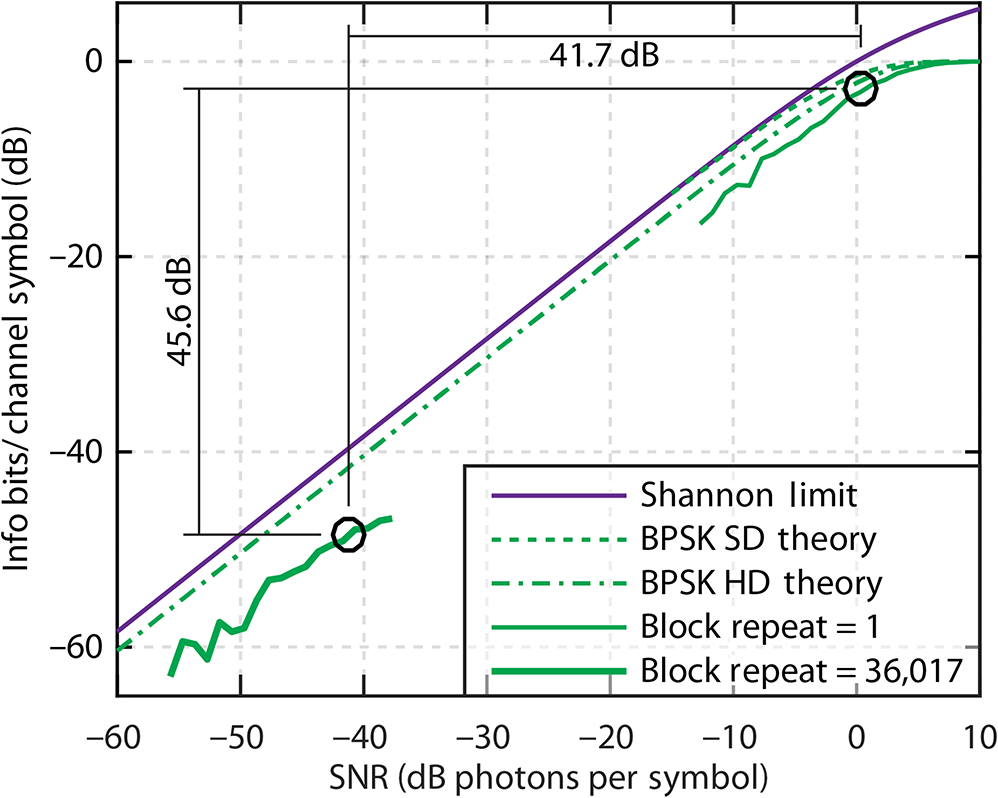
Figure 11 shows measured sensitivity results for QPSK at a symbol clock-rate of 11.52 GHz at various DVB-S2 code rates. The implementation penalty is consistent across the wide range of code rates (and received optical power levels). The measured results show that it was possible to achieve an 8.9 dB range in SNR required for error-free communications by changing the spectral efficiency by 5.6 dB. Figure 12 shows a waterfall BER curve for the measured results in Fig. 11, which agrees well with the expected steep waterfall curves for DVB-S2. These results show that by changing the FEC code rate, a system operating with a single clock rate of 11.52 GHz can successfully decode communications error free over a received power dynamic range that is extended by 8.9 dB by trading data rate. This is advantageous despite the decrease in data rate at lower received powers since the system margin can be increased without the need to reconfigure system components (e.g., matched filters and clock recovery) without additional performance penalty to accommodate different system information rates. Note that a further doubling of the spectral efficiency for all measured results is possible with systems that incorporate polarization diversity. Figure 13 shows histogram-based constellation diagrams for the lowest received power levels that yielded error-free results after FEC decoding. These error-free performance levels correspond to channel error rates of 22.5% for rate-, 19.1% for rate-, 15.9% for rate-, 12.6% for rate-, 4.2% for rate-, and 1.8% for rate-. There is an overlap of the constellation points at all code rates with a significant overlap occurring at the lowest rates. In particular, at rate- and rate-, the constellation diagrams closely resemble Gaussian noise, except for a faintly visible square shape for the overall constellation. Fig. 13Measured histogram based constellation diagrams of (a) rate-, (b) rate-, (c) rate-, (d) rate-, (e) rate-, and (f) rate- QPSK waveforms at received power levels of 2.4 dB-PPB, 2.4 dB-PPB, 2.8 dB-PPB, 3.1 dB-PPB, 4.5 dB-PPB, 5.7 dB-PPB, respectively, that yield error-free performance. Blue traces show the marginal distribution of the in-phase and quadrature-phase values, and the green and magenta traces show the marginal distribution of each of the two constellation points along each of the quadratures. 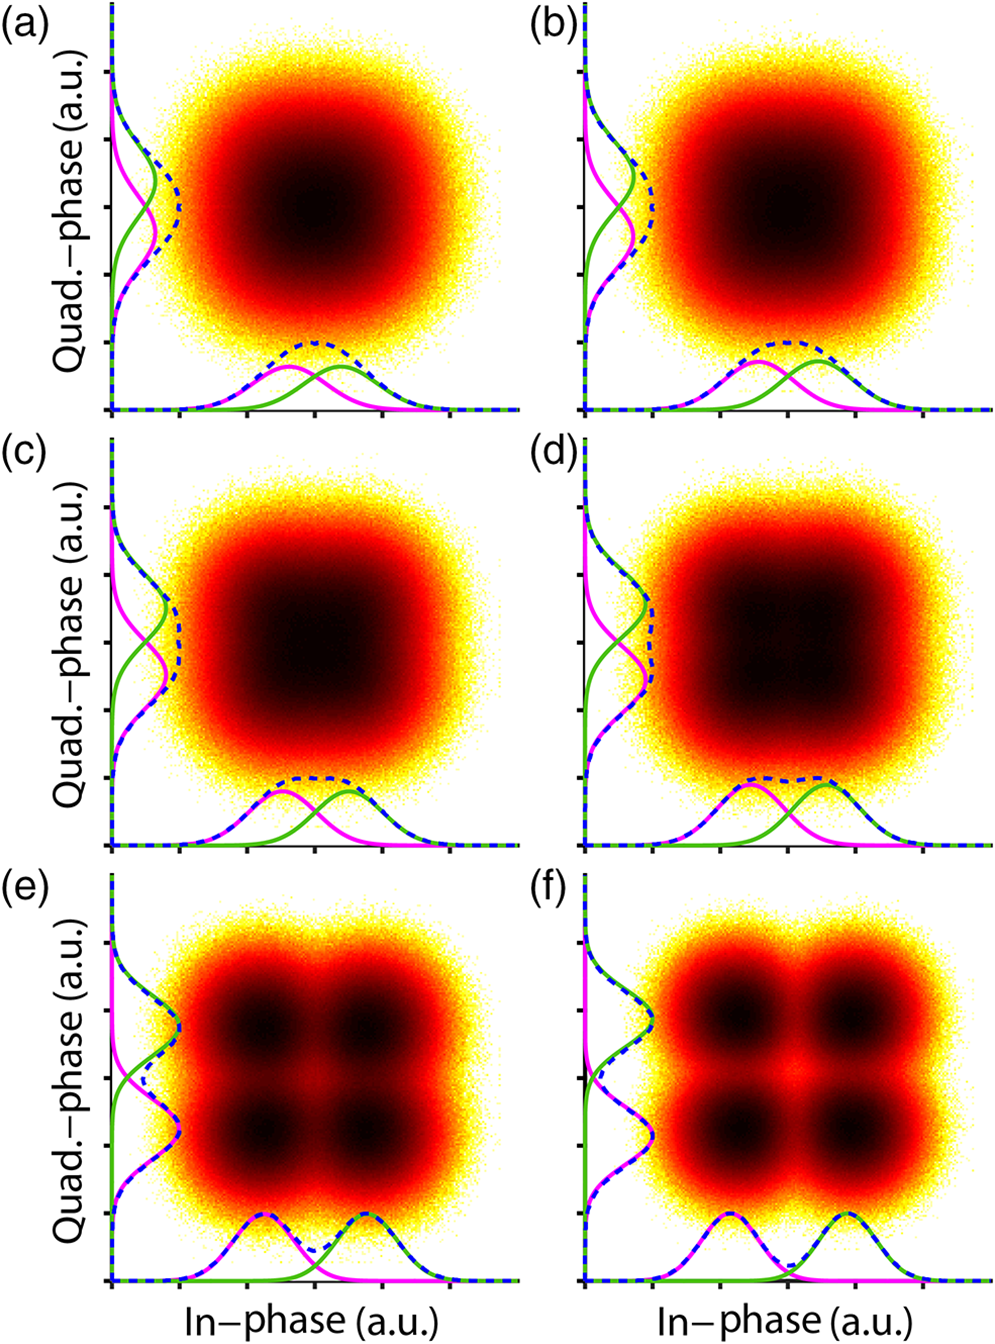 5.Block Repeating and Coherent CombiningThis section presents experimental results of using block repeating and coherent combining of a BPSK waveform. Specifically, the use of 36,017 block repeats enables achieving a 41.7-dB range in the SNR required for error-free communication at the receiver for a 45.6-dB change of data rate. 5.1.Block Repeating and Coherent Combining Experimental ArrangementThe concept of block repeating is dependent on having a known carrier phase in the received signal over a specified time interval. The relative phase offset of each block to be combined can be estimated by calculating the mean of the dot products of samples in each block with respect to one block, which is defined as the reference. The relative phase offset for each block is then removed allowing the corresponding data samples in all the blocks to be added to achieve high SNR, and then demodulated using carrier phase estimation. The block time over which the temporal phase can be assumed constant is limited by the laser coherence length (signal or LO) or the atmospheric coherence time, whichever is shorter. The laser coherence time is roughly equal to the inverse of its linewidth. For example, the coherence time of a 10-kHz linewidth laser is . On the other hand, the atmospheric coherence time will be a function of the particular atmospherics and is on the order of to 10 ms.31 Readily available commercial off-the-shelf lasers that have linewidths on the order of 10 kHz are likely to be the limiting factor for the temporal coherence time in most atmospheric conditions. Figure 14 shows the experimental setup used to demonstrate block repeating over a wide range of data rates. This particular experimental arrangement was configured to minimize phase variations due to both laser linewidth and atmospheric coherence time to show that block repeating can be effective over a reasonably long time duration. Here, we observed a 6.4-ms duration for each data acquisition, which was only limited by the real-time scope memory depth. Fig. 14Experimental arrangement showing (a) the transmitter and (b) the preamplified coherent receiver. MZM: Mach–Zehnder modulator; DSP: digital signal processing; Att.: attenuator; PIC: photonic integrated circuit. 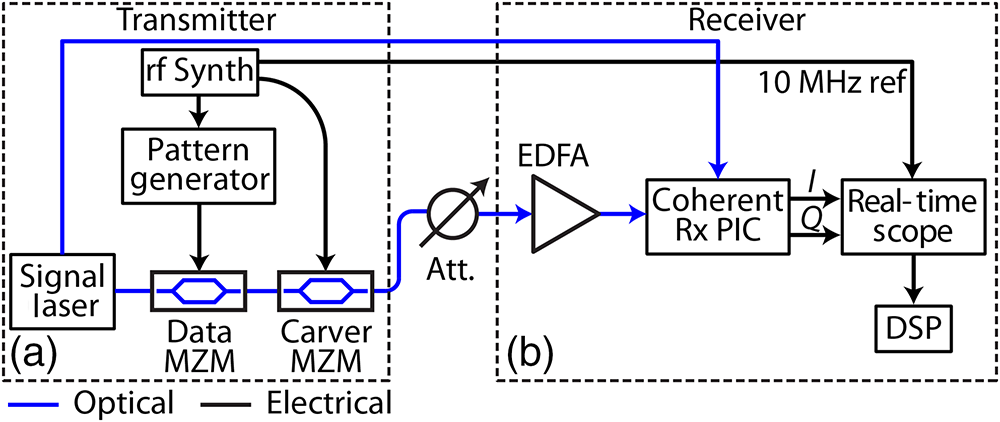 The transmitter and receiver were in an autodyne configuration, which means that a tap from the signal laser prior to modulation was used as the LO in the receiver. The result is that the effects of laser linewidth were effectively negated since frequency and phase variations of the signal laser would be common along the signal and LO paths as long as the path length delay difference is less than the phase coherence time of the laser. In a real system, laser linewidth can be removed as a significant source of error by using low linewidth () signal and LO lasers. Here, using a fiber-based setup enabled ignoring the effect of atmospheric coherence time. In FSO systems, the atmospheric coherence time is dependent on the specific atmospheric conditions but is on the order of 1 to 10 ms. Figure 14(a) shows that the transmitter used to generate the 11.52-GBd BPSK waveform. The signal laser, a fiber laser with a 10-kHz linewidth, was data modulated and pulse carved by two serially concatenated MZMs. The use of two independent modulators avoided the need for high-speed multilevel DAC signals since the data and pulse carver MZMs could be driven by a binary signal and a clock signal, respectively. In particular, the use of a pulse carving modulator created pulses with a 50% return-to-zero pulse shape that enabled matched filtering at the receiver and also provided a strong clock tone to aid in the clock recovery process. The drive signal for the data MZM was a length pseudorandom binary sequence (PRBS). After the transmitter, the signal passed through an attenuator and underwent preamplified coherent detection [Fig. 14(b)]. Specifically, the preamplified coherent detection process consisted of two stages of amplification and filtering followed by a 90-deg optical hybrid and two pairs of balanced photodiodes. Next, a real-time scope acquired the in-phase () and quadrature phase () components of the received optical waveform. Note that the 10-MHz reference signal between the RF synthesizer and the real-time scope was synchronized to minimize timing errors between the transmitter and receiver. Each 6.4-ms real-time scope trace captured 36,017 complete repetitions of the PRBS. Figure 15 shows the DSP algorithm used to implement the block repeats and the other necessary operations for symbol demodulation and BER analysis. Specifically, the DSP algorithm implemented blind combining, in which the block repeats were coherently combined under the assumption that there is an insignificant amount of phase noise over the entire 6.4-ms acquisition. The DSP algorithm first interpolates the acquired samples to be an integer number of samples per symbol. Next, the desired number of repetitions of the PRBS was isolated and coherently added. Finally, the DSP algorithm adjusted the signal phase so that the two BSPK constellation points were aligned to 0 and phase, applied a 50% return-to-zero matched filter, determined the start time of the PRBS pattern, and measured the BER. To help further simplify the transmitter and receiver in a block repeating with coherent combining system, it could be advantageous to set the block length equal to an FEC code word length as opposed to an arbitrary length. In this way, each step of the DSP and subsequent decoding could operate on the same size blocks of channel symbols. 5.2.Block Repeating and Coherent Combining Experimental ResultsFigure 16 shows the BER result without block-repeating and temporal coherent combining for 1000 repetitions (i.e., 2,047,000 bits at each power level) of the 11.52-GBd BPSK PRBS taken at various power levels. Note that the digital coherent receiver achieved close to theoretical performance ( penalty) over a range of input powers. Here, the evaluation of 2,047,000 bits at each power level enabled BER values as low as to be accurately determined. Fig. 16Measured results of BPSK BER performance without block-repeating temporal coherent combining. 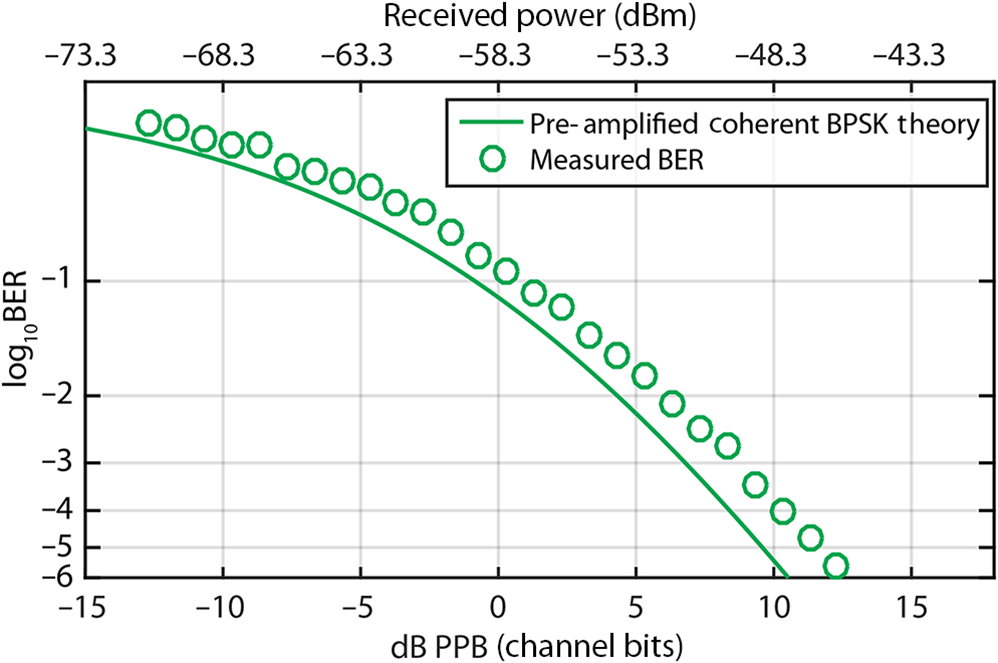 Figure 17 shows the BER result for the PRBS pattern after temporally coherently combining 36,017 repetitions. The number of waveform repetitions yields a 45.6 dB reduction in data rate from to after block repeating and temporal coherent combining. The measured results trend with the BPSK theory curve at from theory at a BER of 0.1, which is an additional penalty from block-repeat theory. The additional penalty is likely due to temporal phase changes in the laser due to acoustic, thermal, or vibrational drift in the laboratory setup over the 6.4-ms long acquisitions that led to imperfect blind coherent combining. There could also be residual timing offsets between the transmitter and receiver sampling clocks that led to coherent combining errors as the number of block repeats increased. Fig. 17Measured results of BPSK BER performance with block-repeat temporal coherent combining of 36,017 waveform repetitions. 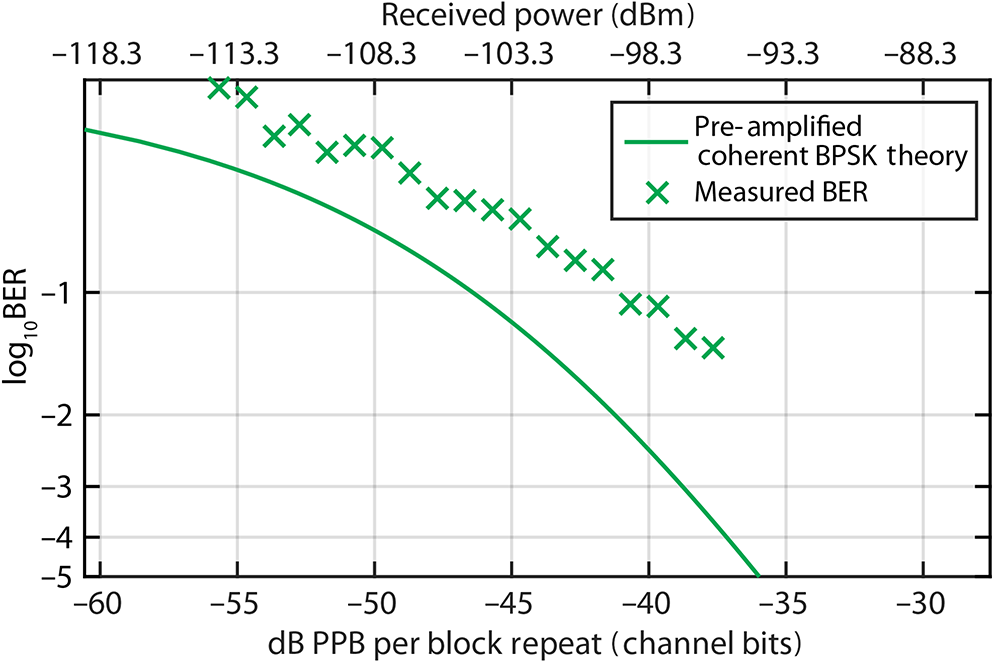 Observing the effect of block repeating as a function of the number of repetitions coherently combined provides an indication of the efficacy of the block repeating over the 6.4-ms duration datasets. In particular, Fig. 18 shows constellation diagrams for the signal after temporal coherent combining of 4000, 8000, 16,000, 32,000, and 36,000 block repeats. Note that after 4000 block repeats [Fig. 18(a)], the two constellation points are still mostly overlapping. Increasing the number of block repeats increases the resulting SNR. The slight rotation of the constellation points is indicative of residual phase offset relative to the optimal phase at 36,000 block repeats caused by either thermal or vibrational effects. Fig. 18Constellation diagram for signal with points after block repeating and combining the waveform for (a) 4000, (b) 8000, (c) 16,000, (d), 32,000, and (e) 36,000 block repeats (). The blue dots and red dots represent the measured symbol field for the 1 s and 0 s values, respectively. The blue and red curves represent the marginal probability density function for the 1 s and 0 s values, respectively. The green triangle and square represent the centroid for the 1 s and 0 s values, respectively. 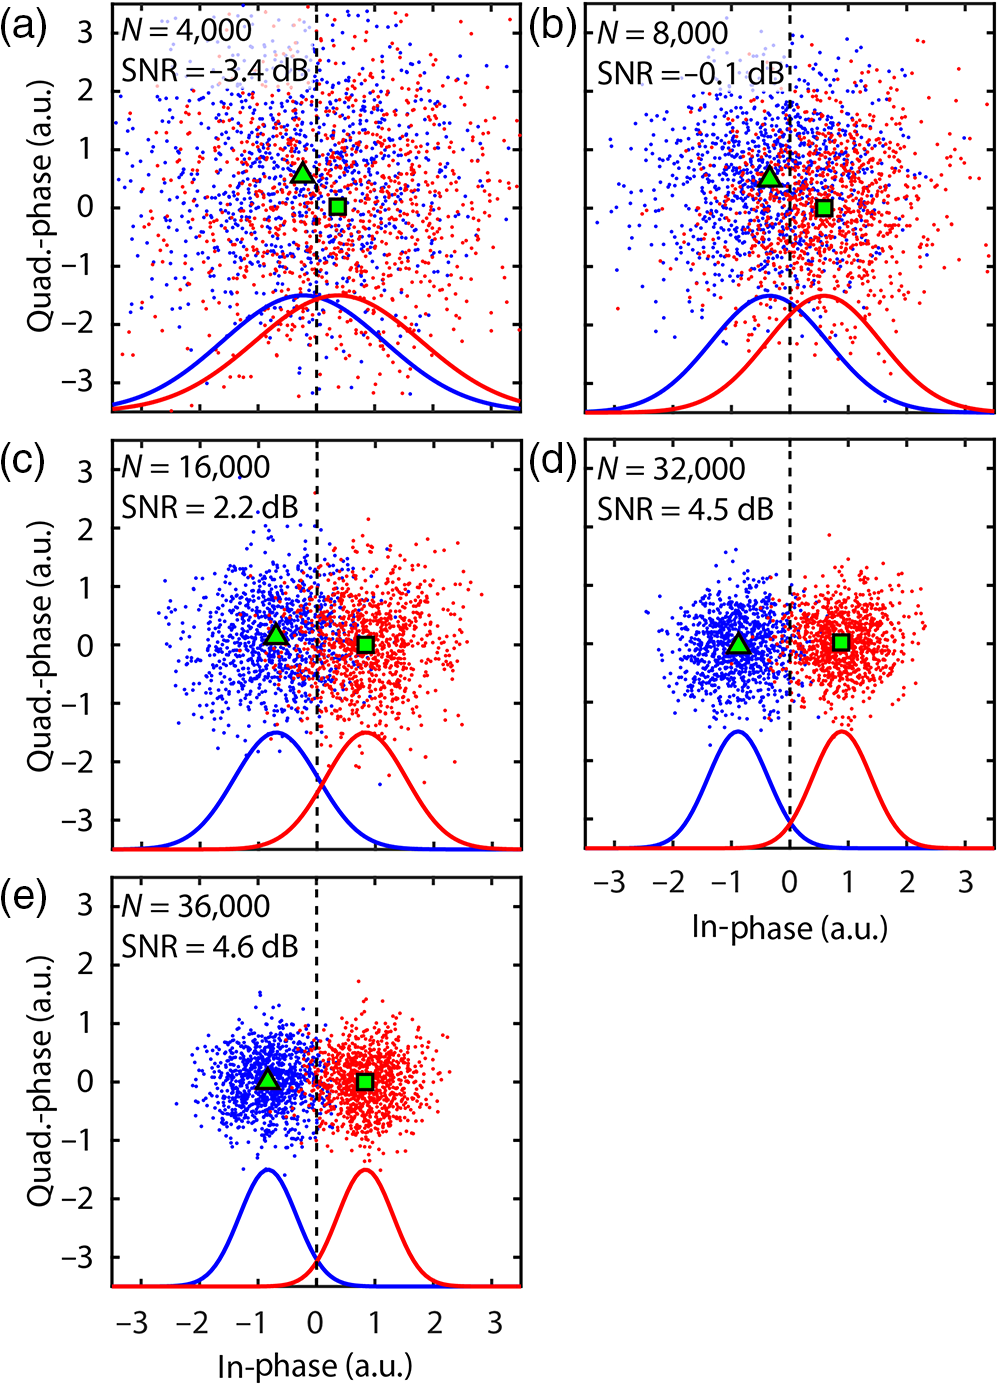 Figure 19 shows the achieved SNR improvement as a function of the number of block repeats for the signal. It can be seen that the improvement to SNR tapers off for a large number of block repeats, which is likely a result of the finite coherence time of the experimental setup. Figure 20 shows the penalty from optimal combining achieved as a function of the number of block repeats. Starting in the 10’s to 100’s of block repeats, the penalty from coherent combining increases from a negligible amount to , possibly as a result of acoustic, timing, or other noise sources that become significant for coherence times . Additional penalty is introduced after combining more than 10,000 block repeats, which corresponds to phase coherence times that is potentially thermal in origin. Improved performance could likely be obtained by tracking the slowly varying phase over the 6.4-ms data acquisitions and by implementing a clock recovery algorithm in the DSP to compensate for residual timing offsets between the transmitter and receiver sampling clocks. Figure 21 presents the measured results from Figs. 16 and 17 in terms of spectral efficiency as a function of SNR. Increasing from 1 block repeat to 36,017 block repeats achieved a 41.7-dB reduction in the required SNR for a 45.6-dB reduction in data rate for data points at the SNR limit for a perfect rate- hard-decision FEC code to decode error free. The difference between the measured and theoretical SNR reductions agree with the observed penalty in Fig. 20. 6.ConclusionFuture FSO communications systems will benefit from employing a single architecture capable of supporting a myriad of missions with diverse data rate and link budget requirements. Ideally, this communications system architecture could support a wide range of data rates with only changes in software (i.e., DSP). In particular, coherent communications enables several methods of efficiently trading achievable data rate for required SNR at the receiver while maintaining a constant system symbol rate. This paper discussed and presented experimental results of three such methods: variable modulation format, variable FEC code rate, and variable number of block repeats. Changing the modulation format between QPSK and BPSK enabled a 3-dB change in data rate for a 3.5-dB change in the required SNR. The excess penalty of 0.5 dB is attributed to a difference in the implementation penalties of BPSK and QPSK when using an MZM and IQM, respectively. Changing the FEC code rate from rate- to rate- allowed a 5.9-dB change in data rate for an 8.9-dB change in required SNR. The use of block repeating and coherent combining of 36,017 waveform repetitions showed that it is possible to achieve a 45.6-dB change in data rate for a 41.7-dB change in required SNR. All of the techniques presented in this paper allow one to trade spectral efficiency for a reduced SNR requirement at the receiver for error-free communications. A next generation FSO coherent transmission system could employ one or more of these techniques to support a wide range of data rates with a single architecture. The exact choice of technique or techniques to use will depend on the particular scenario and is a function of many factors including desired data rates, link distances, transmitter power levels, and transmitter and receiver aperture sizes. A low Earth orbit-to-ground link, for example, may want to maximize data rate when possible, which suggests modulation format switching as a desirable feature. Other links that involve crew capsules or satellites traveling deep into the solar system may want to have the flexibility to dynamically adjust the data rate given the available power aperture product of the transmitter. These missions could benefit from code rate switching or block repeating to support large ranges of data rates. The various data rate-scaling techniques presented in this paper enable capabilities that can benefit a wide variety of future missions. AcknowledgmentsThis work was sponsored by the Assistant Secretary of Defense for Research and Engineering under Air Force Contract #FA8721-05-C-0002. Opinions, interpretations, conclusions, and recommendations are those of the authors and are not necessarily endorsed by the United States Government. ReferencesD. M. Cornwell,
“NASA’s optical communications program for 2015 and beyond,”
Proc. SPIE, 9354 93540E
(2015). http://dx.doi.org/10.1117/12.2087132 PSISDGPSISDG 0277-786X0277-786X Google Scholar
S. A. Townes et al.,
“The mars laser communication demonstration,”
in Proc. of IEEE Aerospace Conf.,
1180
–1195
(2004). http://dx.doi.org/10.1109/AERO.2004.1367717 Google Scholar
V. W. S. Chan,
“Optical satellite networks,”
J. Lightwave Technol., 21 2811
–2827
(2003). http://dx.doi.org/10.1109/JLT.2003.819534 JLTEDG 0733-8724 Google Scholar
M. Toyoshima,
“Trends in satellite communications and the role of optical free-space communications,”
J. Opt. Networks., 4 300
–311
(2005). http://dx.doi.org/10.1364/JON.4.000300 Google Scholar
D. M. Boroson et al.,
“A new optical communication architecture for delivering extremely large volumes of data from space to ground,”
in Proc. of AIAA SPACE 2015 Conf. and Exposition,
(2015). http://dx.doi.org/10.2514/6.2015-4658 Google Scholar
M. L. Stevens and D. M. Boroson,
“A simple delay-line 4-PPM demodulator with near-optimum performance,”
Opt. Express, 20 5270
–5280
(2012). http://dx.doi.org/10.1364/OE.20.005270 OPEXFF 1094-4087 Google Scholar
M. M. Willis et al.,
“Downlink synchronization for the lunar laser communications demonstration,”
in Proc. 2011 Int. Conf. on Space Optical Systems and Applications,
83
–87
(2011). http://dx.doi.org/10.1109/ICSOS.2011.5783716 Google Scholar
M. A. Kraniak et al.,
“A dual format communication modem development for the Laser communications relay demonstration (LCRD) program,”
Proc. SPIE, 8610 86100K
(2013). http://dx.doi.org/10.1117/12.2013693 PSISDG 0277-786X Google Scholar
N. W. Spellmeyer et al.,
“A multi-rate DPSK modem for free-space laser communications,”
Proc. SPIE, 8971 89710J
(2014). http://dx.doi.org/10.1117/12.2057568 Google Scholar
D. O. Caplan et al.,
“Ultra-wide-range multi-rate DPSK laser communications,”
in Proc. of Conf. on Lasers and Electro-Optics,
(2010). Google Scholar
D. O. Caplan, J. J. Carney and S. Constantine,
“Parallel direct modulation laser transmitters for high-speed high-sensitivity laser communications,”
in Proc. of Conf. on Lasers and Electro-Optics,
(2011). Google Scholar
D. M. Boroson,
“A survey of technology-driven capacity limits for free-space laser communications,”
Proc. SPIE, 6709 670918
(2007). http://dx.doi.org/10.1117/12.738310 PSISDG 0277-786X Google Scholar
D. M. Boroson, Optical Communications: A Compendium of Signal Formats, Receiver Architectures, Analysis Mathematics, and Performance Comparisons, MIT Lincoln Laboratory, Lexington, Massachusetts
(2005). Google Scholar
D. J. Geisler et al.,
“Multi-gigabit coherent communications using low-rate FEC to approach the Shannon capacity limit,”
in Conf. on Lasers and Electro-Optics,
(2015). Google Scholar
D. J. Geisler et al.,
“Demonstration of 2.1 photon-per-bit sensitivity for BPSK at with rate-1/2 FEC,”
in Optical Fiber Communication Conf./National Fiber Optic Engineers Conf.,
(2013). Google Scholar
H. Hemmati, D. O. Caplan,
“Optical satellite communications,”
Optical Fiber Telecommunications, VIB 6th ed.Elsevier, Oxford, United Kingdom
(2013). Google Scholar
T. M. Cover and J. A. Thomas, Elements of Information Theory, 2nd ed.John Wiley & Sons, Inc., Hoboken, New Jersey
(2006). Google Scholar
N. W. Spellmeyer et al.,
“High-sensitivity RZ-DPSK with forward error correction,”
IEEE Photonics Technol. Lett., 16 1579
–1581
(2004). http://dx.doi.org/10.1109/LPT.2004.827417 IPTLEL 1041-1135 Google Scholar
T. Mizuochi et al.,
“Forward error correction based on block turbo code with 3-bit soft decision for optical communication systems,”
IEEE J. Sel. Top. Quantum Electron., 10 376
–386
(2004). http://dx.doi.org/10.1109/JSTQE.2004.827846 PSISDG 0277-786X Google Scholar
X. Liu et al.,
“M-ary pulse-position modulation and frequency shift keying with additional polarization/phase modulation for high-sensitivity optical transmission,”
Opt. Express, 19 B868
–B881
(2011). http://dx.doi.org/10.1364/OE.19.00B868 OPEXFF 1094-4087 Google Scholar
D. J. Geisler et al.,
“Experimental demonstration of photon efficient coherent temporal combining for data rate scaling,”
Proc. SPIE, 9739 97390Y
(2016). http://dx.doi.org/10.1117/12.2218082 Google Scholar
D. J. Geisler et al.,
“Multi-aperture digital coherent combining for free-space optical communication receivers,”
Opt. Express, 24 12661
–12671
(2016). http://dx.doi.org/10.1364/OE.24.012661 OPEXFF 1094-4087 Google Scholar
A. H. Gnauck and P. J. Winzer,
“Optical phase-shift-keyed transmission,”
J. Lightwave Technol., 23 115
–130
(2005). http://dx.doi.org/10.1109/JLT.2004.840357 JLTEDG 0733-8724 Google Scholar
“Digital video broadcasting (DVB); second generation framing structure, channel coding and modulation systems for broadcasting, interactive services, news gathering and other broadband satellite applications (DVB-S2),”
Valbonne, France
(2009). Google Scholar
M. Morelli and U. Mengali,
“Feedforward frequency estimation for PSK: a tutorial review,”
Eur. Trans. Telecommun., 9 103
–116
(1998). http://dx.doi.org/10.1002/ett.4460090203 ETTTET 1120-3862 Google Scholar
T. Pfau, S. Hoffmann and R. Noé,
“Hardware-efficient coherent digital receiver concept with feedforward carrier recovery for m-QAM constellations,”
J. Lightwave Technol., 27 989
–999
(2009). http://dx.doi.org/10.1109/JLT.2008.2010511 JLTEDG 0733-8724 Google Scholar
E. Casini, R. De Gaudenzi and A. Ginesi,
“DVB-S2 modem algorithms design and performance over typical satellite channels,”
Int. J. Satell. Commun. Network., 22 281
–318
(2004). http://dx.doi.org/10.1002/(ISSN)1542-0981 Google Scholar
M. Eroz, F.-W. Sun and L.-N. Lee,
“DVB-S2 low density parity check codes with near Shannon limit performance,”
Int. J. Satell. Commun. Networks, 22 269
–279
(2004). http://dx.doi.org/10.1002/(ISSN)1542-0981 Google Scholar
A. Morello and U. Reimers,
“DVB-S2, the second generation standard for satellite broadcasting and unicasting,”
Int. J. Satell. Commun. Networks, 22 249
–268
(2004). http://dx.doi.org/10.1002/(ISSN)1542-0981 Google Scholar
F.-W. Sun, Y. Jiang and L.-N. Lee,
“Frame synchronization and pilot structure for second generation DVB via satellites,”
Int. J. Satell. Commun. Networks, 22 319
–339
(2004). http://dx.doi.org/10.1002/(ISSN)1542-0981 Google Scholar
J. Davis and W. J. Tango,
“Measurement of the atmospheric coherence time,”
Publ. Astron. Soc. Pac., 108 456
–458
(1996). http://dx.doi.org/10.1086/133747 PASPAU 0004-6280 Google Scholar
BiographyDavid J. Geisler is a member of the technical staff at MIT Lincoln Laboratory. He received his BS degree in electrical engineering from Tufts University in 2004, and his MS and PhD degrees in electrical engineering from the University of California, Davis, in 2009 and 2012, respectively. His current research interests include highly sensitive free-space optical communications systems and coherent signal processing. He is a member of the OSA. Curt M. Schieler is a member of the technical staff at MIT Lincoln Laboratory. He received his BS degree in 2009 from Purdue University and his PhD degree from Princeton University in 2014. His current research interests include information theory and signal processing. Timothy M. Yarnall is a member of the technical staff at MIT Lincoln Laboratory. He received his BS degree from Caltech in 1998 and his MS and PhD degrees from Boston University in 2004 and 2007. His current research interests include free space optical communication and quantum information science. He is a senior member of SPIE. Mark L. Stevens is a member of the technical staff at MIT Lincoln Laboratory. He received his BS and MS degrees in electrical engineering from the University of Utah and Stanford. He has demonstrated record sensitivities with optical homodyne receivers, authored or coauthored numerous papers, and holds three patents in the field of optical communications. His current interest is photon-efficient optical communication systems for free-space applications. Bryan S. Robinson is the assistant group leader of the Optical Communications Technology Group at MIT Lincoln Laboratory. He received his SB, MEng, and PhD degrees in electrical engineering from the Massachusetts Institute of Technology. His current work is focused on the development of optical communications technologies and systems for future near-Earth and deep-space missions. Scott A. Hamilton is with MIT Lincoln Laboratory, where he leads the Optical Communication Technology group. In this role, he is responsible for multiple R&D programs to develop free-space laser and quantum communication system architectures and associated technologies. He studied electrical engineering at the University of California, Davis and received BS, MS, and PhD degrees in 1993, 1996, and 1999, respectively. He is a senior member of the IEEE and a member of the OSA. |