|
|
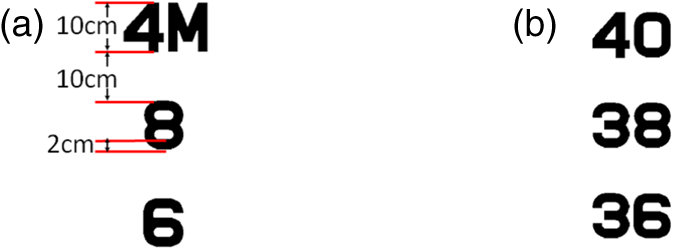
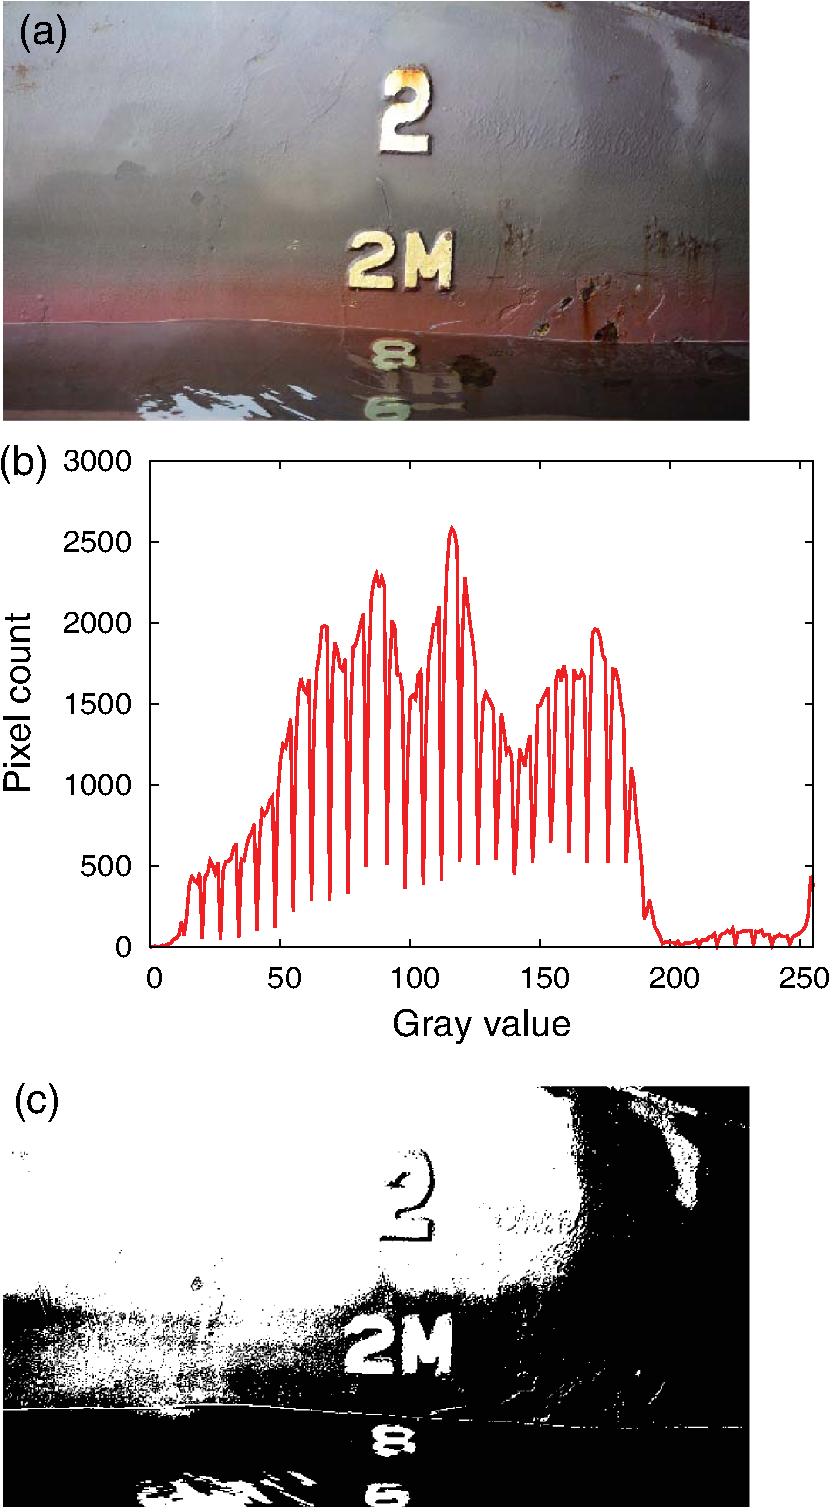
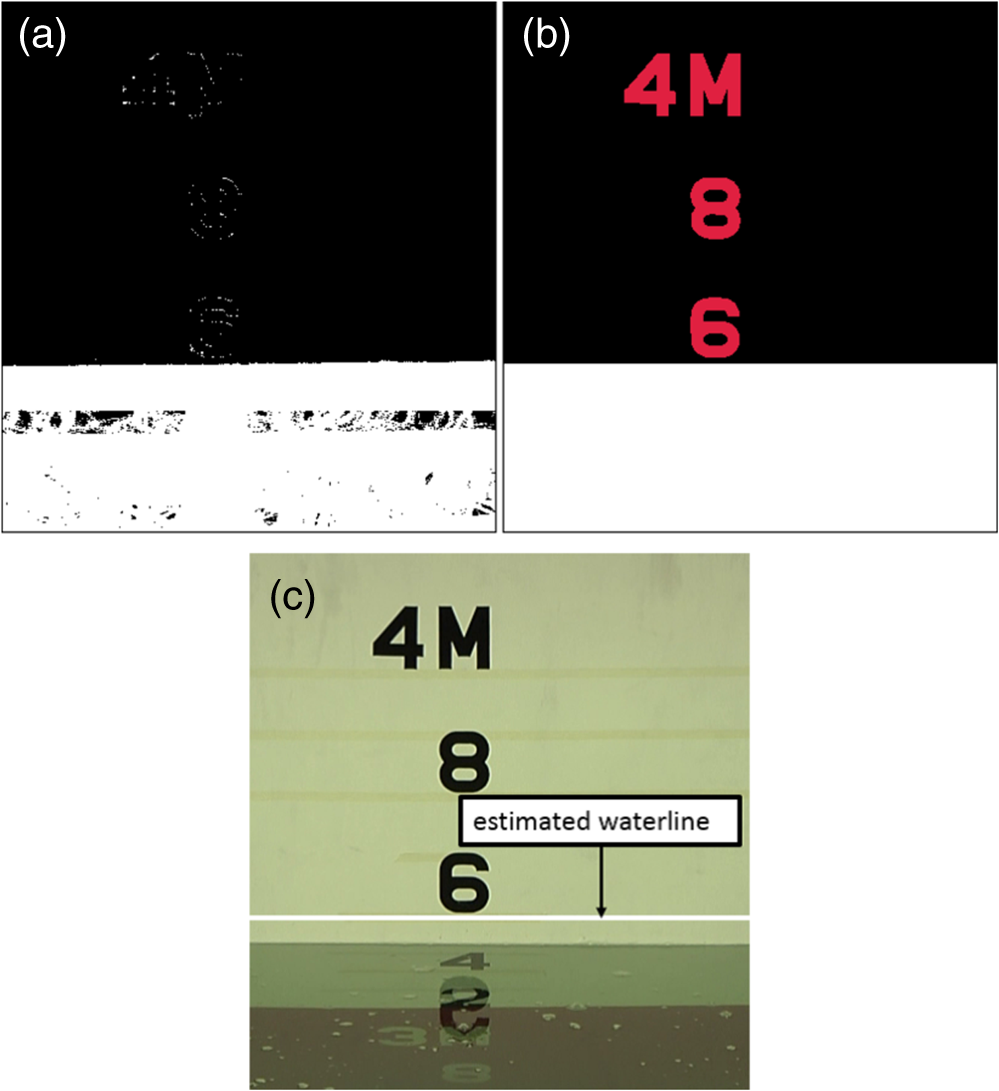
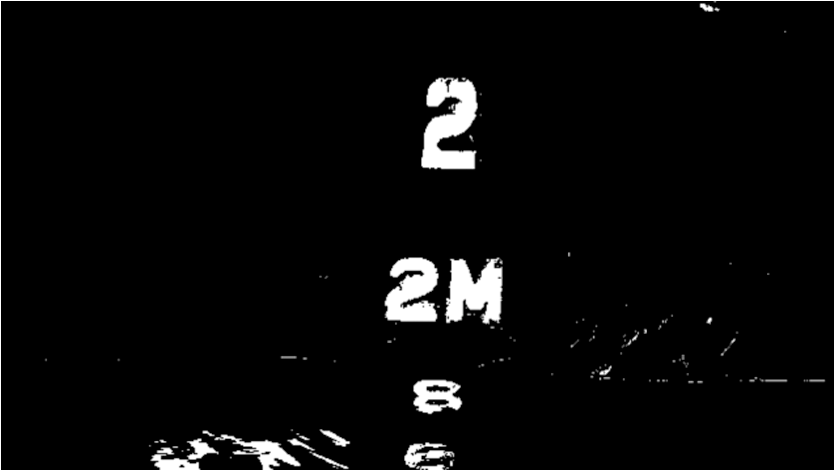
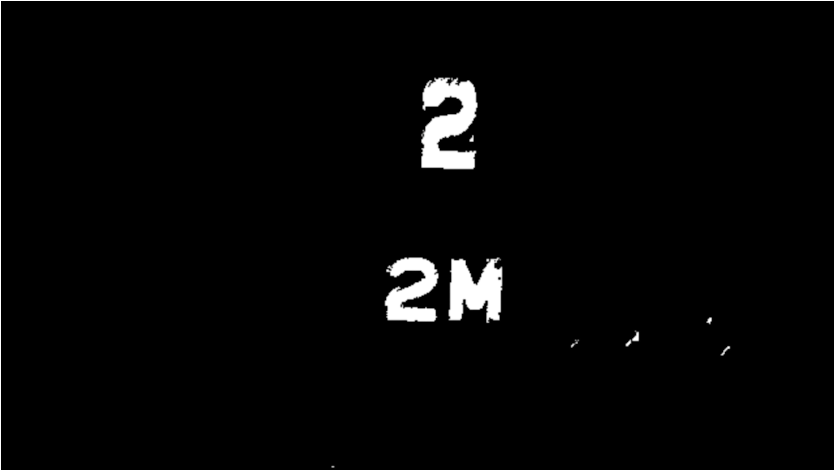
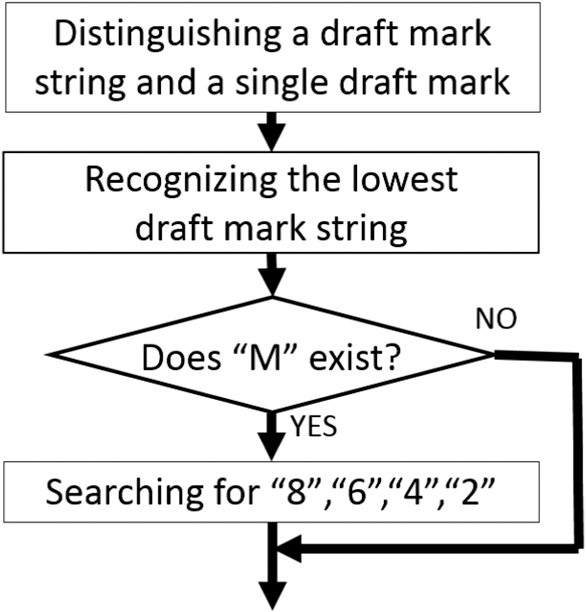
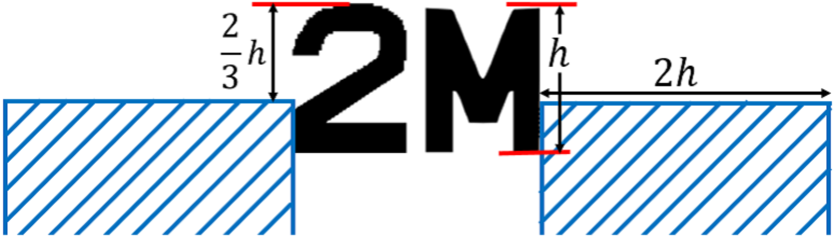
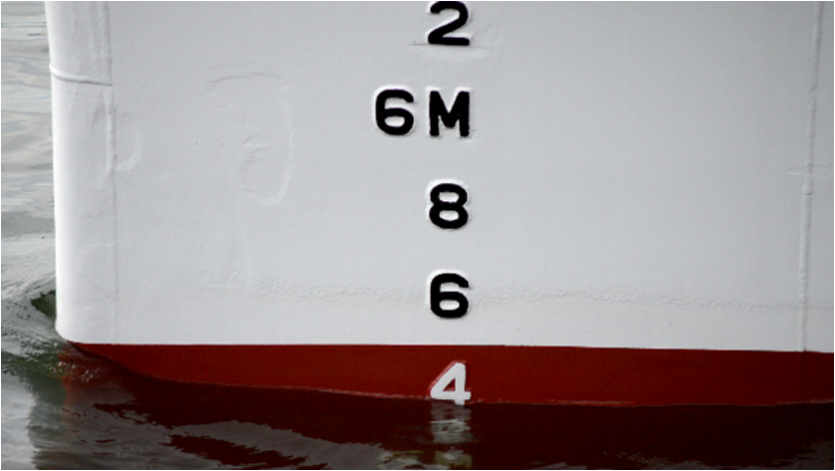
1.IntroductionIn marine transportation, a draft survey is a means to determine the quantity of bulk cargo. For reducing cargo shortage claims, draft reading must be accurate and fair to a shipper and a receiver. The draft reading has been conventionally conducted by professional surveyors, but it may not be accurate because it is based on visual observation. Moreover, if the surveyor is not independent of the shipper or the receiver, the draft reading may not be fair. The use of automatic draft reading systems provides fair draft reading. Automatic and accurate draft reading systems using sensors, such as a laser distance sensor1 and a liquid level optical sensor,2 have been proposed. However, to read the draft of a ship, the ship needs to be equipped with the sensors in advance. Low cost and high flexibility are required for ease of draft reading. Several image-based draft reading systems have been thus proposed to achieve a low cost and high flexibility in draft reading. Okamoto et al.3 proposed an image-based draft reading method using Otsu’s binarization method4 and a frame differencing technique. The method segments draft marks by Otsu’s binarization method, assuming that the whole of the observed image can be roughly classified into two classes, i.e., draft marks and a hull. However, it sometimes fails because almost all observed images include other regions than draft marks and the hull, such as a sea surface and shadows. The method takes the difference of two consecutive frames, accumulates the binary difference images, and then estimates the waterline from the sea surface segmented by the accumulated binary difference image. Therefore, the estimated waterline tends to be the highest during the observation time. Ran et al.5 proposed a method which estimates the waterline using Hough transform after applying Canny edge detection.6 The method fails when other lines, such as underwater projections of the ship’s hull, are detected in the sea surface. In this paper, we propose an image-based draft reading method that uses a draft mark segmentation and estimates the waterline for every frame. To improve an accuracy of the draft mark segmentation, we detect draft marks with morphological operations and binarize local images around draft marks. Since these local images can be well classified into draft marks and the ship’s hull, draft marks are accurately segmented from the local images by Otsu’s binarization method. Next, we detect the waterline using Canny edge detection for every frame. We then use a robust estimation to fit a straight line to the Canny edge image in a limited region around the draft mark for decreasing noise effects and regard the straight line as the waterline. Since the waterline is estimated for every frame, we can avoid the misestimation due to accumulation of difference images. Moreover, we can efficiently remove noisy edges such as projections and scars using the property that the noisy edges remain stationary relative to draft marks. The proposed method is the first study that provides all the five steps needed for draft reading; draft mark segmentation, draft mark recognition, waterline detection, waterline estimation, and draft calculation. Another salient feature of the proposed method is that the understanding of a shipper and a receiver can be obtained by emulating surveyors’ draft reading process. The accuracy of draft reading has been evaluated by using a towing tank to show the effectiveness of the proposed method. It is also shown that accurate draft reading has been achieved in a real-world scene. 2.Conventional MethodThis section explains two types of draft marks and gives a brief description of the conventional draft mark segmentation and waterline estimation,3 which are closely related to the proposed method. 2.1.Draft MarkFigure 1 shows two typical types of draft marks, representing 3.6, 3.8, and 4.0 m. The size of each draft mark is 10-cm high and 2-cm wide.7 Type 1 uses “M” to represent meter, while type 2 uses only numbers. The bottom of each draft mark indicates the draft. For example, if a waterline touches the bottom of “4M,” the draft is 4.0 m. 2.2.Draft Mark SegmentationThe conventional draft mark segmentation method segments draft marks by Otsu’s binarization method. It may be effective for images consisting only of draft marks and a hull, because the grayscale histogram of the image becomes bimodal. However, almost all observed images include other regions than draft marks and the hull, such as sea surface and shadows. Figures 2(a) and 2(b) show the observed image and its grayscale histogram, respectively. We captured the image from a wharf using a hand-held camera for adding camera shake effect, because surveyors often read drafts on a pitching and rolling boat. We can verify that the histogram is not bimodal due to the influence of the sea surface and shadows. Figure 2(c) shows the binary image obtained by Otsu’s binarization method, where the threshold value is 113. We see that the draft mark “2” above “2M” is not separated from the hull. 2.3.Waterline EstimationThe conventional waterline estimation detects a moving sea surface by a frame differencing technique. More concretely, it takes the difference of two consecutive frames, binarizes the difference image with threshold , and then accumulates the binary difference images during frames. Then the conventional method binarizes the horizontal mean of the accumulated binary image to segment the sea surface and regards the upper edge of the segmented sea surface as the waterline. However, if the sea surface moves slowly, we cannot accurately detect the waterline from the frame difference. Moreover, the estimated waterline tends to be the highest during the observation time. This misestimation is caused by accumulation of binary difference images. Figure 3 shows the result of the waterline estimation, where we set and . Figure 3(a) is the accumulation of binary difference images of the video sequence captured in a towing tank. The white region in Fig. 3(b) denotes the segmented sea surface. Figure 3(c) shows the estimated waterline superimposed on a photograph taken in the absence of a wave. We see that the estimated waterline is higher than the true one. 3.Proposed MethodFigure 4 shows the flowchart of the proposed method. It consists of five steps: (1) draft mark segmentation, (2) draft mark recognition, (3) waterline extraction, (4) waterline estimation, and (5) draft calculation. 3.1.Draft Mark SegmentationThe procedure of draft mark segmentation is further divided into three steps: draft mark detection, local thresholding, and removing noise segments. 3.1.1.Draft mark detectionTop-hat transform8 is one of the morphological operations for detecting white or black objects that are smaller than a structuring element. We use the top-hat transform to detect draft marks since they are thin white or black objects. The white top-hat transform for detecting white draft marks is defined by Eq. (1), and the black top-hat transform for detecting black draft marks is defined by Eq. (2): where we use a circular structuring element of a radius in pixels, is an input image, is the white top-hat image, and is the black top-hat image. The radius must be chosen to be larger than the stroke width of draft marks, i.e., 2 cm. The image is the result of the opening operation, which has the effect of filling small and thin white objects. The white top-hat image is the difference between the input image and its opening image. The image is the result of the closing operation, which has the effect of filling small and thin black objects. The black top-hat image is the difference between the input image and its closing image. Since some ships may have both white and black draft marks, we use both the white and black top-hat transforms to detect draft marks.Throughout this paper, we set , where is the height of the input image in pixels. When we choose the input image so that more than two draft marks are included, is equivalent to more than 30 cm, and is equivalent to more than 1 cm. For this reason, we can make the radius of the circular structuring element larger than the stroke width of draft marks by putting . We have applied the draft mark detection method to the image of Fig. 2(a). Figure 5 shows the result of the draft mark detection. We show only the white top-hat image, because there are only white draft marks in Fig. 2(a). We see that draft marks are roughly segmented, but they are corrupted by noise. We therefore segment the draft marks clearly by local thresholding in Sec. 3.1.2. 3.1.2.Local thresholdingThe assumption that the whole of an observed image can be classified into only two classes, i.e., draft marks and the ship’s hull, is not exactly true in practical applications, while local images around draft marks can be roughly classified into the two classes. We thus introduce a local thresholding for draft mark segmentation. More concretely, we select bounding boxes of the segments in the resulting image of the draft mark detection, and then binarize each of the local images enclosed by the bounding box with Otsu’s binarization method. The edges of the bounding box are parallel to the coordinate axes and pass through the topmost, bottommost, rightmost, and leftmost points of the segment. Figure 6(a) shows the bounding boxes of the segments obtained in Fig. 5. Figure 6(b) shows the result of the local thresholding. We see that draft marks are clearly segmented, but also that there are still noise segments, such as under water draft marks. Fig. 6Local thresholding: (a) bounding boxes of the segments shown in Fig. 5 and (b) result of the local thresholding. 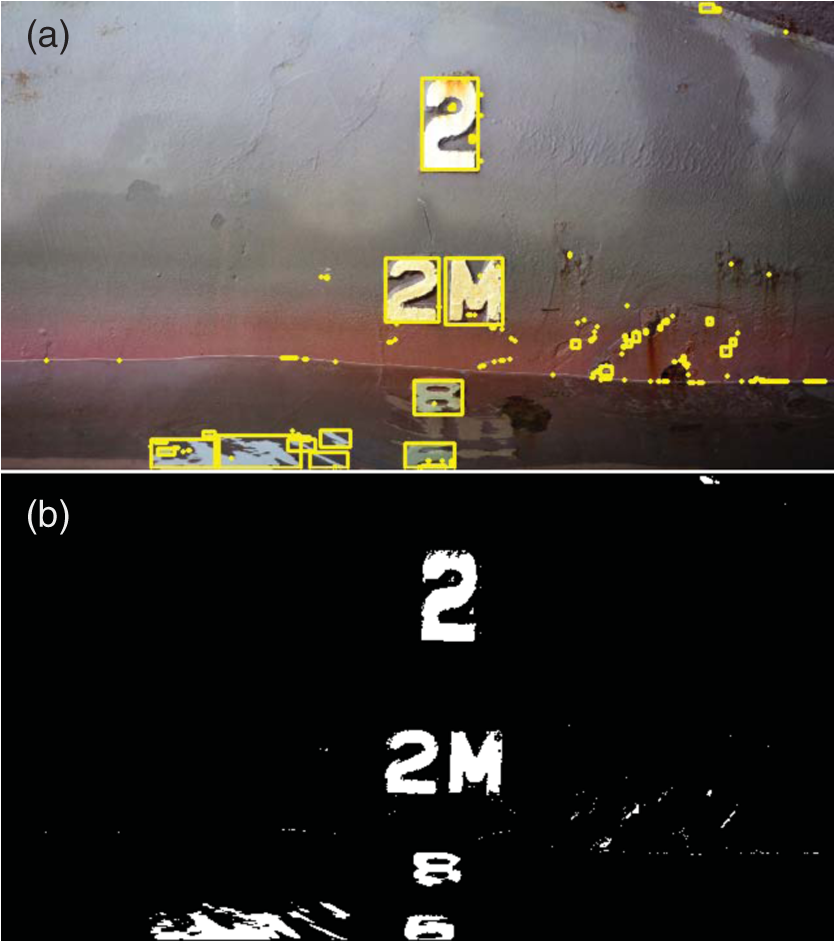 3.1.3.Removing noise segmentsWe judge whether segments in the resulting image of the local thresholding are noise or not by checking if the segment satisfies the following inequalities: where and are the height and width of the segment in pixels, respectively, and is a ratio of sides. The ratio of sides of draft mark “1” is 0.2, which is the smallest of all draft marks. We thus set . We set , considering that the height of draft marks is longer than the width in almost all cases, and the height of underwater draft marks is contracted by refraction. Meanwhile, is an area of the segment. We set , considering that too small segments are obviously noise.We have used the judging method to remove noise segments, as shown in Fig. 6(b). Figure 7 shows the result. We see that almost all noise segments are well removed. 3.2.Draft Mark RecognitionFigure 8 shows the flowchart of the proposed draft mark recognition. We shall call a string of draft marks as the draft mark string. In Fig. 7, “2M” consisting of the two draft marks “2” and “M” is the draft mark string. Recognition of the draft mark string is indispensable for draft reading. We thus distinguish the draft mark string and the single draft mark according to character connectivity9 and the predetermined size of the draft mark. More concretely, we distinguish them based on the following rules:
Although plural white or black draft mark strings may be extracted by using the above rules, only the lowest draft mark string is used for draft reading. Draft marks in the lowest draft mark string are recognized by template matching using sum of squared differences. The matching templates are the images “0” to “9” and “M,” each of which height and stroke width are 10 and 2 cm, respectively. Only when the rightmost draft mark in the lowest draft mark string is “M,” draft marks “8,” “6,” “4,” and “2” are recursively searched below until no draft mark is found or “2” is found, according to the following rules:
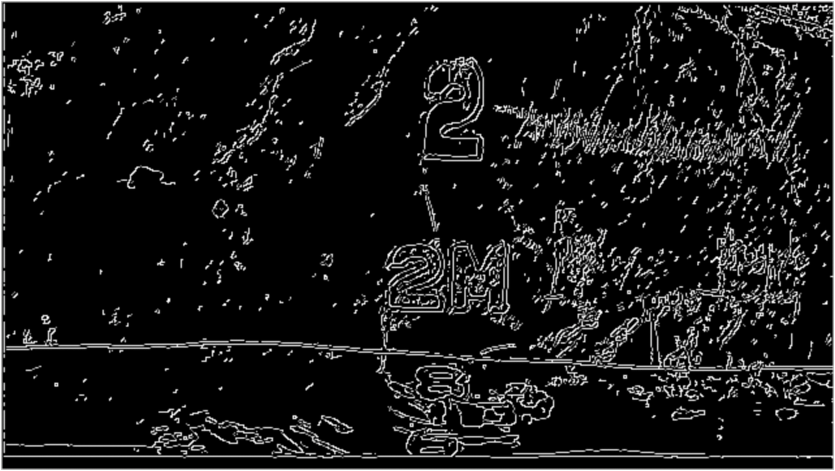
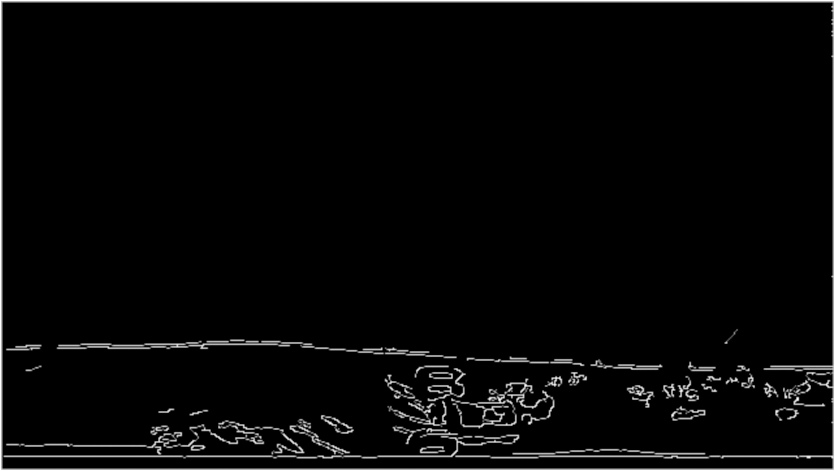
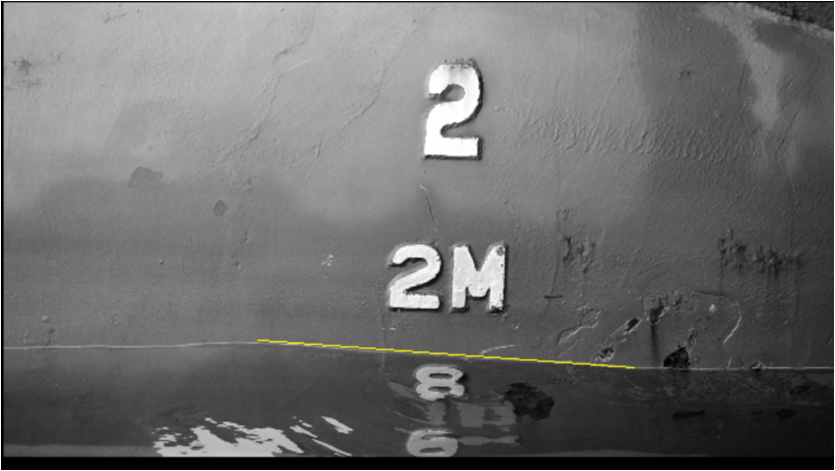
3.3.Waterline ExtractionCanny edge detection6 is one of the most widely used edge detection algorithms because of its sensitivity and high signal-to-noise ratio. We use the Canny edge detection to detect the waterline. However, the straightforward application also detects noisy edges, such as scars and projections on the hull. Noticing the property of the noisy edges, the edges on the hull remain stationary relative to draft marks. We extract the stationary edges by taking the logical conjunction of neighbor frames as follows: Here, is the result of the Canny edge detection applied to the ’th frame image of the video sequence, is the dilation image of , and and are the -coordinate and -coordinate of the reference draft mark to align , respectively. We set to the half of a frame rate, considering that the waterline vanishes if is too small. When the alignment is succeeded, and consist mainly of the stationary edges of the past and future frames, respectively, and the union of and expresses the stationary edges. Therefore, we can remove the noisy edges on the hull by taking the intersection of and as follows: where is the result of removing the stationary edges. Since the waterline is represented by a long edge, we further remove very small edges included in . More concretely, we remove the edges, each of which width is smaller than 10 in pixels.Figure 9 shows the result of Canny edge detection applied to the image of Fig. 2(a), where the thresholds of Canny edge detection are 15 and 30. Figure 10 shows the result of waterline extraction obtained by removing noisy edges. We shall call white pixels corresponding to a waterline as waterline pixels. Figure 10 contains waterline pixels, but it still contains noisy pixels, such as edges in the sea surface. We thus use the least median of squares (LMedS) method10 robust against noisy points to estimate the waterline. 3.4.Waterline EstimationWe set a search region in the resulting image of the waterline extraction, and then we use the LMedS method to fit a straight line to a set of waterline pixels in the search region. Figure 11 shows the search region. We search for white pixels downward for getting waterline pixels in the search region. The region below the lowest draft mark is not searched so as not to misrecognize the draft mark’s edge as waterline pixels. We have applied the waterline estimation to the resulting image of the waterline extraction, as shown in Fig. 10. Figure 12 shows the detected waterline pixels, and Fig. 13 shows the estimated waterline superimposed on a photograph. We see that the estimated waterline agrees with the true one. 3.5.Draft CalculationWe estimate the waterline for every frame and calculate the draft from the estimated waterlines by the following steps:
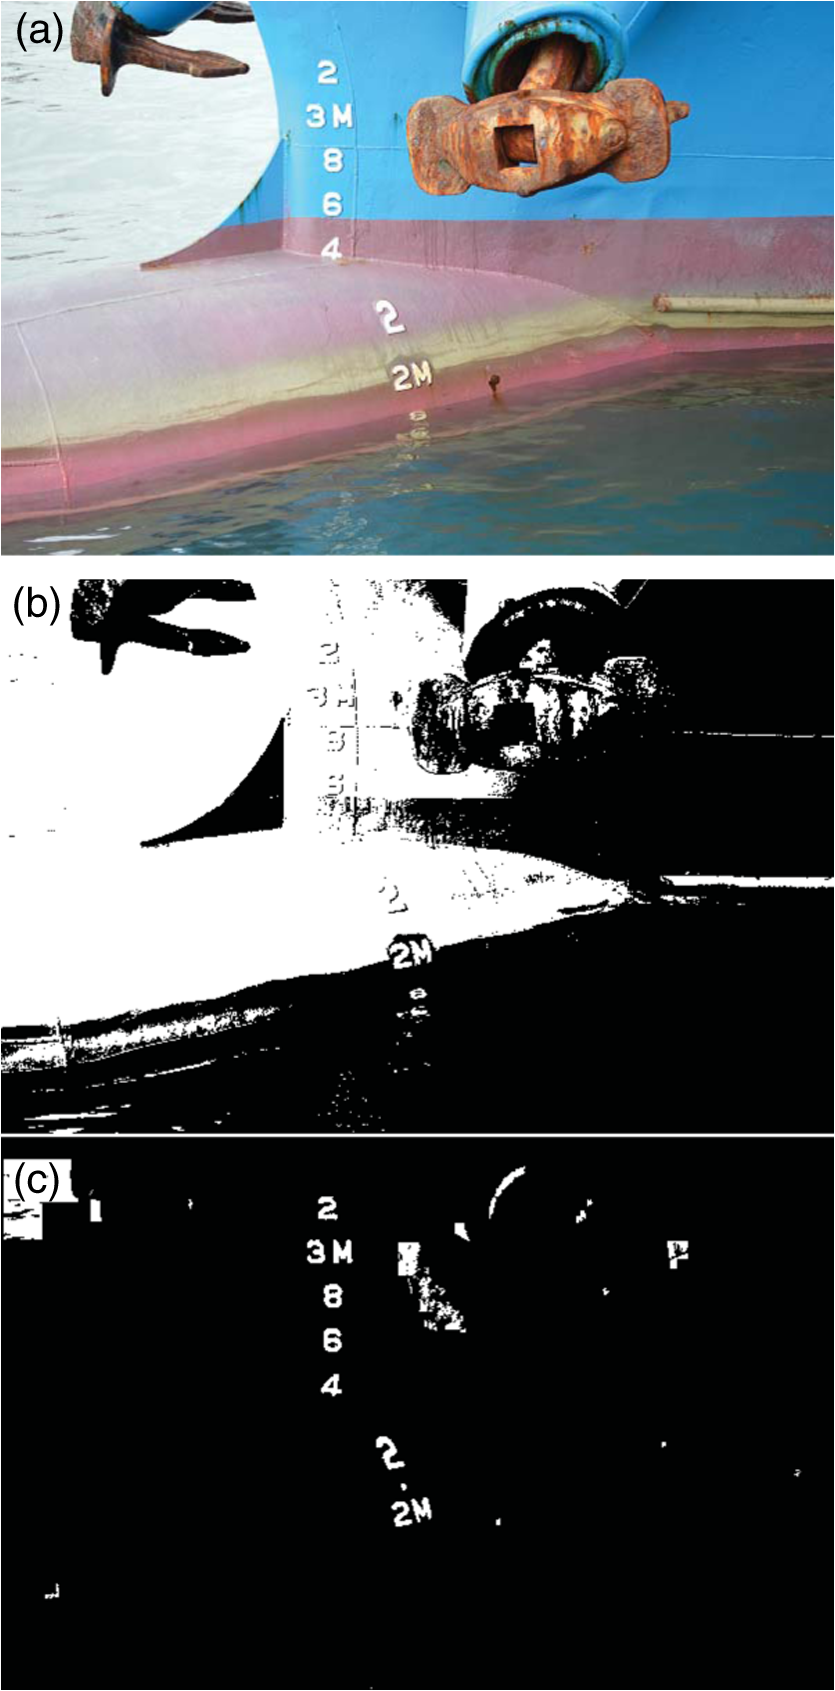
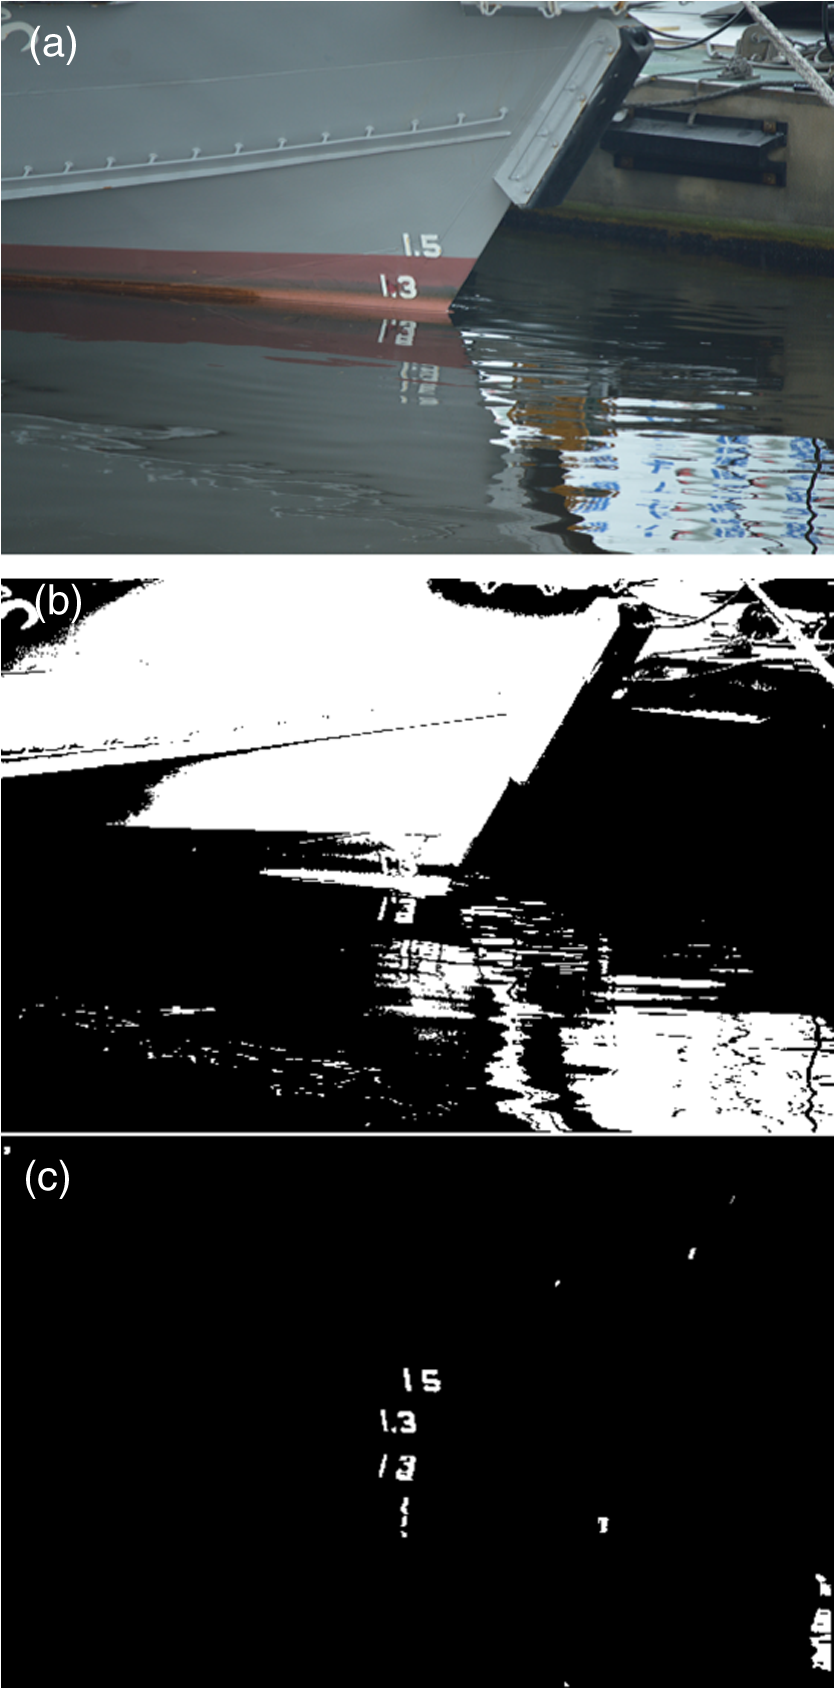
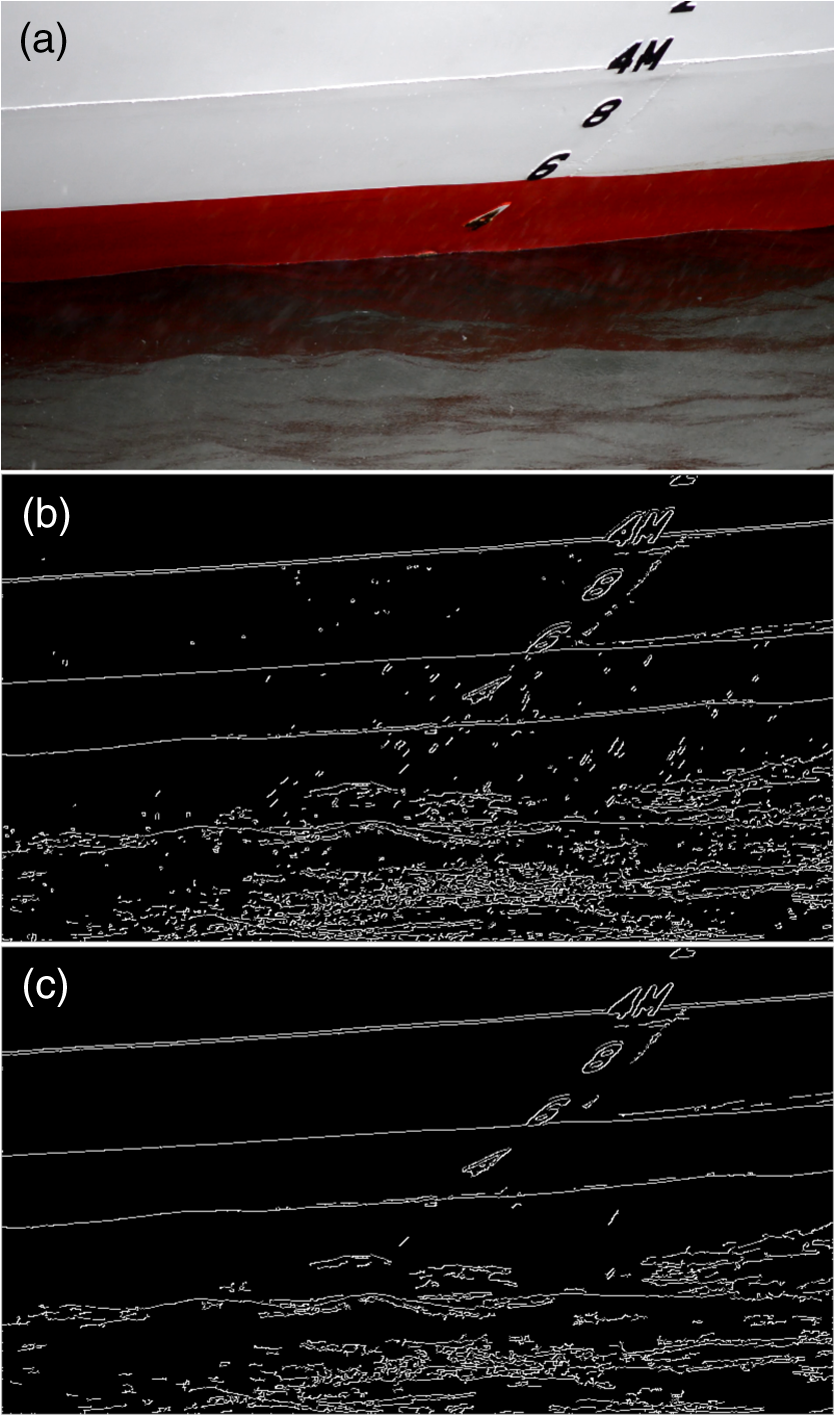
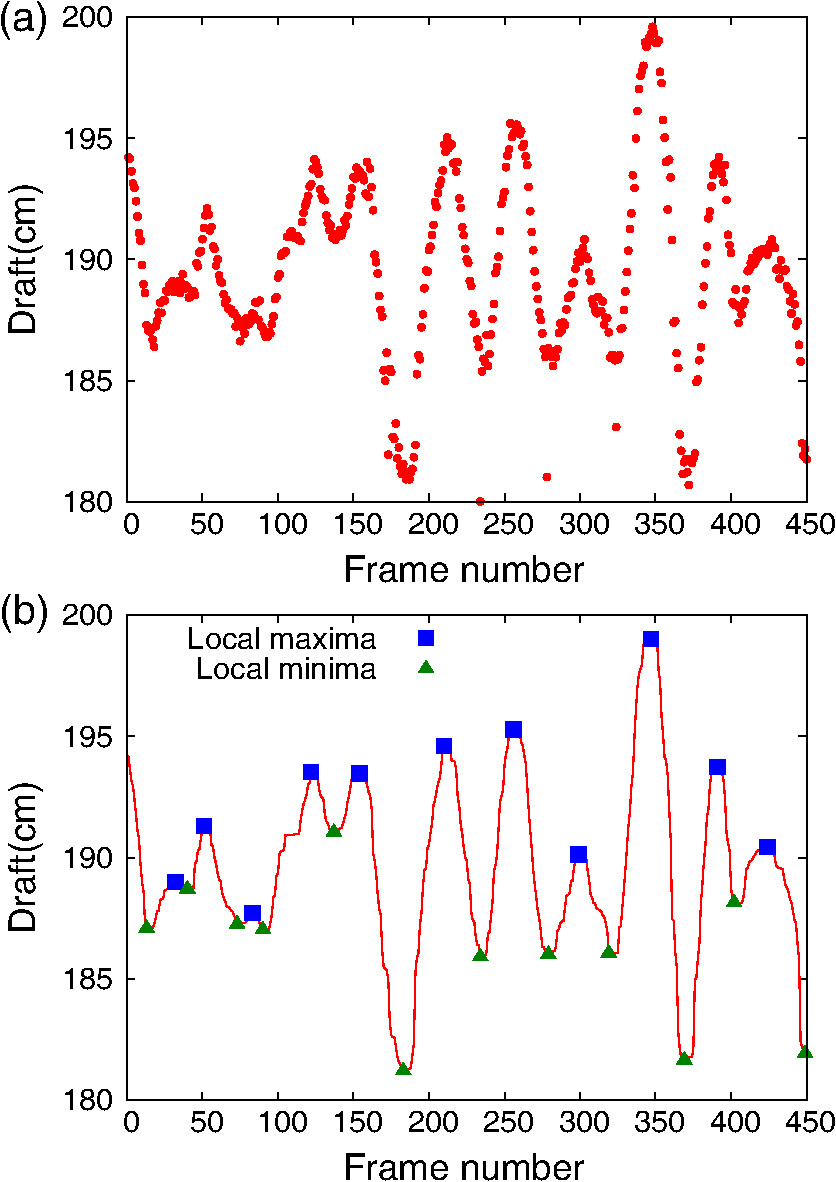
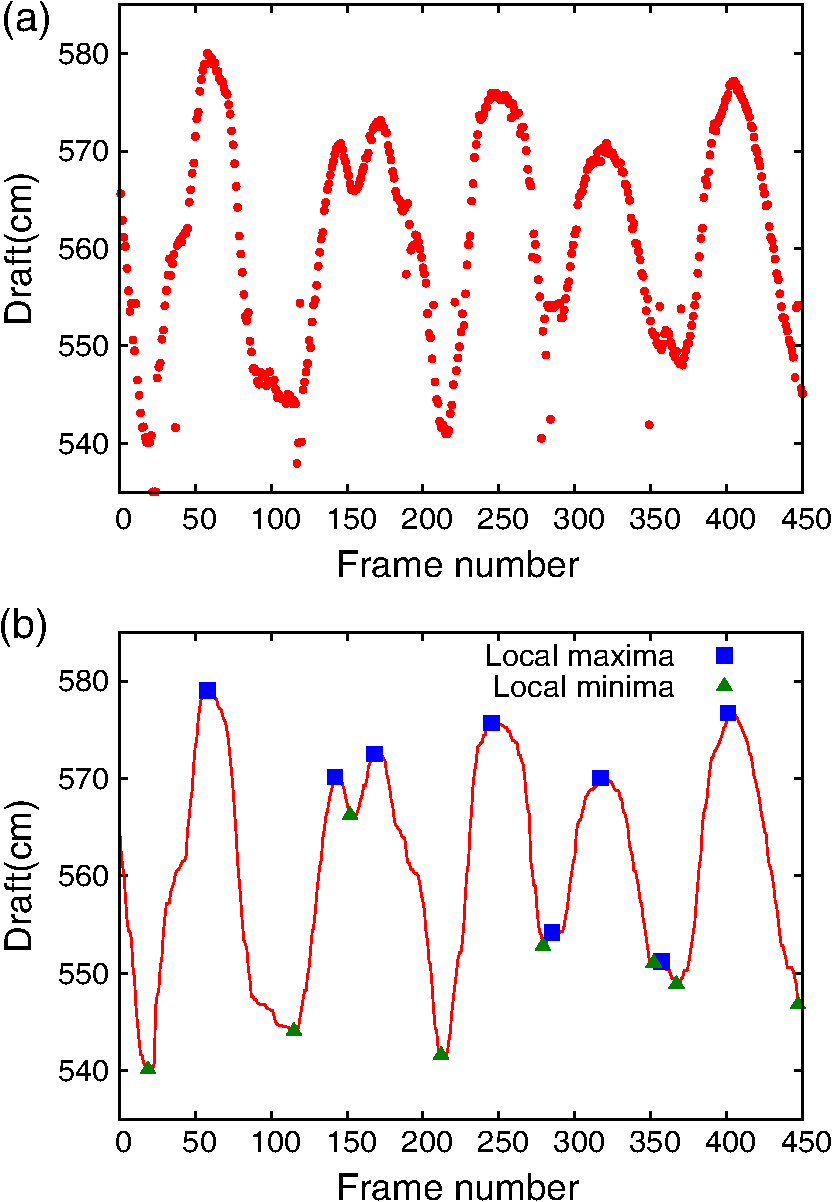
The steps 3 and 4 are employed to emulate the professional surveyors’ draft reading process11 for getting the understanding of a shipper and a receiver, although the resulting draft may be almost equal to the mean of draft readings. 4.Experiments4.1.Quality of Draft Mark SegmentationWe have used two images of Figs. 14(a) and 15(a) to test the performance of the draft mark segmentation. Figure 14(a) is a wide angle image, and Fig. 15(a) is a draft mark image of type 2, as shown in Fig. 1. Figures 14(b) and 14(c) show the results of Otsu’s binarization method and the proposed method, respectively. Few draft marks are segmented by the conventional method, while all draft marks are well segmented by the proposed method. Figures 15(b) and 15(c) show the corresponding results for Fig. 15(a). No draft mark is segmented by the conventional method, while all draft marks are well segmented by the proposed method. 4.2.Waterline Extraction in the RainWe test the performance of the proposed waterline extraction in the rain. Figure 16(a) shows a photograph taken in the heavy rain of about 10 mm/h, and Fig. 16(b) shows the result of Canny edge detection, where the thresholds are 15 and 30. We see that raindrops are also detected in addition to the waterline. Figure 16(c) shows the result of removing very small edges in the waterline extraction. We see that raindrops are removed, thus the proposed waterline extraction is effective even in the rain. 4.3.Reading in a Towing Tank4.3.1.Experimental set-upWe have evaluated the proposed method in terms of the accuracy of draft reading using a towing tank. We used a board with full-scale draft marks for imitating a hull. Figure 3(c) shows the board and the water surface in the absence of a wave. The height of draft mark “6” is 50 pixels, and the distance between the bottom of the draft mark and the waterline is 25 pixels. We thus find that the true draft is 3.55 m since the height of a draft mark is 10 cm. We generated regular waves of amplitude about 3 cm and period of 2 s and captured the scene with pixels resolution at 29.97 fps. The conventional method accumulates the binary difference of two consecutive frames during 600 frames, where we set the binarization threshold to 15. In the proposed method, we used 1800 frames (about 60 s) for draft reading, and we set the thresholds of Canny edge detection to 15 and 30, and set the window size of a median filter for waterline detection to pixels. 4.3.2.Experimental resultsFigure 17(a) shows the draft readings of the first 450 frames estimated by the proposed method. Figure 17(b) shows the draft readings after one-dimensional median filtering of window size 9, where “square“ represents local maxima and “triangle“ represents local minima. We call a frame in which draft reading is maximum/minimum within four frames from the frame as the local maximum/minimum frame. Fig. 17Draft reading of the proposed method in a towing tank: (a) draft readings and (b) after median filtering. 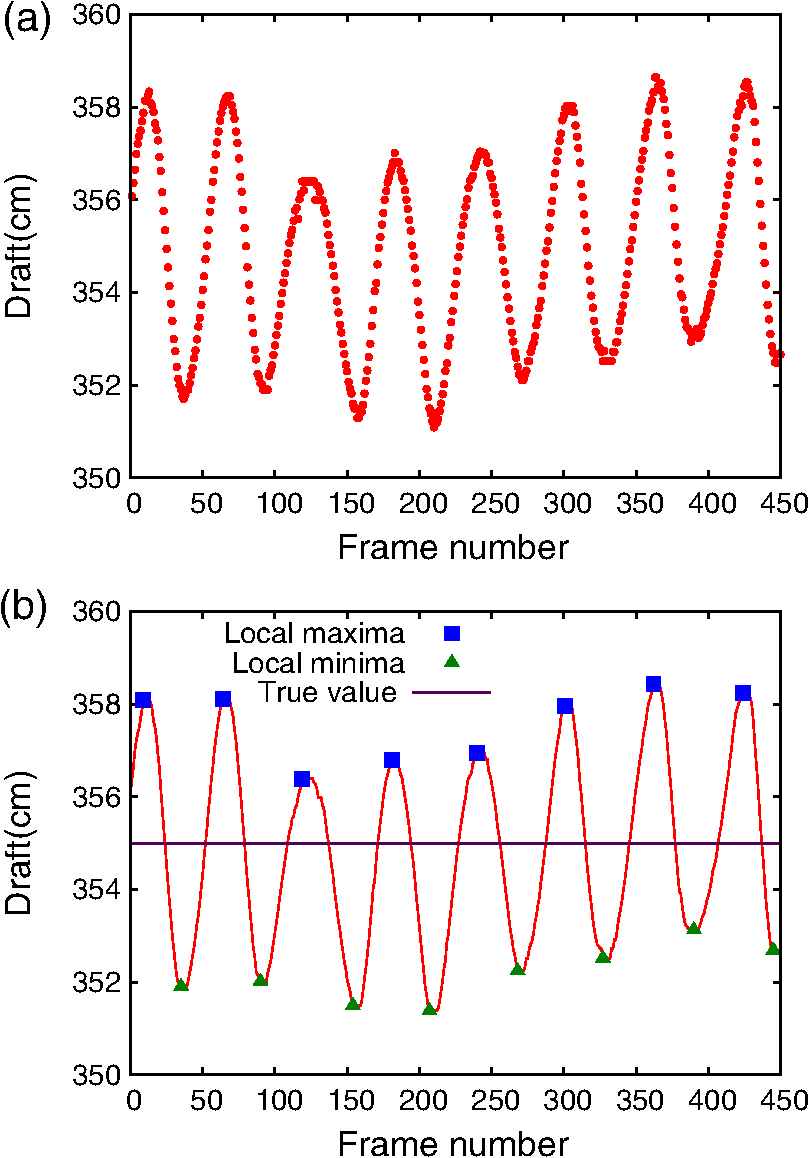 The drafts estimated by the conventional and proposed methods were 3.59 and 3.55 m, respectively. The true draft is 3.55 m. The draft reading error of the proposed method is , and it is smaller than that of the conventional method, because the estimated waterline of the conventional method tends to be the highest during the observation time. The simple mean of draft readings is also 3.55 m, which is equal to the result of the proposed method. However, we can get the understanding of a shipper and a receiver by emulating surveyors’ reading process. The total processing time of the proposed method was about 670 s on a Core i5 clocked at 3.20 GHz. The computation of the draft mark segmentation and recognition was dominant, and it took about 540 s. 4.4.Reading in a Real-World SceneWe have applied the proposed method to two video sequences captured in a real-world scene, as shown in Figs. 2(a) and 18. Both sequences are in pixels resolution at 29.97 fps. We captured the sequences from a wharf using a handheld camera for adding camera shake effect, because surveyors often read drafts on a pitching and rolling boat. We have calculated the draft for 1800 frames (about 60 s). We set the binarization threshold to 50 in the conventional method. The other parameters are the same as those of the experiment in Sec. 4.3. Figures 19(a) and 20(a) show the draft readings of the first 450 frames estimated by the proposed method. Figures 19(b) and 20(b) show the draft readings after median filtering. We see from Figs. 19 and 20 that, although some outliers are caused by the failure of draft mark segmentation and waterline estimation, the outliers are removed by median filtering. The drafts of Fig. 2(a) estimated by the conventional and proposed methods were 1.90 and 1.89 m, respectively. The true waterline in the video sequence was moving around the top of “8,” i.e., 1.9 m. Meanwhile, the drafts of Fig. 18 estimated by the conventional and proposed methods were 5.77 and 5.60 m, respectively. Although the waterline depicted in Fig. 18 is around 5.4 m, it represents only one scene of the moving waterline. The waterline in the video sequence was moving around the top of “5,” i.e., 5.6 m. We thus see that the true draft is about 5.6 m, and the proposed method is also effective in the real-world scene. The total processing time of the proposed method applied to Fig. 2(a) was about 1970 s. The draft mark segmentation and recognition took about 1390 s. Meanwhile, the total processing time of the proposed method applied to Fig. 18 was about 1310 s. The draft mark segmentation and recognition took about 1010 s. The processing time for Fig. 2(a) is longer than that for Fig. 18, because Fig. 2(a) includes larger draft marks in pixels and more noisy edges than Fig. 18. 5.ConclusionIn this paper, we have presented an image-based draft reading method for improving the accuracy of image-based draft reading. To segment draft marks, we have detected draft marks with morphological operations and binarized the local images around draft marks. Moreover, the accuracy of waterline estimation has been improved by using Canny edge detection. In addition, we can get the understanding of a shipper and a receiver by emulating surveyors’ reading process. We have tested the accuracy of the draft reading using a towing tank and have shown that the draft reading error of the proposed method was . The proposed method was also satisfactory for reading in the real-world scene. Further research will focus on increasing robustness against skewed draft marks. ReferencesR. Ive, I. Jurdana and R. Mohovi,
“Determining weight of cargo onboard ship by means of optical fibre technology draft reading,”
PROMET Traffic and Transp., 23
(6), 421
–429
(2011). http://dx.doi.org/10.7307/ptt.v23i6.177 Google Scholar
A. Okamoto et al.,
“A draught reading method by image processing with the robustness of measurement distance,”
J. Jpn. Inst. Navig., 130 135
–140
(2014). http://dx.doi.org/10.9749/jin.130.135 Google Scholar
N. Otsu,
“A threshold selection method from gray-level histograms,”
IEEE Trans. Syst. Man Cybern., 9
(1), 62
–66
(1979). http://dx.doi.org/10.1109/TSMC.1979.4310076 Google Scholar
X. Ran et al.,
“Draft line detection based on image processing for ship draft survey,”
in Proc. 2011 2nd Int. Congress Computer Applications Computer Science,
39
–44
(2012). Google Scholar
J. F. Canny,
“A computational approach to edge detection,”
IEEE Trans. Pattern Anal. Mach. Intell., 8
(6), 679
–698
(1986). http://dx.doi.org/10.1109/TPAMI.1986.4767851 ITPIDJ 0162-8828 Google Scholar
UK P&I Club,Measurement of bulk cargoes-draught surveys,”
(2008) http://www.ukpandi.com/knowledge/article/measurement-of-bulk-cargoes-draught-surveys-1093/ Google Scholar
F. Meyer,
“Iterative image transformations for an automatic screening of cervical smears,”
J. Histochem. Cytochem., 27 128
–135
(1979). http://dx.doi.org/10.1177/27.1.438499 JHCYAS 0022-1554 Google Scholar
K. Matsuo, K. Ueda and M. Umeda,
“Extraction of character string region on signboard from scene image using adaptive threshold methods,”
IEICE Trans. Inform. Syst., J80-D-2
(6), 1617
–1626
(1997). Google Scholar
P. J. Rousseeuw,
“Least median of squares regression,”
J. Am. Stat. Assoc., 79
(388), 871
–880
(1984). http://dx.doi.org/10.1080/01621459.1984.10477105 Google Scholar
W. J. Dibble and P. Mitchell, Draught Surveys, North of England P&I Association, Newcastle upon Tyne
(2009). Google Scholar
BiographyTakahiro Tsujii received his BE and ME degrees from Osaka University, Osaka, Japan, in 2014 and 2016, respectively. His research interests include image processing and machine vision. Hiromi Yoshida received his BE degree from Kobe University, Hyogo, Japan, in 2007, M. maritime sciences degree in 2009 and DEng degree in 2012. Currently, he is an assistant professor in Osaka University, Osaka, Japan. He is involved in research on pattern recognition and image processing. Youji Iiguni received his BE and ME degrees in applied mathematics and physics from Kyoto University, Japan, in 1982 and 1984, respectively, and his DE degree from Kyoto University, Japan, in 1989. He was an assistant professor at Kyoto University from 1984 to 1995, and an associate professor at Osaka University. Since 2003, he has been a professor at Osaka University. His research interest includes systems analysis. |