|
|
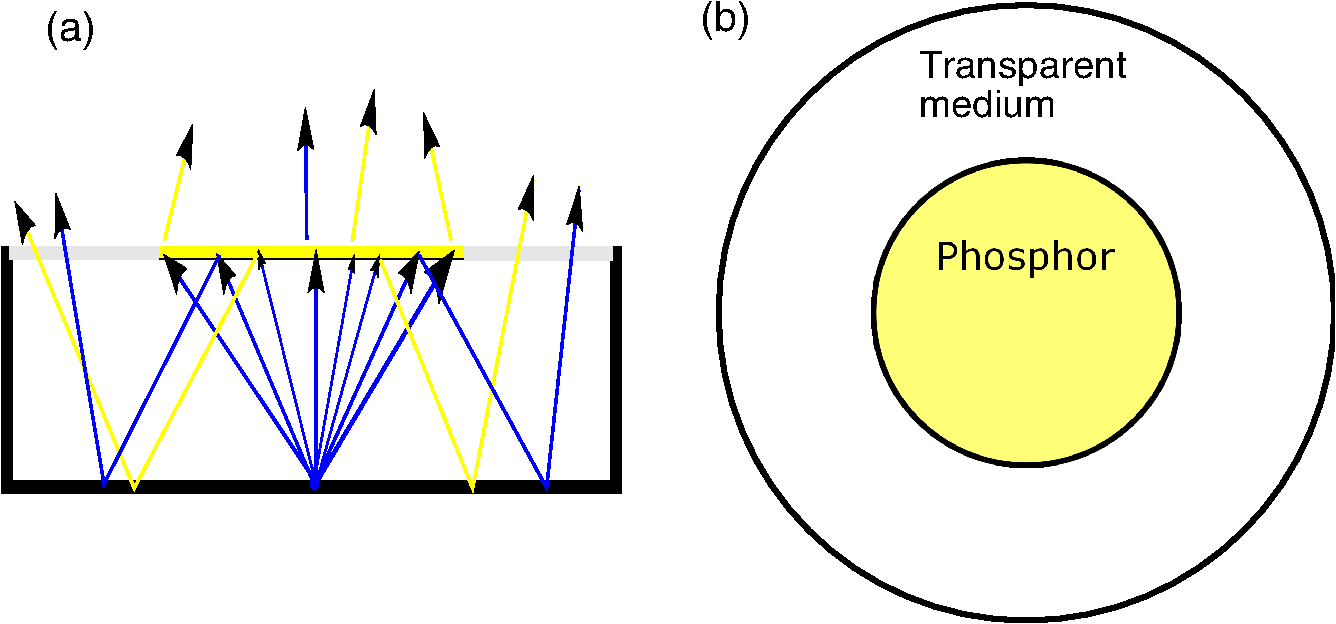
1.IntroductionIt has been demonstrated that the light extraction efficiency of a remote phosphor light-emitting diode (LED) light engine in a cylindrical configuration can only be moderately increased by varying the optical and geometrical parameters.1,2 After examining the interaction of yellow light with a phosphor plate, both Acuña et al.3 and Liu et al.4 identified that nearly 10% of phosphor-converted light recycled back toward the phosphor is absorbed by this phosphor element. Furthermore, rare earth-based phosphor is one of the components that drive up the cost of solid-state based lighting. According to the manufacturing roadmap for solid-state lighting of 2014,5 phosphors represent 8% and 18% of the total manufacturing costs for high-power and medium-power LEDs, respectively. In addition, the contribution of the phosphor to the total cost will become higher, since envisaged progress in solid-state technology addresses mainly the cost reduction of different components, but not that of the phosphor. To address the loss mechanisms and to reduce the usage of phosphor, the most intuitive solution is to avoid any reinteraction of the emitted downconverted light with the phosphor element. Attempts to address the light extraction efficiency and color uniformity of white phosphor-converted LEDs by changing the shape of the phosphor have been restricted to single-chip packages.6–10 However, the architecture of a remote phosphor LED module differs considerably regarding the size, geometry, and construction of the light source configuration, which permits completely different trends and behavior. In this paper, a remote phosphor concept in which the phosphor surface is only a portion of the total emitting surface of the remote phosphor module is proposed (see Fig. 1). The part of the emitting surface not covered by phosphor remains transparent. As a consequence, the pump source angular emission must be reduced as well. In this way, the light emitted by the pump source hits exclusively the module’s exit aperture, which is coated with phosphor. Both the blue and yellow backward-scattered light emitted by the phosphor reach the mixing cavity surrounding the pump source and are redirected toward the module’s full exit aperture, which is only partly covered with phosphor. Hence, the reabsorption of yellow light in the phosphor can be suppressed. This configuration will be referred to throughout the text as the spot concept. To find the physical dimensions and phosphor concentration that produced white light with the maximum light extraction ratio (LER) for a certain color point, a simulation model was developed and validated, as presented in Sec. 2. Using the validated model, the spot phosphor concept activated by blue-emitting LEDs is explored in Sec. 3. As an alternative to the use of secondary optics to collimate the emission of the blue-emitting LEDs, the performance of the spot phosphor concept with blue-emitting laser diodes (LDs) is presented in Sec. 4. Results and conclusions are given in Sec. 5. 2.Simulation ModelThe optical characteristics of a phosphor element comprise its luminescence properties, surface scattering, and volume scattering. The luminescence properties are its excitation and emission spectra and quantum efficiency. The surface scattering is characterized by the bidirectional scattering distribution function (BSDF), and the volume scattering is defined by the bulk scattering parameters. The BSDF is defined as the ratio of the differential spectral radiance of the sample at a particular viewing angle to the differential spectral irradiance on the sample from a particular incident angle The bulk scattering parameters comprise the absorption coefficient, the scattering coefficient, and the phase function. (Bidirectional reflectance distribution function [BRDF] and bidirectional transmission distribution function are similarly defined for reflection and transmission.) To characterize the optical characteristics of the phosphor used in the final concept, a phosphor element was considered that consisted of a YAG:Ce-silicone oil solution with a phosphor concentration of immersed in a glass cuvette with a gap between the glasses of 1.1 mm.11,12 The refractive index of the silicone is determined by the phenyl-methyl concentration. Given that the phenyl-methyl concentration is the same for both the silicone oil and the silicone encapsulant, no significant change in the optical behavior is expected.13 Due to the smooth surface of the glass, the surface scattering is avoided and the radiant intensity of the slab under irradiation can be interpreted as a combination of the Fresnel reflectance and transmittance in the specular directions, the volume scattering and the fluorescence of the YAG:Ce particles diluted in the silicone oil. The volume scattering optical parameters are obtained by solving the inverse problem of the radiative transfer equation (RTE) by means of the inverse adding-doubling (IAD) method applied to the experimental data of the transmission and reflection radiant intensities.14 Two wavelengths have been chosen, 450 and 580 nm, corresponding to the excitation and emission spectrum regions. The reflection and transmission radiant intensity values are measured using a custom-made BSDF setup (see Ref. 15 for further details). The results for short- (450 nm) and long-wavelength (580 nm) illuminations are depicted in Figs. 2 and 3. From these data, the calculated values for the total reflectance , total transmittance , and the regular transmittance for both wavelengths 450 and 580 nm are calculated and indicated in the column “measurement” in Table 1. Fig. 2Radiant intensity distribution in semilogarithmic scale of the YAG:Ce-silicone oil solution illuminated with a collimated beam with central wavelength 450 nm, FWHM 10 nm. Circle- and square-lines represent the measurement and the simulation, respectively. Transmission and reflection distribution are illustrated in (a) and (b), respectively. 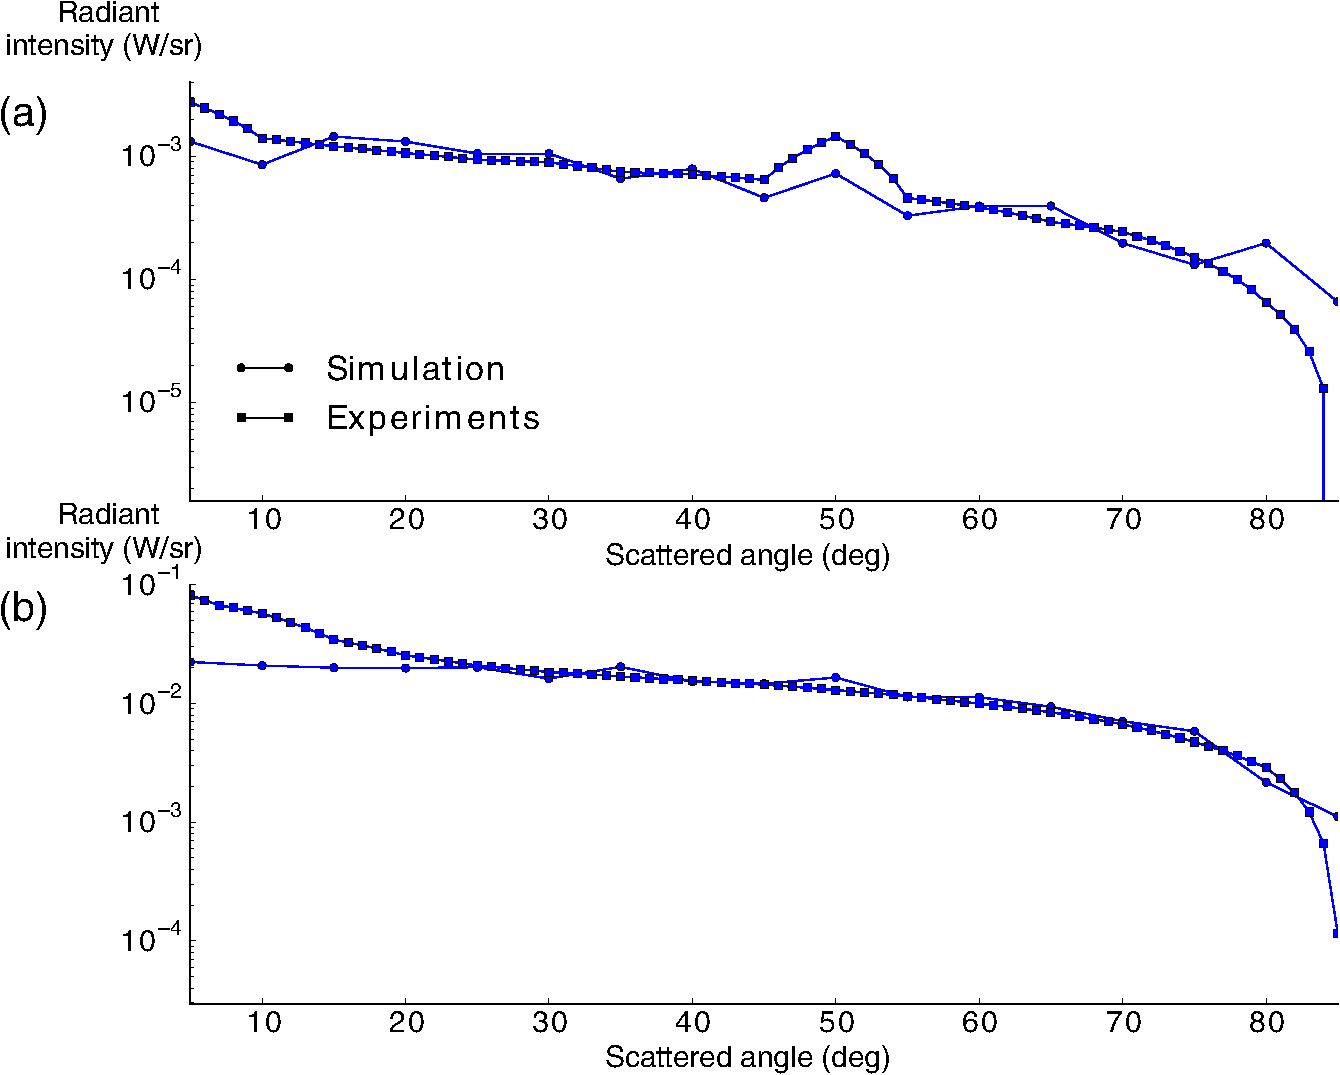 Fig. 3Radiant intensity distribution in semilogarithmic scale of the YAG:Ce-silicone oil solution illuminated with a collimated beam with central wavelength 580 nm, FWHM 10. Circle- and square-lines represent the measurement and the simulation, respectively. Transmission and reflection distribution are illustrated in (a) and (b), respectively. 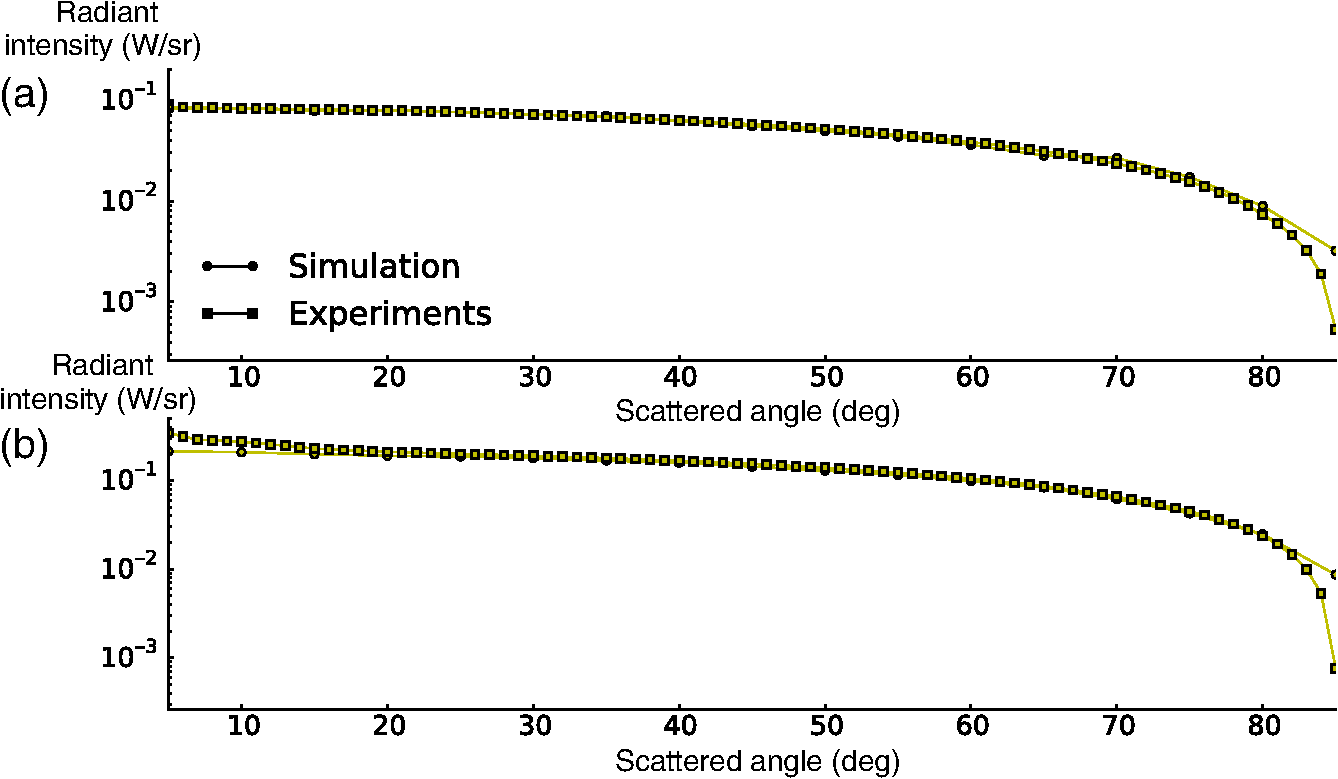 Table 1Total reflectance and transmittance values for the sample under test.
The inverse problem solution to the RTE using the IAD has been performed using a MATLAB® code developed and validated by Leyre et al.11 and updated by Córreia et al.16 Using genetic algorithms, the best-fit between experimental and calculated results is found considering 256 quadrature points in the discretization. The Gegenbauer–Kernel was adopted as the phase function17 that best fits to the experimental data with as the anisotropy factor, as the angle to the normal, and as a fitting constant.The IAD solution optimizing the match between the measurements and the simulation model based on a merit function considering both the shape and the absolute difference values of the angular-resolved transmission and reflection. The shape and the absolute differences are quantified by means of the normalized-cross-correlation function (NCC) [Eq. (3)] and the normalized-root-mean-square-error (NRMSE) [Eq. (4)], respectively, where , , , , and stand for measured, calculated, angle to the normal, radiant intensity, number of angles measured, and average, respectively The NCC varies between 0 and 1, 1 being a perfect match and 0 absence of correlation between simulation and measurement. The NRMSE gives values higher or equal to zero, zero being a perfect match. Finally, the relative error of the integrated quantities, i.e., total reflectance and total transmission, is also considered by the merit function, which is defined as where the subindices tra and ref stand for transmission and reflection, respectively.Angular-resolved results of reflection and transmission from the simulation are depicted for illumination with light at 450 and 580 nm in Figs. 2 and 3, respectively. The NCC and the RMSE quantifying the differences between experimental and simulation results are above 0.97 and below 5.4%, respectively. The integrated values , , and from the simulation are tabulated in Table 1 for comparison with the measured values. The obtained parameters are summarized in Table 2. These are comparable with those reported for the same phosphor material in Refs. 4, 14, and 18. These absolute values have been applied as scale factors for the relative spectral curves.19 Table 2Bulk scattering and absorption parameters obtained from the IAD calculation for the phosphor-silicone oil 50 mg/ml solution with physical thickness 1.1 mm.
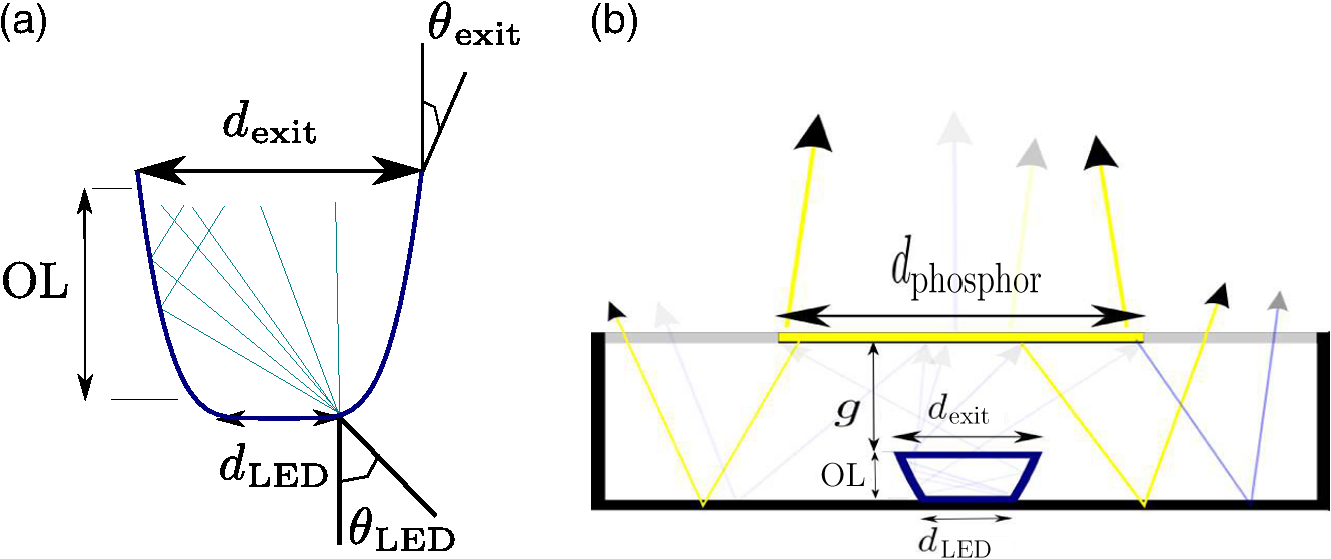
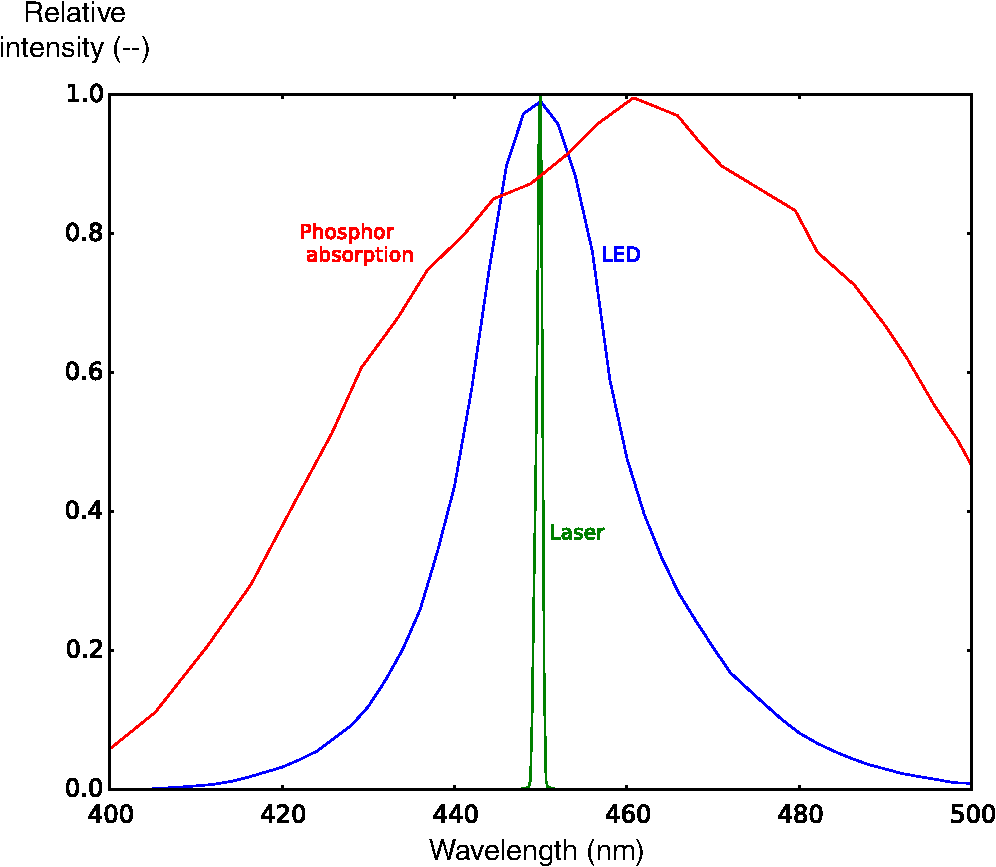
The quantum yield, defined as the ratio of converted photons to the absorbed photons, is obtained from the manufacturer Phosphor Technologies and is shown in Fig. 4. Both the absolute quantum yield value at 450 nm and the emission spectrum are measured with a custom-made integrating sphere (see Ref. 20 for further details). The resulting quantum yield value at 450 nm equates to 0.88. Fig. 4Relative absorption and emission spectra of the phosphor powder YAG:Ce in a oil-solution of measured with the quantum efficiency setup. 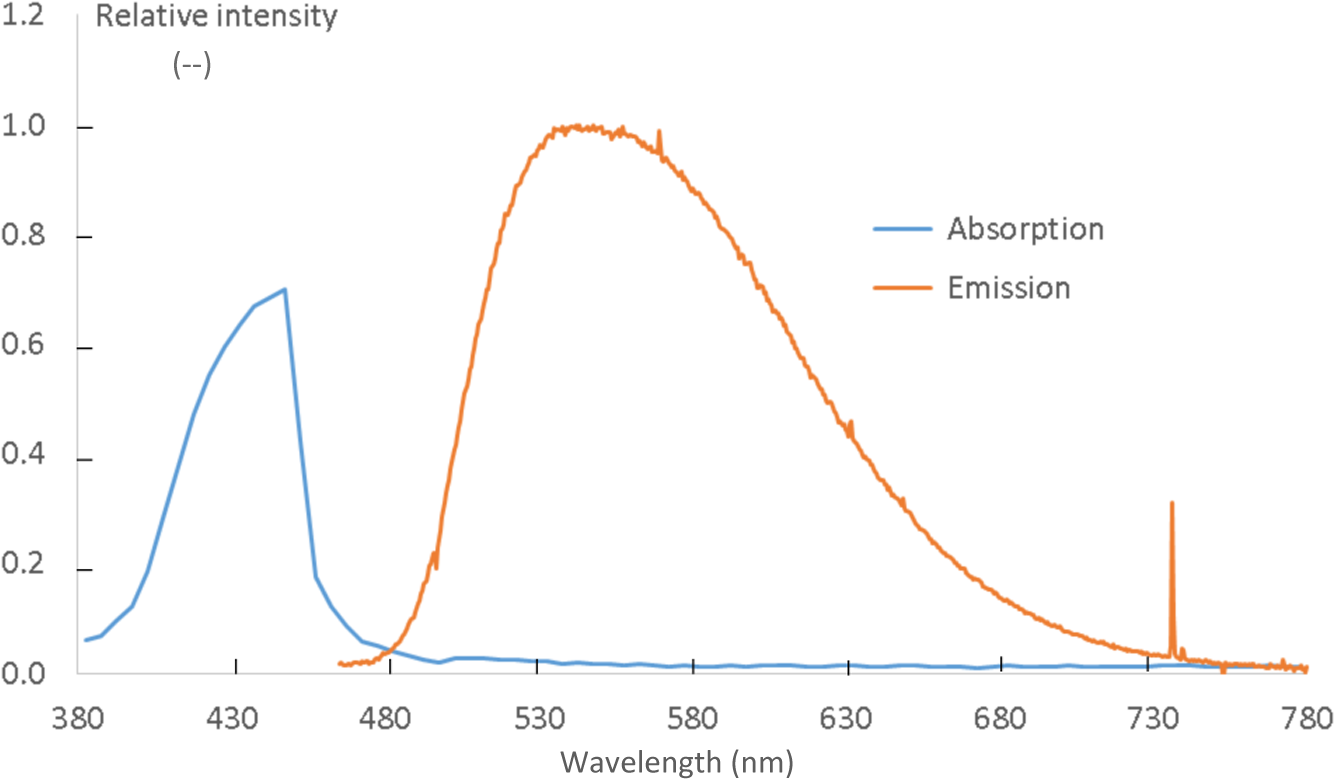 A simulation model is implemented along with the pump source and the mixing cavity to evaluate the performance of the spot phosphor concept. Both the scattering and the luminescent properties of the phosphor are modeled and simulated wavelength per wavelength using the commercial ray-tracing software LightTools. 3.Spot Phosphor Concept Activated by Blue Light-Emitting DiodesThe remote phosphor configuration that we consider consists of a cylindrical mixing cavity of 50-mm radius and 20-mm height, with blue-emitting LEDs located at the base and the phosphor element with the same radius as the mixing cavity located at the top. The inner surface of the mixing cavity consists of Mylar (polyethylene terephthalate with a total reflectivity value of 98.5%, and a rather diffuse pattern (98% is diffuse, 2% specular). The inner surface is modeled using the BRDF. The pump source is a luxeon royal blue LED from Lumileds with central wavelength at 450 nm, with emitting surface of and rather Lambertian emission. The optical emission of the pump source has been set to 1 W of radiant power and is modeled by using a ray file with five million rays. In the baseline configuration, the exit aperture is totally covered with a uniform phosphor element, while the spot phosphor concept has a reduced phosphor surface. As a consequence, in the spot concept, the pump source angular emission must be reduced as well, while part of the emitting surface remains uncovered by phosphor (see Fig. 1). However, LEDs typically emit a Lambertian intensity distribution. For this reason, the use of secondary optics to confine the flux to a smaller solid angle is required. According to the étendue conservation principle,21 the product of the spatial extent and the angular extent remains constant in an optical system. The étendue of a naked LED is calculated as the product of the small emitting area and the large angular extent. If the angular extent has to be decreased to hit only the small phosphor area, the exit aperture of the secondary optical element should be larger than the LED emitting area. The implementation of the secondary optics, in this paper, is based on reflective optics, namely an aluminum compound parabolic concentrator (CPC) (see Fig. 5), with a specular reflectance of 95%. Following the étendue conservation, the CPC exit diameter can be defined in terms of the CPC input diameter and the maximum deflection angle at the exit as The CPC height can be expressed as21 When optimizing the geometry of the spot architecture only one constraint should be satisfied. The height of the CPC “OL” plus the gap between the CPC exit and the phosphor must be equal to the height of the mixing cavity, i.e., 20 mm. In addition, the CPC exit surface projection at a distance should equate to the phosphor surface, hence, the deflection angle must comply with the following equation:The diameter of the phosphor coating has been reduced to 50 mm, the LED chip size () was set to 2.6 mm according to the silicone encapsulant on the emitting surface of the LED and the angular beam to 90 deg. The resulting dimensions of the CPC are specified in Table 3. Table 3Dimensions of the CPC in the remote phosphor module illuminated by a LED.
The merit functions used to evaluate a configuration are the LER, the luminous efficacy of radiation (LEM), the luminous efficacy (LE), the correlated color temperature (CCT), the color rendering index (CRI), the color over angle (CoA) variations (), and the relative phosphor mass. The CoA variation is quantified as the at angle with respect to and it is calculated according to the European Standard EN13032-4,22 i.e., angular intervals of 22.5 deg and 2.5 deg in the vertical and horizontal plane, respectively. The taken as reference is 0.004, according to the Energy Star program requirements.23 The thickness of the phosphor element has been adjusted such that the CCT and the CRI are the same as for the baseline configuration, 6800 K and 75, respectively. However, for any reasonable thickness compared to the commercial archetypes, the CCT was always higher due to the amount of blue light escaping through the noncoated surface after the recycling process. Therefore, the radius of the coated region was increased such that the CCT of 6800 K could be achieved with a more realistic thickness. The resulting radius and thickness were 38 and 6.0 mm, respectively. Considering a phosphor concentration of , the phosphor mass () results in 1066 mg. The reflectance of the LED emitting surface was set to 60%, according to the value reported by Cornelissen et al.24 A summary of the merit functions is presented in Table 4. Table 4Merit figures and their values for the baseline and the spot configurations. The numbers between brackets are the baseline values obtained with the LD.
For the same color point, the spot concept LER is 3% lower than for the baseline, which is also reflected on the lower values of the LEM and LE. The phosphor mass is 32% larger than the baseline counterpart. Since the phosphor element has become thicker than in the baseline, more yellow light is backward scattered after the first interaction compared to the baseline configuration. Also, as a consequence of the thicker phosphor element, the absorption losses due to limited quantum efficiency and Stokes shift after one interaction are larger in the spot concept (28%) than in the baseline (22%) configuration. The interaction of backward scattered blue light with the phosphor element is significantly less (35% of the baseline counterpart); however, the amount of recycled light is 20% larger for the spot concept. The CoA with the spot concept is slightly larger than the baseline as a consequence of the nonuniformly coated exit surface (see Fig. 6). The increases with the angle, turning more bluish at larger angles as consequence of the blue light escaping through the noncoated region in the recycling process. Fig. 6CoA variations in the space for the four tested configurations: baseline, spot LED activated, spot LED activated with filter, and spot-filter concept.  Although the spot concept seemed to be a logical approach to avoid reabsorption, it turns out that this approach does not provide a better performance and introduces various disadvantages. However, the results could be improved significantly by decreasing the phosphor thickness and using a long-wave pass thin-film filter on the phosphor noncoated region of the exit aperture. The materials used for the thin-film filter were and , with refractive indices of 2.346 and 1.384, respectively. The layers’ stacking follows the formulation , which is the typical stack of a long-wave pass filter. The merit functions for the layer thickness optimization were the cut-on wavelength (470 nm) and the incident angle (70 deg), according to the angular distribution of the rays incident onto the phosphor-free region of the exit aperture. For the design of the thin-film filter, the open source software Open Filters was used,25 which uses the needle method as the optimization process. The scheme of the resulting thin-film filter and the spectral reflectance are illustrated in Figs. 7(a) and 7(b), respectively. The spectral reflectance is depicted for three angles of incidence (AOI), 0 deg, 40 deg, and 70 deg. Fig. 7Long-wave pass filter based on thin-film coating of and : (a) schematic representation and (b) spectral reflectance for AOI of 0 deg, 40 deg, and 70 deg. 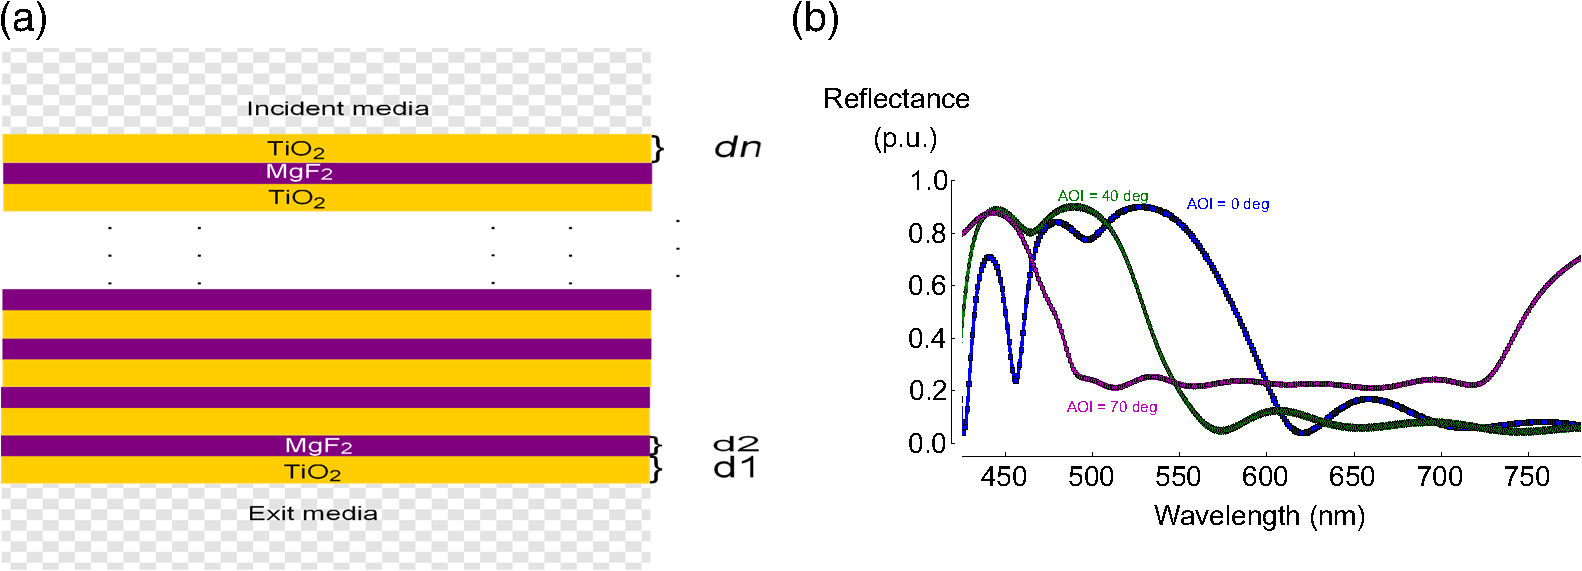 The results obtained with the spot concept combined with the filter are gathered in Table 4. The optical performance is very comparable to the baseline’s performance. The LER achieved with this configuration is 56%, very similar with the baseline. However, the amount of phosphor is significantly reduced to 77%. Regarding the of the spot concept with filter in Fig. 6, it exhibits an increase with the angle, expecting to be more yellowish at larger angles as consequence of the filter. 4.Spot Phosphor Concept Using a Blue Laser DiodeAn alternative way to implement the spot concept without using additional optics to collimate the beam is to use an LD, characterized by a narrow angular beam.26 A typical LD possesses an elliptical intensity distribution as a consequence of the active layer rectangular shape. The LD TB450B manufactured by Osram GmbH has been considered in our study. This LD typically emits light at 450 nm with an FWHM of 1.8 nm and has a maximum optical output of 1.6 W at a maximum angular divergence of 23 deg.27 The LD TB450B emitting surface possesses a diameter of 2 mm. In addition, the spectral power distribution is much narrower than that of LEDs, as can be seen in Fig. 8. Furthermore, the absence of efficiency droop constitutes another advantage, since the LD can be driven at a higher current without degrading the conversion efficiency. In order to achieve a CCT of 6800 K and a CRI of 75, the phosphor thickness should, in this case, be only 1.55 mm compared to the 6 mm when using the LED-pumped spot concept. This is attributed to the narrow FWHM of the LD spectral power distribution (see Fig. 8). Less radiation away from the phosphor absorption peak (460 nm) implies less scattered light at short wavelengths, which increases the yellow-to-blue ratio and, thereby, decreases the CCT. The LD TB450B has been modeled based on the ray file provided by the manufacturer with a radiant power of 1 W. The optical and geometrical properties of the mixing cavity have been kept the same as in the previous configuration. For a distance between the LD and the phosphor layer of 20 mm and a maximum emitting angle of 35 deg, the minimum phosphor radius should be 14 mm. The simulation results of the laser-pumped spot configuration are summarized alongside those of the two previous configurations in Table 4. To make a fair comparison, the values within brackets in the column baseline represent the baseline concept but using the LD instead of the LED. The baseline pumped with LD has been tuned such that the same color point, i.e., 6800 K, is generated. The LER of the laser-pumped spot configuration is superior to both the baseline (LED based and LD based) and the LED-pumped spot concept values. This is attributed to the smaller phosphor-coated region at the exit plane, which reduces the opportunity for the recycled light to interact again with the phosphor element. Since the laser spectral emission is concentrated in a narrow band of wavelengths localized very close to the phosphor absorption spectrum peak, the absorption and subsequent emission at longer wavelengths are higher for the laser-pumped spot configuration, which result in the higher LEM. Currently, the luminous efficacy reported for a white phosphor-converted LD at a CCT of 6000 K is about .28 It is worth mentioning that the LD state of the art possesses a lower radiant efficiency than the LED for blue light, i.e., 35% compared to 45% for a driving current of 350 mA. Unfortunately, the lower radiant efficiency of the laser compared to the LED degenerates the good photoluminescent performance of the laser-pumped spot configuration to almost the same value as the baseline concept. However, this concept illustrates the potential for using LD when higher efficiencies will be reached in the future. The advantage of the narrow spectral emission of the LD, however, constitutes a disadvantage from the CRI standpoint. The CRI of the laser-pumped spot configuration is 11 and 6 points below the baseline value and the LED-pumped spot configurations, respectively. This can be visualized via the spectral power distribution for all three configurations in Fig. 9(a). The narrow blue peak and the absence of power within the wavelength region 420 to 445 nm and 455 to 470 nm are not desirable but could be solved by adding other phosphors. Comparing the CRI for each test color sample, the largest difference appears for the color sample number 6, i.e., light blue, as depicted in Fig. 9(b). Fig. 9(a) Spectral power distribution of the baseline (blue), LED-pumped spot (green) and laser-pumped spot (red) and (b) CRI difference between the baseline and the laser-pumped spot configurations. 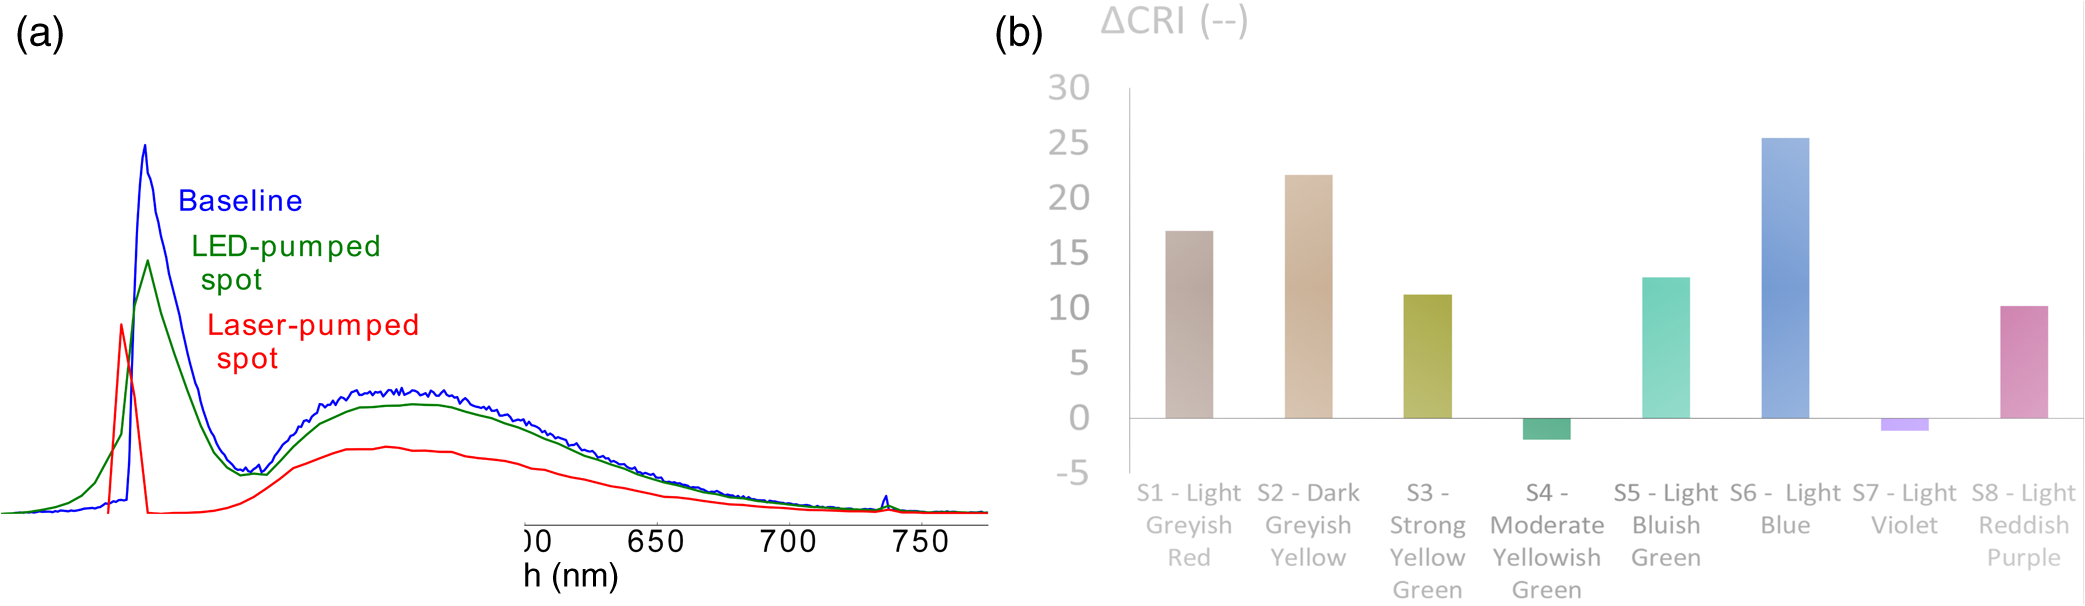 The variations for angles smaller than 60 deg are below the maximum defined in the energy star standard (),23 as observed in Fig. 6 (left). This is originating from the concentration of blue light power toward the angle close to the normal, as expected from the laser angular emission. An apparent disadvantage of concentrating the blue light onto a smaller phosphor area is that the temperature of the phosphor becomes much higher.29,30 According to literature,31 YAG:Ce-silicone white phosphor-converted LEDs can withstand phosphor luminance levels of up to without undergoing thermal quenching in the steady state. In our device, the luminance reaches a maximum value of , hence, no thermal quenching is expected to occur. For higher luminance levels, the thermal quenching present in the silicone-phosphors32 is no longer an obstacle thanks to the development of single crystal phosphors33 with higher thermal quenching temperatures. Finally, it is worth mentioning that for the laser-pumped spot concept, the amount of phosphor usage drops to only 6% and 30% of the phosphor mass required for the baseline concept pumped with LED and LD, respectively. 5.ConclusionsA simulation model of a phosphor element that considers both the surface and volume scattering, as well as the luminescence effects, have been implemented and validated with experimental data. Based on the simulation model, the performance of the spot concept architecture applied to a remote phosphor LED module has been evaluated and compared to the baseline. Results reveal that no significant improvement is achieved regarding the system’s LER; however, there is a very significant reduction in phosphor usage when the spot concept is extended with a thin-film long-pass filter. The implementation of the spot concept with a more directional light source, such as a LD, shows high potential regarding luminous efficacy and phosphor reduction but needs to be investigated in more depth to improve CRI and angular color consistency. AcknowledgmentsThis research was partially supported by Colciencias (National Department of Science, Technology and Innovation, Colombia), the Impulse Fund KU Leuven through the project “High luminance solid-state white light sources” (IMP/14/041) and IWT (Flemish agency for Innovation by Science and Technology) through the IWT-SBO project “LumiCoR.” ReferencesC. Hoelen et al.,
“Remote phosphor LED modules for general illumination: toward general lighting LED light sources,”
Proc. SPIE, 7058 70580M
(2008). http://dx.doi.org/10.1117/12.799502 PSISDG 0277-786X Google Scholar
P. Acuña et al.,
“Impact of the geometrical and optical parameters on the performance of a cylindrical remote phosphor LED,”
IEEE Photonics J., 7
(5), 1
–14
(2015). http://dx.doi.org/10.1109/JPHOT.2015.2468679 Google Scholar
P. Acuña et al.,
“Power and photon budget of a remote phosphor LED module,”
Opt. Express, 22
(S4), A1079
–A1092
(2014). Google Scholar
Z. Liu et al.,
“Measurement and numerical studies of optical properties of YAG:Ce phosphor for white light-emitting diode packaging,”
Appl. Opt., 49
(2), 247
–257
(2010). http://dx.doi.org/10.1364/AO.49.000247 APOPAI 0003-6935 Google Scholar
N. B. C. Bardsley et al.,
“Manufacturing roadmap solid-state lighting research and development,”
(2014). Google Scholar
R. Yu et al.,
“Effect of the phosphor geometry on the luminous flux of phosphor-converted light-emitting diodes,”
IEEE Photonics Technol. Lett., 22
(23), 1765
–1767
(2010). http://dx.doi.org/10.1109/LPT.2010.2085080 IPTLEL 1041-1135 Google Scholar
S. C. Allen and A. J. Steckl,
“ELiXIR—solid-state luminaire with enhanced light extraction by internal reflection,”
J. Display Technol., 3
(2), 155
–159
(2007). http://dx.doi.org/10.1109/JDT.2007.895358 Google Scholar
Y. Shuai et al.,
“Angular CCT uniformity of phosphor converted white LEDs: effects of phosphor materials and packaging structures,”
IEEE Photonics Technol. Lett., 23
(3), 137
–139
(2011). http://dx.doi.org/10.1109/LPT.2010.2092759 IPTLEL 1041-1135 Google Scholar
C. Sommer et al.,
“On the requirements for achieving angular homogeneity in phosphor converted high power flip-chip light-emitting diodes,”
Jpn. J. Appl. Phys., 48
(7R), 070208
(2009). http://dx.doi.org/10.1143/JJAP.48.070208 Google Scholar
H.-C. Kuo et al.,
“Patterned structure of remote phosphor for phosphor-converted white LEDs,”
Opt. Express, 19 A930
–A936
(2011). http://dx.doi.org/10.1364/OE.19.00A930 OPEXFF 1094-4087 Google Scholar
S. Leyre et al.,
“Determination of the bulk scattering parameters of diffusing materials,”
Appl. Opt., 52
(18), 4083
–4090
(2013). http://dx.doi.org/10.1364/AO.52.004083 APOPAI 0003-6935 Google Scholar
W. Wang and C. Li,
“Measurement of the light absorption and scattering properties of onion skin and flesh at 633 nm,”
Postharvest Biol. Technol., 86 494
–501
(2013). http://dx.doi.org/10.1016/j.postharvbio.2013.07.032 PBTEED Google Scholar
J. V. Degroot,
“Silicones for photonics,”
Silicones in Industrial Applications, 106 Dow Corning, Midland, Michigan
(2007). Google Scholar
S. Leyre et al.,
“Experimental determination of the absorption and scattering properties of YAG:Ce phosphor,”
in Light, Energy and the Environment,
(2014). Google Scholar
F. B. Leloup et al.,
“Design of an instrument for measuring the spectral bidirectional scatter distribution function,”
Appl. Opt., 47
(29), 5454
–5467
(2008). http://dx.doi.org/10.1364/AO.47.005454 APOPAI 0003-6935 Google Scholar
A. Córreia et al.,
“Determination of volume scattering parameters that reproduce the luminance characteristics of diffusers,”
Opt. Express, 24 11727
(2016). http://dx.doi.org/10.1364/OE.24.011727 OPEXFF 1094-4087 Google Scholar
S. Leyre et al.,
“Estimation of the effective phase function of bulk diffusing materials with the inverse adding-doubling method,”
Appl. Opt., 53 2117
–2125
(2014). http://dx.doi.org/10.1364/AO.53.002117 APOPAI 0003-6935 Google Scholar
M. L. Meretska et al.,
“How to distinguish elastically scattered light from Stokes shifted light for solid-state lighting?,”
J. Appl. Phys., 119
(9), 093102
(2016). JAPIAU 0021-8979 Google Scholar
P. Acuña et al.,
“Spot phosphor concept applied to the remote phosphor configuration of a white phosphor-converted LED,”
Proc. SPIE, 9889 98890U
(2016). http://dx.doi.org/10.1117/12.2225986 Google Scholar
S. Leyre et al.,
“Absolute determination of photoluminescence quantum efficiency using an integrating sphere setup,”
Rev. Sci. Instrum., 85
(12), 123115
(2014). http://dx.doi.org/10.1063/1.4903852 RSINAK 0034-6748 Google Scholar
J. Chaves, Introduction to Nonimaging Optics, Dow Corning, (2008). Google Scholar
“EN 13032-4:2015-08 Light and lighting—Measurement and presentation of photometric data of lamps and luminaires—Part 4: LED lamps, modules and luminaires,”
(2015). Google Scholar
“ENERGY STAR program requirements for solid-state lighting (SSL) products,”
(2009). Google Scholar
H. J. Cornelissen et al.,
“Injecting light of high-power LEDs into thin light guides,”
in Int. Optical Design Conf. and Optical Fabrication and Testing,
(2010). Google Scholar
S. Larouche and L. Martinu,
“OpenFilters: open-source software for the design, optimization, and synthesis of optical filters,”
Appl. Opt., 47
(13), C219
–C230
(2008). http://dx.doi.org/10.1364/AO.47.00C219 APOPAI 0003-6935 Google Scholar
H. Sun, A Practical Guide to Handling Laser Diode Beams, XII 2 ed.Dow Corning, Netherlands
(2015). Google Scholar
O. S. Osram,
“Blue laser diode 1.6 W in TO56 package,”
(2013). Google Scholar
S. Masui, T. Yamamoto and S.-I. Nagahama,
“A white light source excited by laser diodes,”
Electron. Commun. Jpn., 98
(5), 23
–27
(2015). http://dx.doi.org/10.1002/ecj.2015.98.issue-5 ECOJAL 0424-8368 Google Scholar
X. Yu et al.,
“Thermal remote phosphor coating for phosphor-converted white-light-emitting diodes,”
IEEE Trans. Compon. Packag. Manuf. Technol., 5
(9), 1253
–1257
(2015). http://dx.doi.org/10.1109/TCPMT.2015.2453397 Google Scholar
X. Luo et al.,
“Heat and fluid flow in high-power LED packaging and applications,”
Prog. Energy Combust. Sci., 56 1
–32
(2016). http://dx.doi.org/10.1016/j.pecs.2016.05.003 PECSDO 0360-1285 Google Scholar
A. Córreia, P. Hanselaer and Y. Meuret,
“An efficient optothermal simulation framework for optimization of high-luminance white light sources,”
IEEE Photonics J., 8 1
–15
(2016). http://dx.doi.org/10.1109/JPHOT.2016.2582640 Google Scholar
N. Narendran et al.,
“Solid-state lighting: failure analysis of white LEDs,”
J. Cryst. Growth, 268
(3–4), 449
–456
(2004). http://dx.doi.org/10.1016/j.jcrysgro.2004.04.071 JCRGAE 0022-0248 Google Scholar
A. Latynina et al.,
“Properties of Czochralski grown Ce, Gd:Y3Al5O12 single crystal for white light-emitting diode,”
J. Alloys Compd., 553 89
–92
(2013). http://dx.doi.org/10.1016/j.jallcom.2012.11.096 JALCEU 0925-8388 Google Scholar
BiographyPaula Acuña received her BE and MSc degrees in electronics and electrical engineering, respectively, from the National University of Colombia, Bogota, in 2009 and 2011, respectively. Since 2011, she has joined the Light and Lighting Laboratory, Ghent, to pursue her doctoral studies in association with the Katholic University of Leuven. Her current research interests include solid-state lighting and lighting design with ray-tracing and photoluminescent materials. Youri Meuret graduated in physics from Ghent University, Belgium, in 1998. He received a PhD in engineering from the same university for his research on digital projection system architectures. In 2004, he joined the Brussels Photonics Team at Vrije Universiteit Brussel, where he was responsible for a research unit that focused on optical modeling and design. He worked on solar concentrators, displays, light-emitting diode (LED)/laser illumination and smart imaging systems, often in close collaboration with SMEs and large-scale companies like BARCO and Philips. In 2013, he started working at the Faculty of Engineering Technology of KU Leuven as an associate professor. His current research interests at the Light and Lighting Laboratory include the modeling/design of light sources (LED, organic LED, and laser) and advanced illumination systems. Geert Deconinck is a full professor at KU Leuven-Department of Electrical Engineering and has a PhD in applied science. His research interest focuses on control and information technology for power systems. Examples include smart grids, lighting technology, or distributed control of distributed energy resources. He teaches topics related to industrial automation, smart distribution systems, and lighting and measurement techniques. He heads the research group Electrical Energy and Computing Architectures (ESAT/ELECTA) and is a fellow of the Institute of Engineering and Technology and a senior member of the Institute of Electrical and Electronics Engineers. Peter Hanselaer is a full professor at KU Leuven and received his PhD in solid-state physics from the University of Gent (B) in 1986. In 1997, he founded the Light and Lighting Laboratory. His main research areas are lighting, perception and appearance, optical design, light sources and optical metrology. He was recently appointed as editor of Commission Internationale de l'éclairage Division 1, as chair of the Doctoral Committee of the Faculty of Engineering Technology of KU Leuven and as representative of the KU Leuven/ESAT Technology Cluster. He is teaching master courses in photonics, optical fibers, and lighting. |
|||||||||||||||||||||||||||||||||||||||||||||||||||||||||||||||||||||||||||||||||||||||||||||||||||||||||||||||||||||||||||||||