|
|
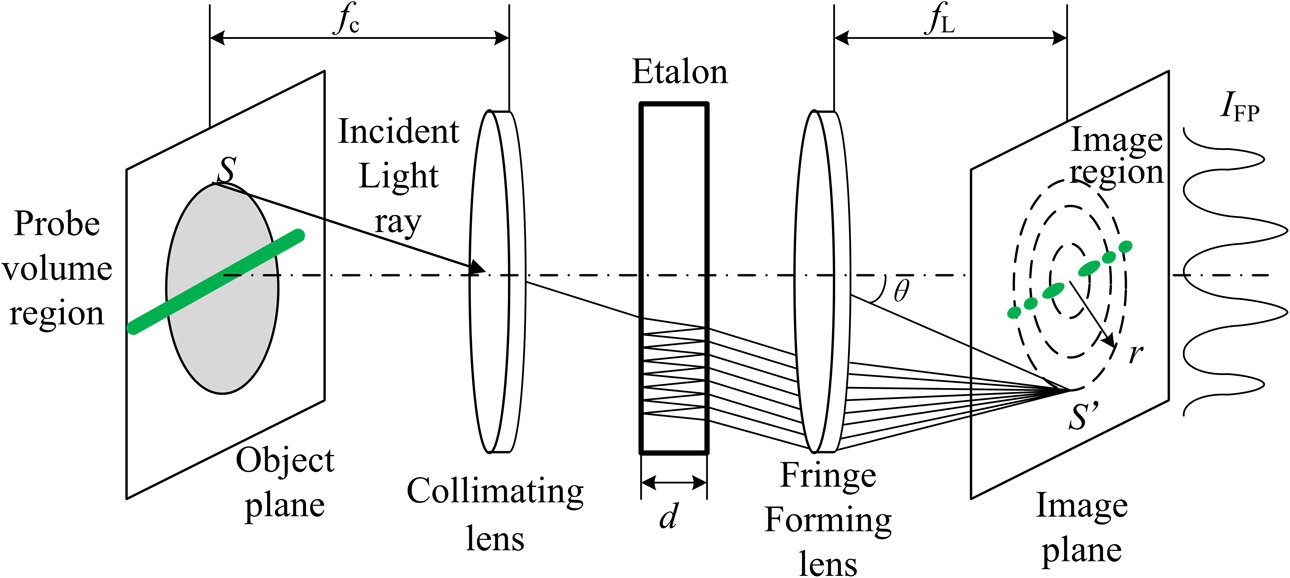
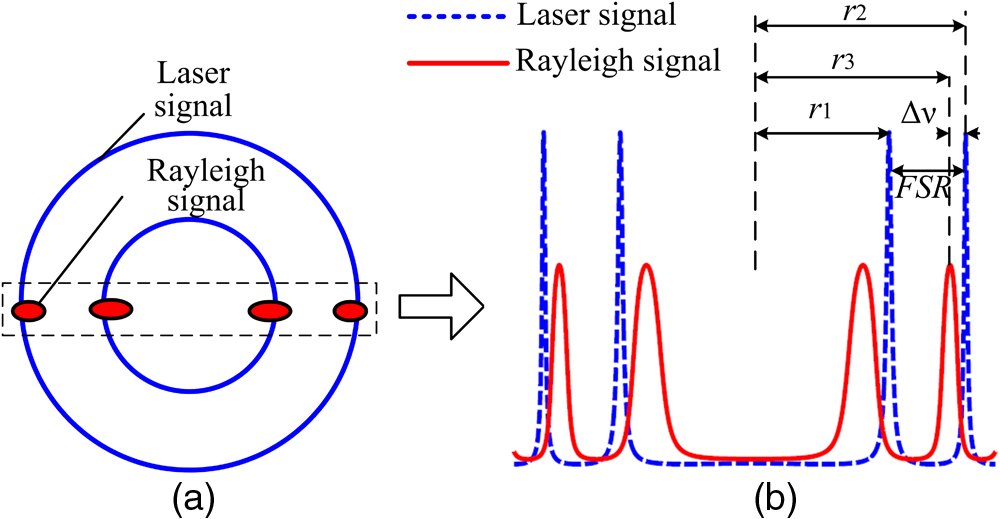
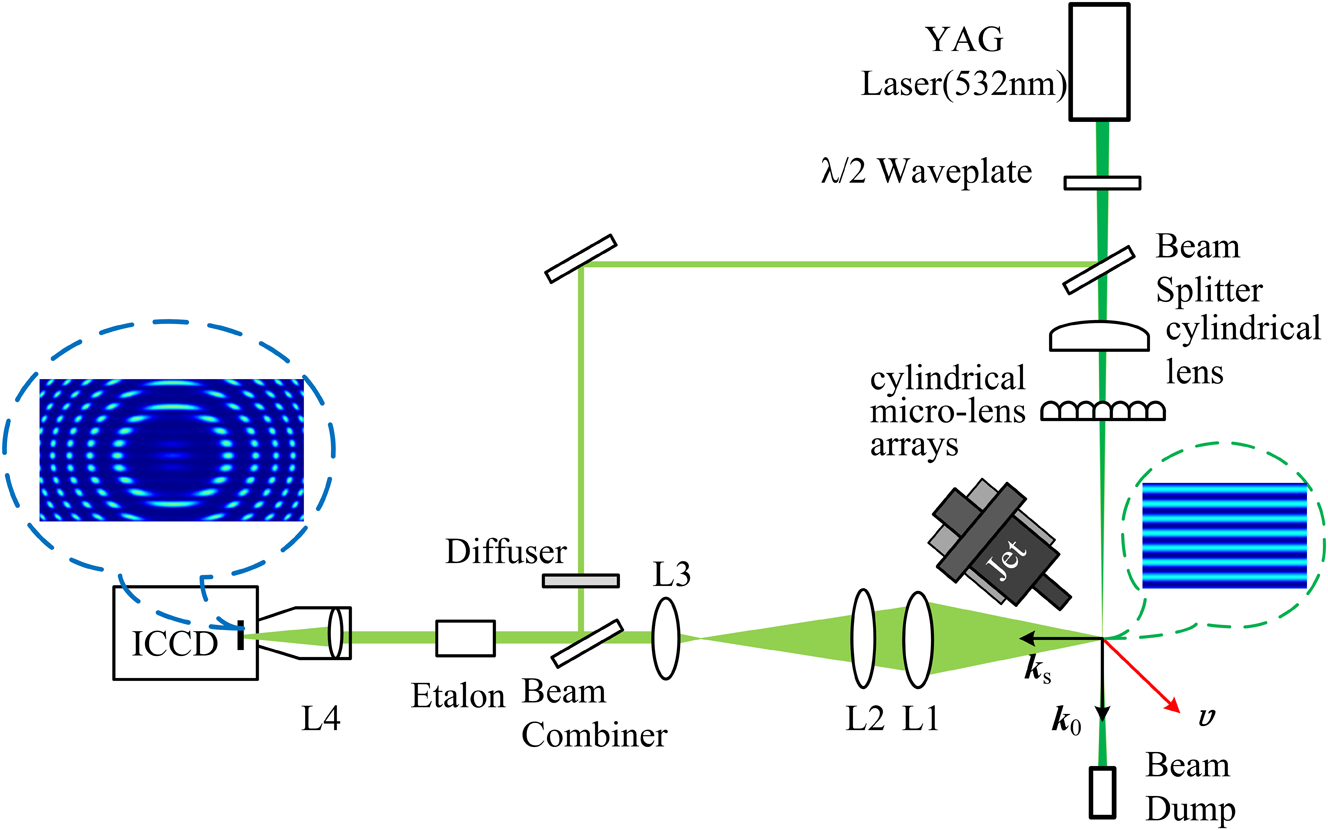
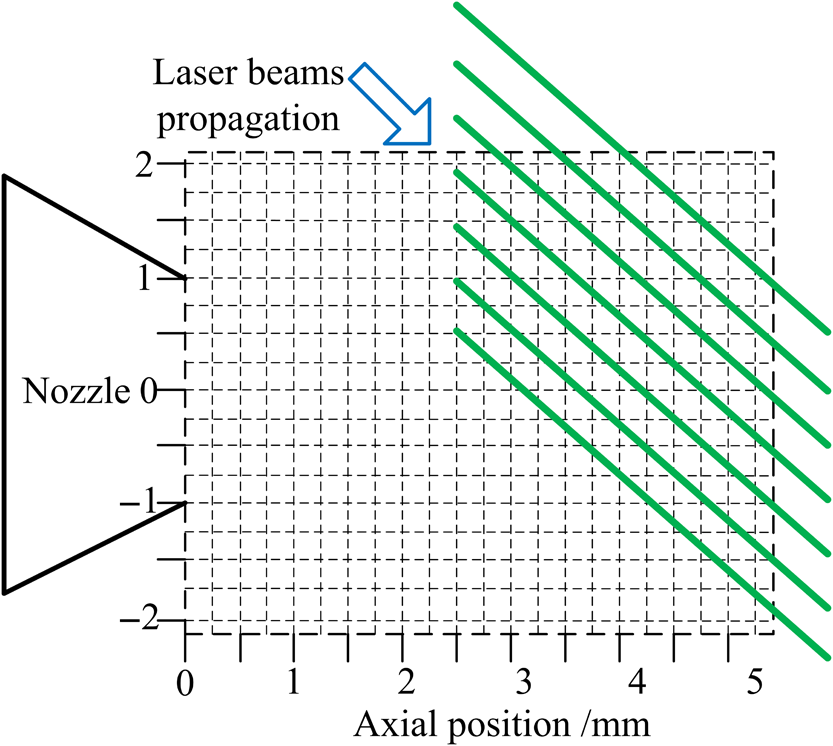
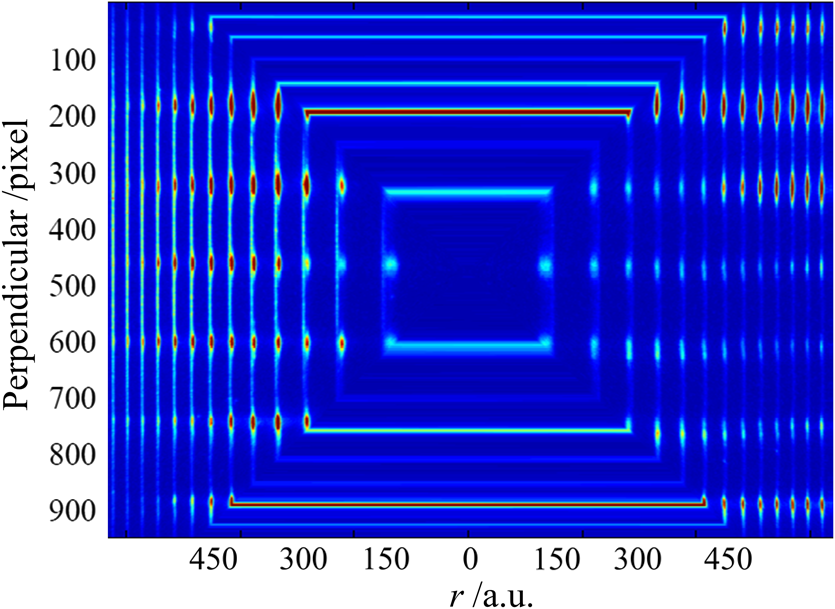
1.IntroductionWith the advantages of nonintrusive, on-beam, good temporal and spatial resolution and visualization, the laser diagnostic technique1–4 continues to be a primary tool for the understanding of fluid dynamics and combustion physics. The laser-based velocity measurement technique is one of the important branches. Recent two-dimensional (2-D) velocity measurement techniques without seeding particles have caught attention. The main reason is that commercially available velocity measurement techniques like laser-Doppler velocimetry5 and particle image velocimetry6 require the use of seed particles, the use of seed particles would bring new problems, such as window contamination, thermostability, and following performance in high temperature turbulent flows. The problem of 2-D velocity measurements without seeding particles becomes one of future laser diagnostic challenges. The Rayleigh scattering technique would be expected to become one of the ways to solve this problem. The Rayleigh scattering technique depends on the elastic scattering of light from flow molecules, without seed particles. Through detecting the Doppler frequency shift of molecular Rayleigh scattering with a Fabry–Perot etalon, the velocity of flow can be measured. Because of the adoption of the multibeam interference effect, this kind of velocity measurement technique is called interferometric Rayleigh scattering (IRS) velocimetry.7 An IRS velocimetry using an air-spaced etalon was first demonstrated to analyze the parameters of flow as a pointwise measurement technique in the 90s of the last century by Seasholtz.8 In the current study, a solid etalon in static imaging mode was used by Mielke et al.,9 which has advantages in harsh conditions and environments. Because the solid etalon and image detector can be located close to the measurement region, the more measurement points can be recorded. But then, most of the work is focused on the measurements of single-beam multipoint information.10 In order to achieve the 2-D velocity measurement, a 2-D IRS velocimetry, which uses a laser sheet as the probe laser, was developed by Seasholtz.11 Because the velocity was calculated from the change of phase, a reference image of unshifted reference laser light was first recorded to analyze the interferometer finesse and phase. A method of separately recording the reference interference signal and flow interference signal was used by Seasholtz, but this method is not suitable for measurement at extreme condition. The main reason is that the performance of the etalon is greatly influenced by the environment. For example, the change of ambient temperature can cause the movement of the interference fringes, which leads to an increase in the measurement error and even the failure of the velocity.12 Aiming at this problem, a method of simultaneously recording the reference interference signal and flow interference signal is needed. But the detection method of a laser sheet can result in the overlap of the reference interference signal and flow interference signal, which causes identification difficulty. In this paper, a 2-D IRS velocimetry using a multibeam probe laser is described. A multibeam probe laser was formed by collimating a laser sheet passing through a cylindrical microlens arrays. Laser intensity in the probe area is enhanced by focusing each laser beam. After passing the etalon, the interference image carrying the information of flow field is formed at the multibeam laser probe, and a reference laser interference fringe with no frequency shift would be formed at the intervals of the multibeam laser probe. Then, the reference interference signal and flow interference signal could be recorded simultaneously. 2.Working PrincipleThe working principle of the Fabry–Perot interferometer in static imaging mode is shown in Fig. 1. While the incident light ray is varied by imaging points off-axis, the etalon is said to be operated in the static imaging mode. Due to the multibeam interference effect, an interference image containing spectral information would be formed. The interference image would be a series of rings when the probe laser is an extended light source, while a series of elliptical peaks would be formed when the object is a beam line, as shown in Fig. 1. According to the corresponding relationship between object and image, each elliptical peak contains the spectral information of the corresponding probe volume region. If the incident light has a very narrow line width, the imaged intensity pattern is a delta function convolved with the Fabry–Perot instrument function defined as follows: where is the etalon finesse, , is the phase change, , , is the fringe forming lens focal length, is the radial position in the image plane, is the illumination wavelength, is the reflectivity of solid etalon coatings, is the refractive index, and is solid etalon thickness.When spectrally broadened light, such as Rayleigh scattered light, passes the solid etalon, the spectrum of the light is convolved with the Fabry–Perot instrument function. Then, the interference image contains the flow information. The interference fringe location is radially shifted and broadened by an amount related to the frequency shift and spectral shape of the scattered light. In order to detect the frequency shift, a reference image of unshifted laser light is needed. Usually, the unshifted laser lights are shaped as an extended light source. In order to simultaneously record the reference interference signal and flow interference signal, the reference light would be combined with the flow signal light by a beam combiner before passing the etalon. The spectrum can be measured over a spatial region that includes part of an interference fringe, as shown in Fig. 2. In order to convert the interference image shown in Fig. 2(a) into a spectrum, as shown in Fig. 2(b), the linearization of the concentric interference images is required. When the probe laser is a beam line, the center of the interference images is easy to determine through measuring the rings formed by the reference laser signal. But when the probe laser is an extended light source, such as a laser sheet, it is difficult to distinguish the interference rings formed by the reference laser signal or flow Rayleigh scattering signal, respectively. Replacing the laser sheet with a multibeam laser, interference rings of the zero frequency shift reference laser will be formed at the intervals of the multibeam laser probe and easy to distinguish. The results of measurement are spatially averaged over the regions shown in the Fig. 2(a) black dashed frame. After measuring the central position of each peak, as shown in Fig. 2(b), the Doppler frequency shift can be calculated as follows: where FSR is the free-spectral range, is the effective focal length of fringe forming lens, or is fringe radius of the reference laser light at points above and below the probe beam, and is the fringe radius of the Rayleigh scattering light.But, in most cases, the central position of the peak is difficult to measure directly and the nonlinear least squares fitting method13 is used to extract this information from the spectrum. A theoretical spectrum curve simulated with initial coefficients of frequency shift and irradiance intensity, and so on, would be compared with the measurement spectrum curve through optimizing these coefficients. Before fitting the spectrum, the interferometer finesse and phase must be known, which can be determined from the reference ring of the unshifted laser light. The reference image of the flow Rayleigh scattering signal could be analyzed at each subregion using the finesse and phase obtained from the reference image. The relation of the Doppler frequency shifts and velocity component is defined as follows: where is the angle between the velocity component and interaction wave vector (), and is the angle between and .After measurement results of the velocity at each subregion are obtained, the velocity field could be reconstructed through a 2-D cubic interpolation method. 3.ExperimentThe optical setup of a 2-D IRS measurement system is illustrated in Fig. 3. An injection seeded frequency-doubled Nd:YAG laser with the pulse energy 100 mJ, pulse duration 10 ns, and linewidth is used in the system. The polarization of the laser beam was changed by a half-wavelength plate. The laser beam is split into two beams. About 4% of the laser energy is used as a reference laser. The reference laser was passed through a diffuser and an extended reference light source was formed. The reference light would be combined with the flow signal light by a beam combiner and used as a reference signal to determine phase change by postprocessing. A cylindrical lens and a cylindrical microlens array are used to form a multibeam laser with 0.5-mm interval and then the vertically polarized multibeam laser beam with the wave vector is focused in a small region at the measuring location, as shown in the Fig. 3 green dashed circle. The waist of each laser beam is about 0.2 mm. The beams are oriented in the horizontal plane, at a 45-deg angle to the primary flow direction. Scattering light with the wave vector is collected at a 90-deg scattering angle, collimated by a 150-mm diameter aspheric lens (L1) with 150-mm focal length, shaped into a 20-mm diameter parallel light bundle by a 150-mm diameter aspheric lens (L2) with 500-mm focal length and a lens (L3) with 80-mm focal length, and passed through the Fabry–Perot etalon with 90% reflectivity coatings. The incident and scattering wave vectors are arranged such that the axial component of the jet velocity is measured. In the end, the multibeam interference fringe pattern is imaged onto a high-sensitivity intensified charge coupled device (ICCD) camera with a 300-mm focal length lens, typically, as shown in the Fig. 3 blue dashed circle. Each set of elliptical peaks in the flow interference image corresponds to a different measurement location in the flow. The region of measuring location is about 4 mm in height and 5 mm in length. The spatial resolution of the technique depends on the space interval of each fringe and the laser beam width at the probe volume. The space intervals of fringes are uniform, and the space interval of the fringe in the center is bigger—that is, about 75 pixels window size in processing. The spatial resolution in the experiment is about 0.5 mm in height and better than 0.3 mm in length. Experiments were carried out in a small-scale Mach 1.5 jet facility in order to validate the technique in a noisy environment. Figure 4 shows the schematic of measurement locations. 4.Results and DiscussionThe typical multibeam interference image of flow is shown in Fig. 5. The image processing method consists of the linearization of the concentric interference images and the subsequent fitting analysis. The important variable is the center of the interference images. A template matching method14 is used here, which takes advantage of the known geometry of interference images to achieve a better accuracy. The interference image is mapped by reading it in the plane, where is the radius from the center and is the perpendicular height of the image, using the original coordinate as the new coordinate. The transformed image is shown in Fig. 6. The transformed image, as shown in Fig. 6, can be processed by binning the lines in a single average spectrum around a chosen perpendicular height. The least square method was used in the fitting process. A theoretical spectrum curve based on Tenti S615 can be simulated. After the results in every point of each line were obtained, the 2-D velocity was reconstructed through 2-D cubic interpolation method. Figure 7 shows the results of the multibeam velocity measurement resolved from the region, as shown in Fig. 6. The velocity in the flow center is about . The reconstructed results are in accordance with the characteristic of flow. Fig. 7Typical results of the multibeam velocity measurement: (a) measurement results and (b) reconstructed results. 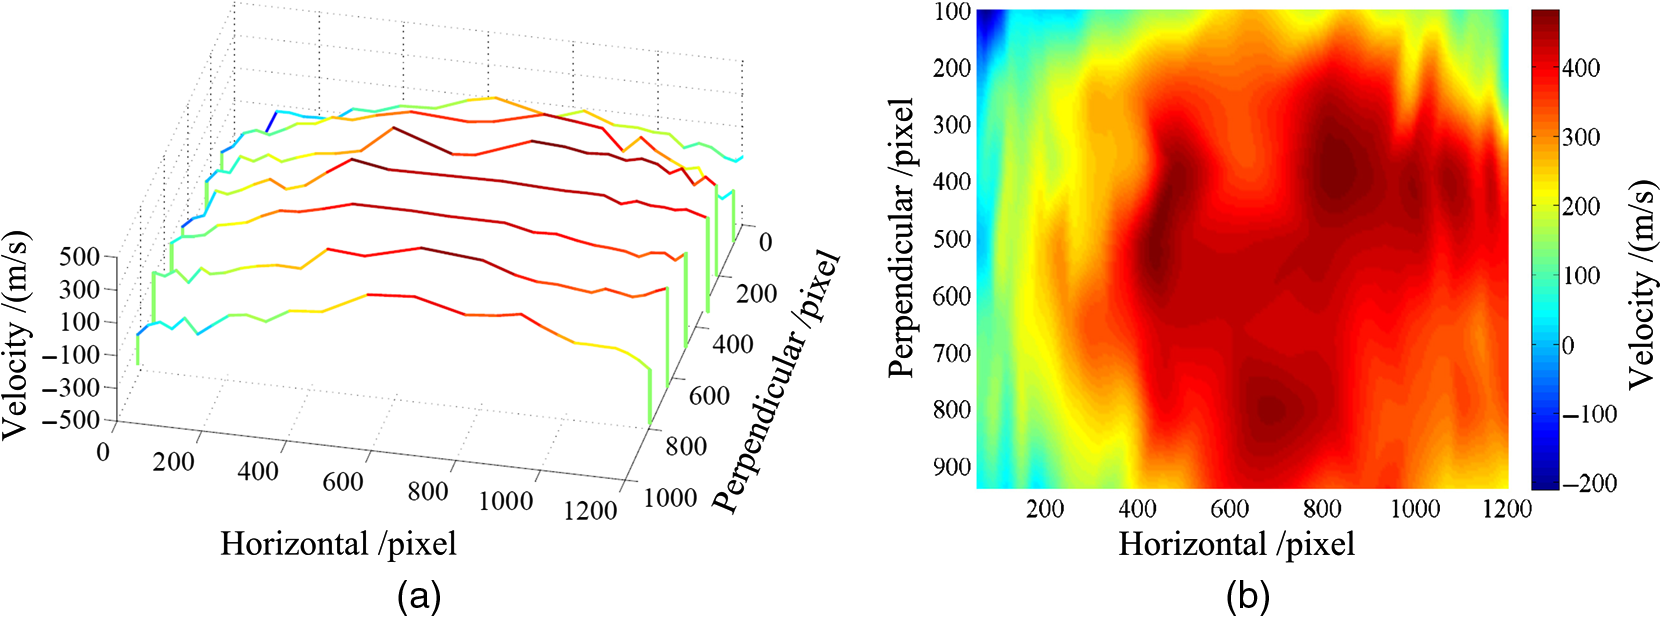 According to Eq. (3), the measurement uncertainties can be given by where , , .The measurement accuracy of laser wavelength is about 0.056 pme in 532 nm, and the measurement accuracy of angle between and is about 0.1 deg. The corresponding uncertainties are 0.1% and 0.025%, respectively, which are relatively small. The measurement uncertainty of Doppler frequency shifts is the major source of error, which comes from the misalignment degree of the Fabry–Perot interferometer and camera system, measurement error of the interference images center, and the fitting standard deviation. The first two items can be characterized by measuring the verticality of transformed line of the reference light ring. The corresponding uncertainty is about 2.2% in the flow center, and that is about 4.9% in the air mixed layer. The fitting standard deviation is defined as follows: where is the Jacoby matrix of fitting function and is the residual between fitting function and measured curve. The corresponding uncertainty is about 0.5%. So, the maximum uncertainty of velocity measurement is about 5%.5.ConclusionA 2-D velocity measurement technique using a multibeam probe laser, aspherical lens collection optics, and a solid Fabry–Perot etalon was set up. The measurement of velocity was determined by detecting the frequency shift between the elliptical interference peak of the flow and the ring of the unshifted laser light. A template matching method was used to achieve the center of the interference images. Nonlinear least squares analysis based on a kinetic theory model of Rayleigh scattering was used to obtain the velocity information from the measured spectrum. Using the multibeam probe laser, multibeam measurement results of the velocity can be obtained, which can be used to reconstruct the 2-D velocity. The velocity in the flow center is about . The reconstructed 2-D fields are limited to the spatial resolution of this technique. The spatial resolution of the 2-D IRS velocimetry with multibeam probe laser depends on the space interval of each fringe and the laser beam width at the probe volume. The spatial resolution in the experiment is about 0.5 mm in height and 0.3 mm in length. AcknowledgmentsThe authors gratefully acknowledge the financial support for this work provided by the National Science Foundation of China under the Grant No. 91541203. ReferencesR. S. Barlow,
“Laser diagnostics and their interplay with computation to understand combustion,”
Proc. Combust. Inst., 31 49
–75
(2007). http://dx.doi.org/10.1016/j.proci.2006.08.122 Google Scholar
F. Vestin and P.-E. Bengtsson,
“Rotational CARS for simultaneous measurements of temperature and concentrations of , , CO, and demonstrated in a CO/air diffusion flame,”
Proc. Combust. Inst., 32 847
–854
(2009). http://dx.doi.org/10.1016/j.proci.2008.06.027 Google Scholar
I. Boxx et al.,
“3 kHz PIV/OH-PLIF measurements in a gas turbine combustor at elevated pressure,”
Proc. Combust. Inst., 35 3793
–3802
(2015). http://dx.doi.org/10.1016/j.proci.2014.06.090 Google Scholar
R. S. Okojie et al.,
“An overview of NASA hypersonic experimental diagnostic and instrumentation technologies for ground and flight testing,”
in 16th AIAA/DLR/DGLR Int. Space Planes and Hypersonic Systems and Technologies Conf.,
(2009). Google Scholar
D. K. Heist and I. P. Castro,
“Point measurement of turbulence quantities in separated flows-a comparison of techniques,”
Meas. Sci. Technol., 7
(10), 1444
–1450
(1996). http://dx.doi.org/10.1088/0957-0233/7/10/015 MSTCEP 0957-0233 Google Scholar
R. J. Adrian,
“Particle-imaging techniques for experimental fluid mechanics,”
Annu. Rev. Fluid Mech., 23
(01), 261
–304
(1991). http://dx.doi.org/10.1146/annurev.fl.23.010191.001401 ARVFA3 0066-4189 Google Scholar
D. Bivolaru et al.,
“Single-pulse multi-point multi-component interferometric Rayleigh scattering velocimeter,”
in 44th AIAA Aerospace Sciences Meeting and Exhibit,
(2006). Google Scholar
R. G. Seasholtz,
“Fiber optic coupled Rayleigh scattering diagnostic for point measurement of gas density, velocity and temperature,”
in 34th AIAA/ASME/SAE/ASEE Joint Propulsion Conf. & Exhibit,
(1998). Google Scholar
A. F. Mielke, K. A. Elam and C. J. Sung,
“Rayleigh scattering diagnostic for measurement of temperature, velocity, and density fluctuation spectra,”
in 44th AIAA Aerospace Sciences Meeting and Exhibit,
(2006). Google Scholar
A. F. Mielke, K. A. Elam and M. M. Clem,
“Multiple-point mass flux measurement system using Rayleigh scattering,”
in 47th AIAA Aerospace Sciences Meeting Including The New Horizons Forum and Aerospace Exposition,
(2009). Google Scholar
R. G. Seasholtz,
“Instantaneous 2D velocity and temperature meausurements in high speed flows based on spectrally resolved Rayleigh scattering,”
in 33rd Aerospace Sciences Meeting and Exhibit,
(1995). Google Scholar
M. M. Clem, A. F. Mielke-Fagan and K. A. Elam,
“Study of Fabry-Perot etalon stability and tuning for spectroscopic Rayleigh scattering,”
in 48th AIAA Aerospace Sciences Meeting Including the New Horizons Forum and Aerospace Exposition,
(2010). Google Scholar
D. Marquardt,
“An algorithm for least squares estimation of nonlinear parameters,”
SIAM J. Appl. Math., 11 431
–441
(1963). http://dx.doi.org/10.1137/0111030 SMJMAP 0036-1399 Google Scholar
M. C. Ramsey and R. W. Pitz,
“Template matching for improved accuracy in molecular tagging velocimetry,”
Exp. Fluids, 51 811
–819
(2011). http://dx.doi.org/10.1007/s00348-011-1098-y Google Scholar
G. Tenti, C. D. Boley and R. C. Desai,
“On the kinetic model description of Rayleigh-Brillouin scattering from molecular gases,”
Can. J. Phys., 52
(4), 285
–290
(1974). http://dx.doi.org/10.1139/p74-041 CJPHAD 0008-4204 Google Scholar
BiographyWang Sheng graduated with a master’s degree in physical electronics at Northwest Institute of Nuclear Technology in 2008, studying laser spectroscopy technology. He is studying for a PhD at the University of Xi’an Jiaotong. From 2016 till now, he works as a senior engineer at Northwest Institute of Nuclear Technology, continuing work on combustion diagnostic. Si Jin-Hai graduated with a PhD in applied physics at Harbin Institute of Technology in 1994, studying nonlinear optics. From 2005 till now, he is a professor of Xi'an Jiao Tong University, doctoral supervisor, vice dean of School of Electronics and Information Engineering, and director of Shaanxi Key Laboratory of Information Photonics Technology. |