|
|
1.IntroductionThis paper reports the refractive index of infrared-transparent polycrystalline alumina (PCA) in the wavelength range 0.85 to from 296 to 498 K. Results agree with predictions made for randomly oriented grains of fully dense aluminum oxide (). Sapphire is single-crystal —the most durable, commercially available midwave infrared (3 to ) window material for applications requiring sand and rain erosion resistance or the ability to operate at elevated temperatures.1 Sapphire transmits from wavelength in the infrared to below in the ultraviolet. The crystal has threefold rotational symmetry about the -axis (the optic axis) in Fig. 1 and twofold rotational symmetry about the three directions perpendicular to .2,3 As a result of its uniaxial symmetry, the crystal exhibits two extreme values of refractive index and refracts incoming randomly polarized light into two slightly separated rays—a property called birefringence. Fig. 1Sapphire crystal showing threefold and twofold symmetry directions and cleavage faces (adapted from Refs. 1 and 2). The -axis is normal to the -plane and the -axis is normal to the -plane. The electric field of a light ray traveling along the direction oscillates perpendicular to the direction. 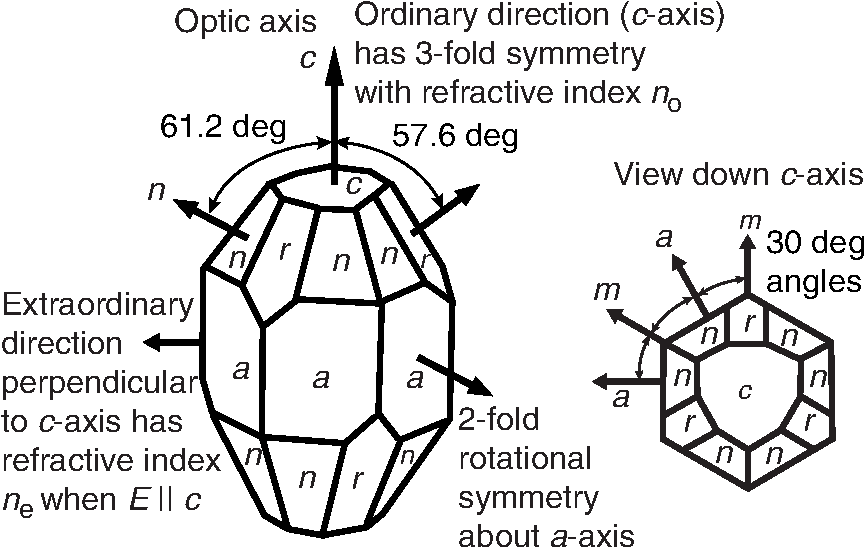 PCA consists of randomly oriented grains of (Fig. 2). A technological advantage of PCA over sapphire is that PCA can be cast in near-net shape to make shapes that would be prohibitively expensive to machine from sapphire. Historically, PCA has been an opaque, white material because light is scattered at every grain boundary where the index of refraction changes from grain to grain. Alumina with grain sizes of tens of microns scatters nearly 100% of visible light. If grain size can be kept to approximately one-tenth of an optical wavelength, optical scatter can be sufficiently low to provide some transparency. Fig. 2Scanning electron micrograph of PCA prism witness sample. Grains were highlighted by thermal etching for 2 h at 1200°C in air with heating and cooling ramp rates of . Sample was coated with gold for electron microscopy. 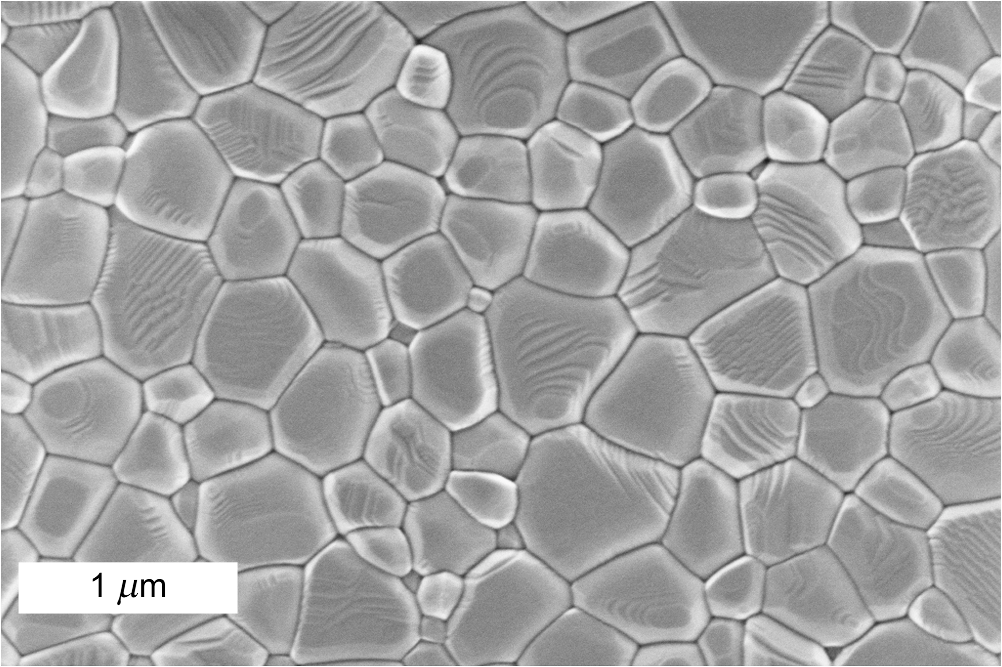 Coble was the first to make visibly translucent alumina by sintering submicron powder with an MgO sintering aid at 1900°C in or vacuum.4,5 MgO promotes a dense, uniform microstructure and inhibits grain growth. In the 1960s, General Electric Co. commercialized translucent alumina called Lucalox for high-pressure sodium lamp envelopes. This material contained 0.2 wt. % MgO and had a grain size of 20 to . The total transmittance (including scatter) at a wavelength was 60% to 75% for a thickness of 1 mm.6 In the 1970s, Peelen and Metselaar made translucent alumina with 1 to grains by hot pressing at 1400°C.7,8 Optical scatter was governed mainly by pores. Hayashi et al.9 achieved translucency with a grain size of in alumina prepared by injection molding, sintering at 1260°C, hot isostatic pressing at 1260°C at 101 MPa, and annealing in vacuum at 1150°C. In-line transmittance at wavelength increased from 63% to 78% as grain size decreased from 1.4 to . Mizuta et al.10 prepared translucent alumina with grain sizes of 0.7 to by slip casting, sintering at 1240°C, and hot isostatic pressing at 1050°C to 1400°C at 150 MPa. In-line transmittance at an unstated visible wavelength was 30% to 46%, but decreased with decreasing grain size, suggesting that a grain-boundary phase was responsible for some scatter. Godlinski et al.11 made translucent alumina with a grain size of by float packing an aqueous dispersion of powder and sintering at 1275°C. The visible in-line transmittance was only for a thickness of 0.5 mm. A major advance in the art of making transparent alumina was published by Krell et al.12–14 A powder was gel cast with solids loading up to 70 to 78 wt. %, generally containing 0.03 wt. % MgO. Samples were sintered in air at 1250°C for 2 h and hot isostatically pressed at 200 MPa at 1150°C to 1400°C. A maximum in-line transmittance of 71% at a wavelength was observed for a 0.8-mm-thick sample with a grain size of .15 At a grain size of , the in-line transmittance was 40%; and, at a grain size of , the in-line transmittance was . The observed transmittance was fit by a model in which Mie scattering occurs at boundaries of randomly oriented birefringent grains.15 In the 3- to infrared region, the transmittance of 0.8-mm-thick alumina with a grain size near was within 1% of the transmittance of sapphire.14 Parish et al.16 made PCA with a grain size of and near-theoretical transmittance at a wavelength of and a thickness of 2 mm. Bernard-Granger et al.17,18 reported more processing details, as well as thermal, mechanical, and optical properties of transparent PCA with a grain size of 0.5 to and moderate visible transparency. 2.ExperimentalTransparent PCA was made by CeraNova Corp. (Marlborough, Massachusetts). A slurry prepared from high-purity alumina powder with additives was formed into a disk and heat treated to full density with final dimensions of . The plate was subjected to four thermal anneals to minimize broad OH infrared absorption in the 2.8- to range (Fig. 3). Prisms were fabricated from this thick plate for measurement of the refractive index and flat, polished plates were made as witness samples. Fig. 3Infrared transmittance of unpolished 12-mm-thick disk from which prisms were made showing decrease of broad OH absorption from 2.8 to after successive thermal anneals. About half of the transmittance loss is due to surface scatter from the unpolished disk.  The Archimedes density was measured by the method of ASTM C329-88 (2016) for several plates of CeraNova PCA made at the same time as plates from which prisms were cut for the present work. The observed density ranged from 99.96% to 100.02% of the theoretical value of . The theoretical value is calculated for sapphire with a formula mass of and rhombohedral cell dimensions and at 26°C with six formulas per unit cell and unit cell volume .19 In agreement with our observations, Krell et al.13 stated that PCA with densities could be obtained with optimized processing. Evidence for random grain orientation in PCA was obtained from x-ray diffraction and electron backscatter diffraction from polished witness samples. X-ray diffraction peak intensities obtained with a powder diffractometer agreed with peak intensities of the reference powder pattern20 for in which powder particles are randomly oriented. Electron backscatter diffraction allows the crystallographic orientation of individual grains in a bulk sample to be measured by a suitably equipped scanning electron microscope.21,22 Grains on a polished surface are mapped from the change in grain orientation across grain boundaries. The map in Fig. 4 shows grains and the crystallographic orientation of each grain. Orientation is expressed as the angle between the normal to the grain surface and the -axis of the grain. A spatial resolution of 15 nm and an orientation resolution of 0.5 deg to 1 deg are typical. Figure 5 shows the cumulative fraction of the grains, , as a function of the grain-orientation angle, . For a random distribution of grain orientations, the theoretical value is .22 The observed distribution of grain orientations is close to the prediction for random orientation. Furthermore, the mean grain orientation for a random distribution of grains is predicted to be 57.3 deg and the observed mean orientations were 58.0 deg and 57.8 deg in two prism witness samples. X-ray and electron backscatter diffraction both confirm that the grains are randomly oriented in PCA. Fig. 4Electron backscatter diffraction map of microstructure and crystallographic orientation of individual grains of PCA prism witness sample. 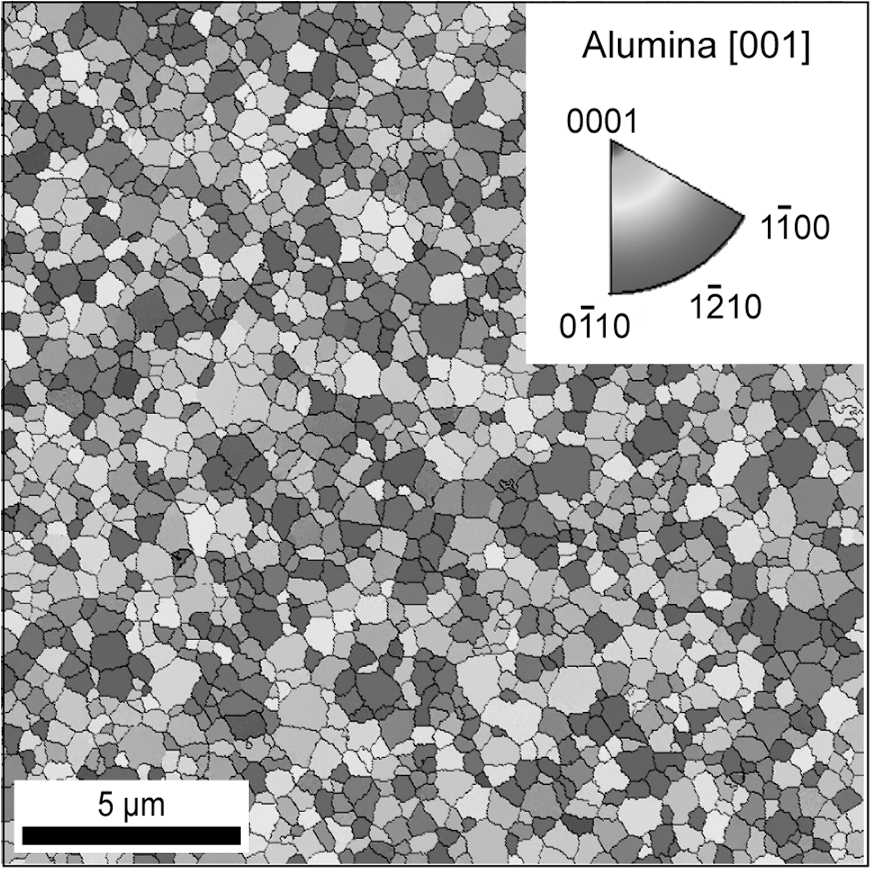 Fig. 5Cumulative distribution of 1777 grain orientations of PCA in a polished, prism witness sample measured by electron backscatter diffraction. Dashed line is theoretical curve for random distribution of grain orientations. 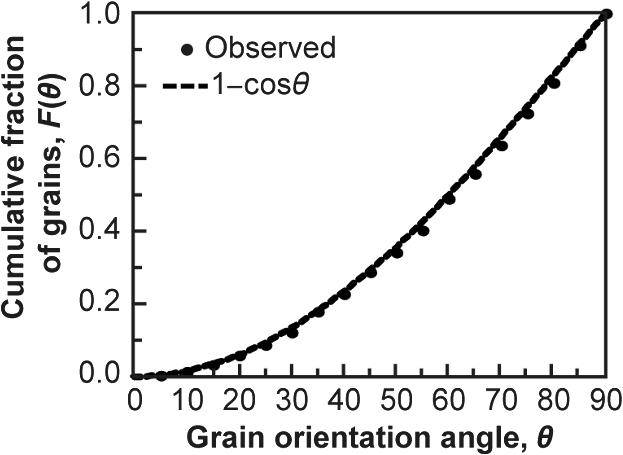 Transmittance from 1.5 to was measured with a nitrogen-purged Perkin Elmer Frontier Optica Fourier transform infrared (FTIR) spectrophotometer. The instrument uses a hot-spot-stabilized silicon carbide source, a thermoelectric-cooled lithium tantalate detector, and an extended-range KBr beamsplitter. Spectra were collected using 6-mm apertures for the Jaquinot and beamsplitter stops. Each spectrum is an average of 32 scans with resolution at a wavelength of . Photometric accuracy is . The 100% transmittance level was measured before each sample scan. A new background was collected if the 100% transmittance at a wavelength of changed by more than . Transmittance from 0.2 to was measured with a 150-mm-diameter integrating sphere on a Perkin-Elmer Lambda 1050 UV–vis–NIR spectrophotometer with a photometric accuracy of . The integrating sphere uses an indium gallium arsenide detector for wavelengths from 0.86 to and a photomultiplier tube for wavelengths from 0.2 to . The FTIR values matched the integrating sphere values to better than in the wavelength region from 1.5 to where the two instruments overlap. Refractive index was measured at the Air Force Research Laboratory using the method of minimum deviation.23,24 To check the experimental apparatus, measurements of refractive index and thermo-optic coefficient were made on calcium fluoride. Room temperature (22°C to 25°C) refractive indices were within of the National Institute of Standards and Technology (NIST) published values.25,26 Values for (change in refractive index with respect to temperature ) were within 5% of those found by NIST. Three triangular prisms of PCA were fabricated with apex angles of , , and . Uncertainties are standard deviations of 10 measurements of apex angle. Prisms had a base and rectangular faces. Low visible transmission of prisms set the lower wavelength for reliable measurements at . Refractive indices were measured at nine temperatures between 22°C and 225°C. A type K thermocouple was mounted inside a small hole drilled into the nontransmitting face of the prism. Permatex Ultra Copper® RTV silicone was used to hold the thermocouple in place and to assure thermal contact with the prism. Samples were placed between two copper blocks heated by Omega CSH series cartridge heaters. Temperature stability was . The temperature was brought to the set point and allowed to stabilize for 30 min before data acquisition. Principal sources of error in room temperature measurements are the two angular measurements of the light rays and variations in temperature of the material. Using twice the standard deviation as the uncertainty in angular measurements, we estimate the uncertainty in refractive index to be at room temperature. 3.Refractive Index of Polycrystalline AluminaRefractive index measurements of three PCA prisms generally agreed within near 296 K, so the index of one prism was measured from to 498 K and fit to the Sellmeier equation where is expressed in , , , , , , , and . The root-mean square deviation of this expression from the measurements is 0.0002. The slope varies with wavelength and temperature, but has the approximate value in the range 296 to 498 K. Table 1 lists the refractive index of PCA from Eq. (1) at 296 and 498 K.Table 1Refractive index of PCA at 296 and 498 K from Eq. (1).
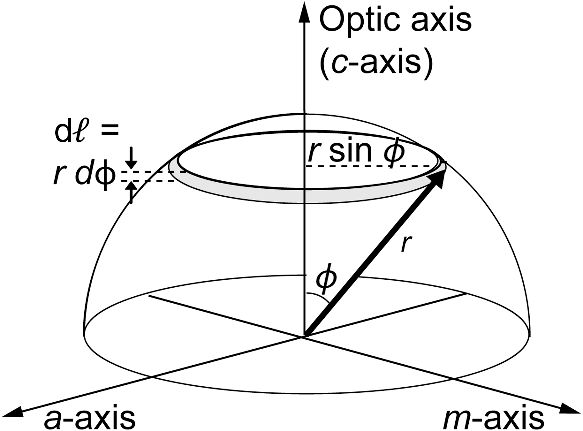
4.Ordinary and Extraordinary Rays in a Uniaxial CrystalThe optic axis () of sapphire, together with an -axis and one of the -axes in Fig. 1, form a Cartesian coordinate system in Fig. 6(a). A light ray traveling in any direction has oscillating electric and magnetic fields perpendicular to the direction of travel of the ray. The electric field of any light ray traveling in the direction of the crystal oscillates perpendicular to . Any ray whose electric field oscillates perpendicular to is called an ordinary ray and has refractive index , the ordinary refractive index. Fig. 6(a) Illustration of different o-rays and e-rays. (b) Ray traveling at angle with respect to the optic axis (-axis). Plane containing ray and optic axis is principal plane. Ordinary ray electric field oscillates perpendicular to principal plane. Extraordinary ray electric field oscillates in principal plane. Ordinary and extraordinary rays can travel in any direction through the crystal, except that every ray traveling along the optic axis is an ordinary ray. 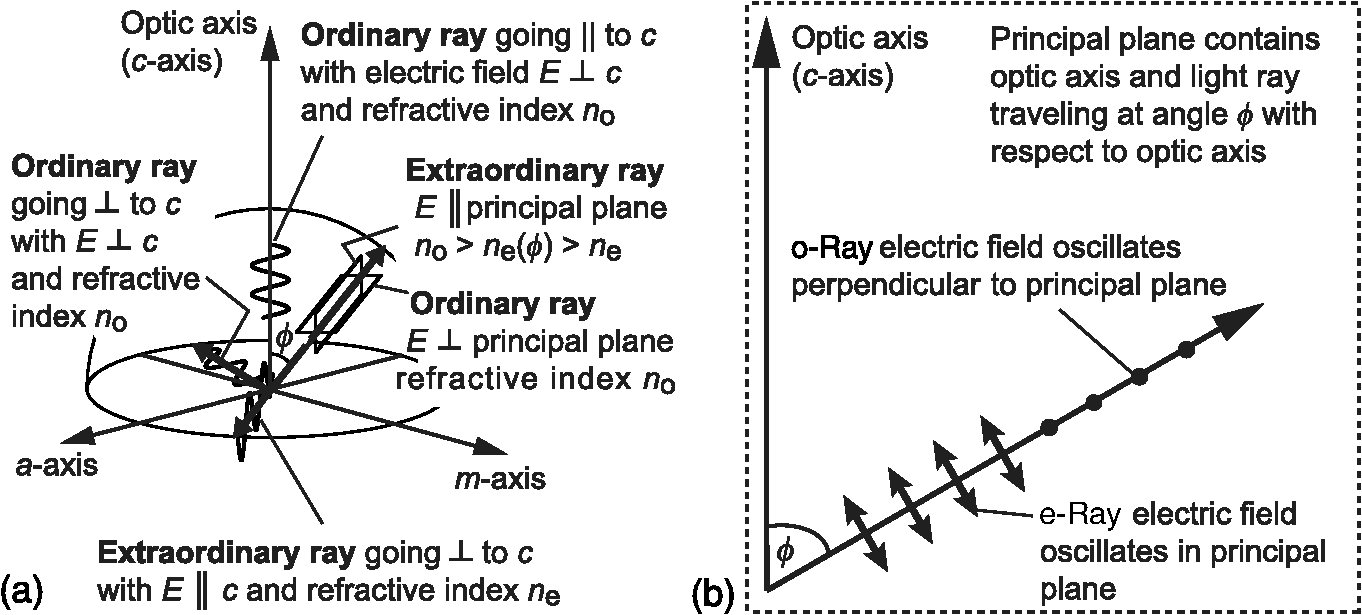 Consider a randomly polarized light ray traveling in any direction in the am (basal) plane of the sapphire crystal in Fig. 6(a). The ray can be decomposed into one plane polarized component whose electric field oscillates parallel to the -axis and one whose electric field oscillates perpendicular to . The component whose electric field oscillates perpendicular to () is an ordinary ray and has refractive index . The component whose electric field oscillates parallel to () is called an extraordinary ray and has refractive index , the extraordinary refractive index. A random polarized ray traveling in any direction through the sapphire crystal has ordinary and extraordinary components. Consider the ray in Fig. 6(a) enlarged in Fig. 6(b) traveling at angle with respect to the -axis. The plane containing the ray and the -axis, shown by the dashed outline in Fig. 6(b), is called the principal plane. The electric field of an ordinary ray oscillates perpendicular to the principal plane and the refractive index is always . The electric field of an extraordinary ray oscillates in the principal plane. An extraordinary ray traveling at angle with respect to the -axis has refractive index given by Ref. 27 The value of lies between and , and goes to when , and to when .We can calculate for sapphire from and given by Sellmeier Eqs. (3) and (4) for the wavelength range to at 20°C.28–30 For the temperature range 296 to 873 K and the wavelength range 1 to , the ordinary and extraordinary refractive indices of sapphire are given as The coefficients for in Eq. (5) are31 and the coefficients for in Eq. (5) are Coefficients for Eq. (5) for sapphire in the temperature range 10 to 295 K and wavelength range 1 to are also available.325.Predicting the Refractive Index of PCA from and for SapphireWe model PCA as a fully dense material consisting of randomly oriented grains of . If light traverses a large enough number of grains so that the total pathlength through grains of each orientation is nearly the same, then the refractive index for randomly polarized light ought to be the average of the ordinary and extraordinary components. The component arises from all rays with . An equal component arising from all extraordinary rays [Fig. 6(b)] is the spatial average of over the surface of a hemisphere Two assumptions in Eq. (6) are that grains are randomly oriented and that the total pathlength through grains of each orientation is nearly the same. Random orientation of grains is confirmed by electron backscatter diffraction in Fig. 5. Equality of pathlength through grains of each orientation is suggested by the following argument: the volume of a prism traversed by light when we measure refractive index is containing grains of diameter. Let us divide all orientations of the optic axis of grains into 100 bins spanning the range from 0 deg to 90 deg, and divide the range of grain sizes into 100 bins, giving combinations of grain orientation and grain size to be sampled when measuring the refractive index. On the average, each bin is sampled times. The probability of encountering one particular bin of grain orientation and size is small (). For an analogy with counting radioactive decay,33 the relative standard deviation in counting decays is . The relative standard deviation in encountering a grain of a given orientation and size is . That is, the standard deviation in optical pathlength through grains of each orientation is . The assumptions in Eq. (6) are met for submicron-grain-size PCA. If grain size were much larger or if the difference between and were much larger, then the assumptions in Eq. (6) could be inadequate. Empirical evidence for the validity of assumptions in Eq. (6) is that the root-mean-square variation in measurements of the three prisms at all wavelengths is . If the assumptions were not valid, we would expect to observe variation of the refractive index between prisms because of insufficient sampling of grain sizes and orientations. Such variation is not observed. The average of a function over a surface is . We find the spatial average over a hemisphere of radius with the aid of Fig. 7, which shows a ray traveling at angle with respect to . The limits of integration are to . The area of the infinitesimal ring of surface is , where the circumference is and the width is the arc length . Therefore, . The spatial average is The denominator of Eq. (7) is the area of a hemisphere, . The numerator was integrated numerically using Simpson’s rule in which the range to was divided into 100 intervals and the shape of the arc in each interval is approximated by a quadratic function. The numerical precision of integration with values of and for sapphire was 1 part in . Substituting numerical values of from Eq. (7) into Eq. (6) gives the expected refractive index of PCA with randomly oriented grains. Results for 296 K in Table 2 and Fig. 8 show that the predicted refractive index of PCA from Eq. (6) agrees with the measured refractive index from Eq. (1) within a root-mean-square difference of 0.0002. The same agreement between measured and predicted refractive index is found at 470 K. Table 2Measured and predicted refractive index of PCA at 296 K.
Fig. 8Observed and predicted refractive indices of PCA and comparison with and for sapphire at 296 K. Points are given by Eq. (1) and solid line prediction is from Eq. (6). Only the range 0.85 to is shown, but the entire measured range 0.85 to has the same quality of fit at 296 and 470 K. 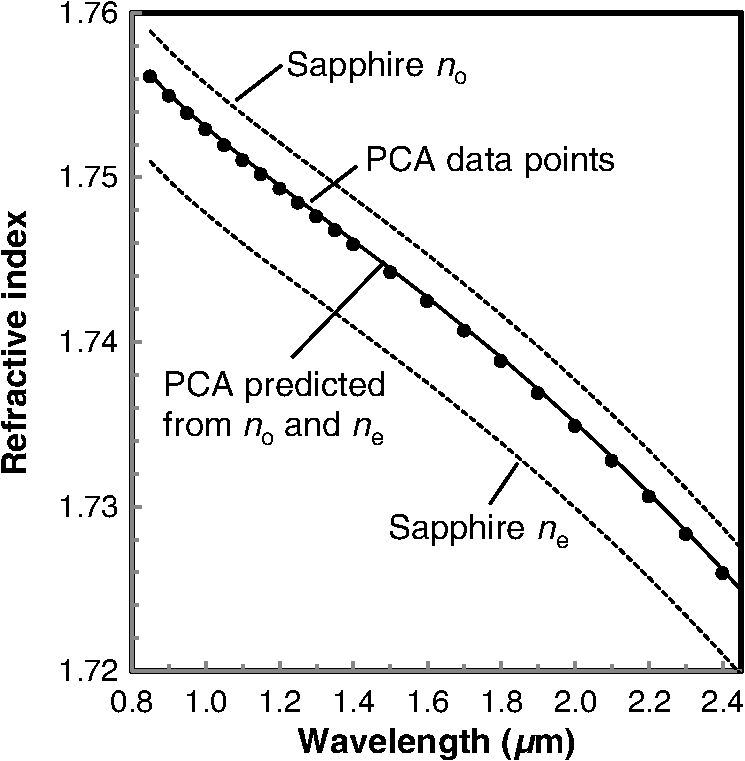 A reviewer of this paper noted that if , then Eqs. (7) and (6) reduce to At 296 and 470 K, the root-mean-square difference between predictions from Eqs. (6) and (8) is , showing that Eq. (8) is an excellent approximation for PCA. However, for calcite with and , Eq. (6) gives and Eq. (8) gives , showing that Eq. (8) is not an excellent approximation for calcite. 6.Ordinary and Extraordinary Components of AbsorptionThe internal transmittance () of light traversing pathlength (cm) inside a material is where is the absorption coefficient measured in . Absorption coefficients for ordinary and extraordinary rays in sapphire in the wavelength range to (wavenumber to ) near 20°C are given as34The refractive index is the real component of the complex refractive index , where . The imaginary component is related to the absorption coefficient by . The absorption coefficient for randomly polarized light traveling at normal incidence through a -plane sapphire window is because all rays traveling parallel to the -axis are ordinary rays with in Fig. 6. For randomly polarized light traveling at normal incidence through an -plane window, the absorption coefficient is because half of the rays have and half have . Measured absorption coefficients for - and -plane sapphires in Table 3 are close to values predicted from and . Table 3Sapphire absorption coefficients for o-ray and e-ray and measured absorption coefficients for normal incidence on c-plane and a-plane sapphire.
Measured absorption coefficients were computed from the transmittance of 1- and 3-mm-thick c-plane and a-plane sapphire using Eq. (12). The absorption coefficients of - and -plane sapphires in Table 3 were computed from the measured transmittance of two thicknesses of material. Sapphire has negligible scatter in the midwave infrared region. Its transmittance is governed by surface reflection and by absorption in the bulk material. If the reflection loss is the same for thin and thick samples, then the quotient of their transmittance is the quotient of their internal transmittance. Writing Eq. (9) for internal transmittance of the thin and thick samples, and then dividing one equation by the other, leads to an expression for the absorption coefficient () where and are the measured transmittances of the thin and thick specimens, respectively.7.Transmittance of Polycrystalline AluminaFigure 9 shows visible and infrared transmittance of PCA and -plane sapphire. The upper PCA trace is from a 2.00-mm-thick disk made from a high quality -thick blank. Peak transmittance of 86.3% is reached near . Below , the principal difference between the transmittance of PCA and sapphire arises from bulk optical scatter in PCA that is negligible in sapphire. Bulk scatter increases as the wavelength decreases and as the grain size of the material increases. The thickness of the blank can be a factor in the grain size of PCA because thicker blanks require longer heat treatment and are, therefore, subject to more grain growth. The lower two PCA spectra in Fig. 9 are from plates cut from one 14-mm-thick blank used to make prisms. The 6-mm-thick prism witness sample has lower transmittance than the 2-mm-thick prism witness sample, which, in turn, has lower transmittance than the 2-mm-thick disk made from a 5-mm-thick blank. Grain size measurements are discussed at the end of this section. Fig. 9Transmittance of PCA and -plane sapphire. Upper solid line is 2.00-mm-thick PCA from a high-optical-quality -thick plate. Middle solid line is 2.114-mm-thick PCA from the 14-mm-thick plate use to make prisms. Lower solid line is 6.070-mm-thick PCA from the same 14-mm-thick plate. Dashed lines are transmittance computed with Eqs. (18) and (19) with grain size as sole adjustable parameter. Dotted line is 3.00-mm-thick -plane sapphire. Occluded seen near in many PCA samples is believed to arise from burnout of organic additives used to make alumina slurry for casting. 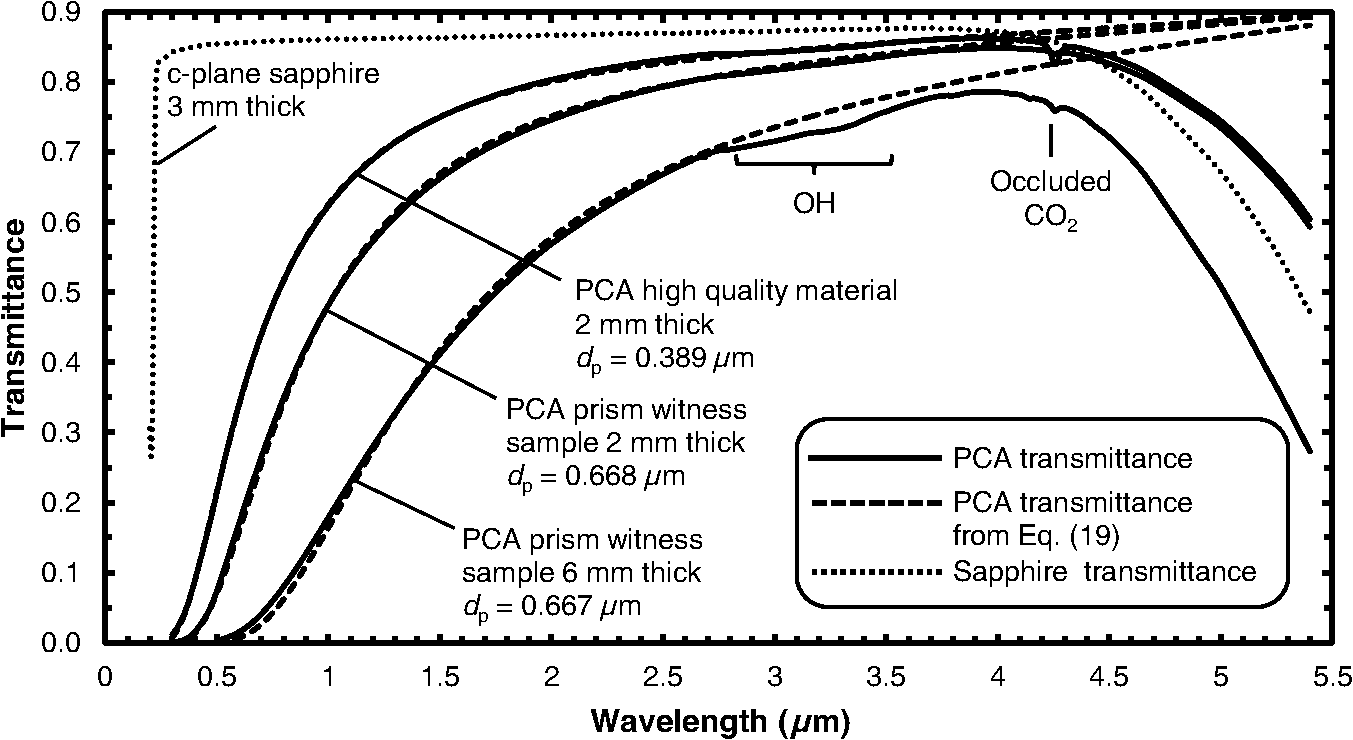 We can predict the absorption coefficient of PCA with randomly oriented grains from the optical constants and for sapphire in Eqs. (10) and (11). A plane polarized ray with is an ordinary ray with optical constant . A plane polarized ray traveling perpendicular to with is an extraordinary ray with optical constant . An extraordinary ray traveling at angle with respect to the -axis has the optical constant given by Ref. 34 where comes from Eq. (2). It is not obvious, but the functions and in Eqs. (2) and (13) have essentially the same angular dependence.By analogy with Eqs. (6) and (7) for the refractive index, the theoretical, isotropic optical constant for PCA is where is the value of averaged over the surface of a hemisphere (Fig. 7)For a sample with reflection and absorption, but no scatter, the external transmittance that we measure in the laboratory for normal incidence is given by where is the absorption coefficient, is the thickness of the window, and is the single-surface reflectance where is the refractive index and .Consider the uppermost PCA curve in Fig. 9. The optical constants of sapphire from Eqs. (5), (10), and (11) at a wavelength of () are , , , and . Spatially averaged values from Eqs. (7) and (15) are and . The predicted isotropic refractive index from Eq. (6) is . The predicted isotropic value of from Eq. (14) is , giving an isotropic absorption coefficient of . The single-surface reflectance from Eq. (17) is and the predicted transmittance from Eq. (16) for the 0.200-cm-thick specimen is 0.754. The observed transmittance in Fig. 7 is 0.745. We attribute the difference of 0.009 to optical scatter in PCA. A model for a fully dense birefringent polycrystalline material is to treat a grain as a spherical particle of diameter (= grain diameter) and refractive index immersed in a homogeneous matrix of refractive index . Grain boundary scattering is equated to optical scatter by the sphere—a problem whose solution was published by Mie in 1908. The Rayleigh–Gans–Debye theory is an approximation to the Mie solution when the quotient is close to 1, the phase of a light ray barely changes when it passes through the spherical particle, and scattering efficiency is small. With these conditions, the scatter coefficient can be written15,22 where , is the volume fraction of scattering particles in the matrix, and is the wavelength in vacuum. Apetz and van Bruggen15 suggested the value , which we employ in our calculations below. Note that there is a 30% decrease in upon going from a wavelength of to a wavelength of .PCA has negligible optical absorption at wavelengths from 0.3 to . In this range, the transmittance of PCA is governed by reflection and scatter and in the form of Eq. (16) with in place of the absorption coefficient After we have selected a value of , the only adjustable parameter in fitting Eqs. (18) and (19) to an observed PCA transmission curve is the grain size, .The three dashed curves in Fig. 9 are least-squares fits of Eqs. (18) and (19) to the three PCA transmission curves. The lower two samples are from the 14-mm-thick plate used to make prisms to measure refractive index. Happily, the grain sizes of the two samples from curve fitting agree with each other (0.668 and ). The grain size from curve fitting the uppermost sample is . Mean grain sizes of the three PCA samples for Fig. 9 were also estimated as 1.56 times the mean intercept length of 6000 to 7000 grains in electron backscatter diffraction maps (Fig. 4).35 Results in Table 4 show rough agreement in grain size of each sample by the two independent methods. Each method gives equal grain size for the two prism witness samples that came from the same blank. Table 4PCA mean grain sizes estimated from curve fitting of transmission spectra and from electron backscatter diffraction grain intercept lengths.
Well-conceived experiments by Wen and Shetty36 showed that agreement between observed and predicted transmittance for a birefringent polycrystalline material is somewhat fortuitous. They measured the real in-line transmittance of suspensions of spherical silica particles of known diameter, known refractive index, and known volume fraction in a liquid of known refractive index. Key assumptions that fail for polycrystalline materials are those of single and independent scattering. Single scattering means that irradiance incident on a particle is derived only from the incident beam and not from scattering by nearby particles. Independence presumes that particles are separated enough so that there is not interference between scattered fields from neighboring scattering centers. Despite these limitations, the approximate theory embodied by the scatter coefficient in Eq. (18) fits the PCA transmission curves remarkably well in Fig. 9. If there were significant porosity in PCA, Eq. (18) would be insufficient to predict in-line transmittance.37 Our measurements of density by the Archimedes method suggest that the alumina is dense. We simulated the transmittance of PCA using a model38–40 that includes reflection and Mie scattering by fixed-diameter particles of aluminum oxide and fixed-diameter pores embedded in a matrix of alumina. The model assumes single and independent scattering. Single scattering means that irradiance incident on a particle is only from the incident beam and not from scattering by nearby particles. Independence means that particles have a sufficiently random arrangement that interference between scattered fields of neighboring particles is negligible. Both assumptions oversimplify PCA, in which the aluminum oxide scattering phase is not dilute. We modeled pores as having a diameter of , which is larger than any pores observed by electron microscopy. At a wavelength of , 0.05 vol. % pores with a diameter of are predicted to lower the transmittance of 2.1-mm-thick PCA with a grain size of from 0.50 to 0.48. At a wavelength of , the transmittance would drop from 0.17 to 0.13 with the same porosity. If there were 0.1 vol. % pores, the transmittance would be 0.46 at . If there were 0.05 vol. % porosity, we estimate that the measured refractive index would be lower than the refractive index of fully dense material by 0.0004, based on volume weighting of two phases with refractive indices of 1.76 and 1.00. If there were 0.1 vol. % porosity, we estimate that the measured refractive index would be lower than the refractive index of fully dense material by 0.0008. Good agreement between the predicted and observed refractive indices in Table 2 is consistent with the alumina having negligible porosity. 8.Refractive Index of Kyropoulos SapphireEquations (3) and (4) for the refractive indices and of sapphire were published by Dodge29 and based on measurements of Malitson and Dodge at the US National Bureau of Standards.30 The original measurements of by Malitson were made with a prism of Linde sapphire obtained in 1956.41,42 To our knowledge, Linde sapphire was grown by the Verneuil method until the early 1960s, when the Czochralski method was perfected to grow sapphire of higher crystal quality for lasers.43 Subsequent measurements of the refractive indices of sapphire as a function of temperature reported by Thomas et al. in 2001 and 200231,32 were made with sapphire from Crystal Systems grown by the heat exchanger method. Thomas data for 296 K agree with Eqs. (3) and (4) within in the wavelength range 1 to . We have now measured the refractive index of sapphire grown by the Kyropoulos method44 at Rubicon Technology45 in 2016. Refractive indices and measured at agree with Eqs. (3) and (4) within a root-mean-square difference of 0.0002. We conclude that the refractive index of sapphire grown by the Verneuil, heat exchanger, and Kyropoulos methods are all the same within near room temperature. 9.SummaryOrdinary light rays passing through an axially symmetric crystal such as sapphire () are polarized with their electric field oscillating perpendicular to the symmetry axis (-axis) of the crystal. Extraordinary rays are polarized with their electric field oscillating in the principal plane containing the optic axis and the light ray in Fig. 6(b). The temperature-dependent refractive index of fully dense, transparent PCA, with randomly oriented grains of , is accurately represented by , where is the ordinary refractive index of sapphire and is the spatial average of the extraordinary refractive index over the surface of a hemisphere. This equality exists because half of the rays of randomly polarized light passing through alumina have the ordinary refractive index, , and half have the directionally dependent extraordinary refractive index , in which is the angle between the -axis of the crystal and the direction of the ray. The optical constant for absorption of light by PCA is similarly equal to , where is the optical constant for the ordinary ray and is the directionally dependent optical constant for the extraordinary ray averaged over the surface of a hemisphere. The wavelength-dependent optical scatter loss in fully dense, transparent PCA is closely fit by the model of Apetz and van Bruggen with the scatter coefficient in Eq. (18) having the mean grain diameter as the only adjustable constant. AcknowledgmentsWe thank Randy Dewees of the Naval Air Warfare Center for optical polishing and Hap Hewes of Rubicon Technology for providing sapphire prisms. ReferencesD. C. Harris, Materials for Infrared Windows and Domes, SPIE Press, Bellingham, Washington
(1999). Google Scholar
E. S. Dana and W. E. Ford, A Textbook of Mineralogy, 481 4th ed.Wiley, New York
(1932). Google Scholar
E. R. Dobrovinskaya, L. A. Lytvynov and V. Pishchik, Properties of Sapphire, 76 Springer, Berlin
(2009). Google Scholar
R. L. Coble,
“Sintering crystalline solids: I. Intermediate and final stage diffusion models; II. Experimental test of diffusion models in powder compacts,”
J. Appl. Phys., 32 787
–793
(1961). http://dx.doi.org/10.1063/1.1736107 JAPIAU 0021-8979 Google Scholar
N. Grimm, G. E. Scott and J. D. Sibold,
“Infrared transmission properties of high density alumina,”
Ceram. Bull., 50 962
–965
(1971). ACSBA7 0002-7812 Google Scholar
J. G. J. Peelen and R. Metselaar,
“Light scattering by pores in polycrystalline materials: transmission properties of alumina,”
J. Appl. Phys., 45 216
–220
(1974). http://dx.doi.org/10.1063/1.1662961 JAPIAU 0021-8979 Google Scholar
J. G. J. Peelen,
“Transparent hot-pressed alumina: II. Transparent versus translucent alumina,”
Ceramurgia Int., 5 115
–119
(1979). http://dx.doi.org/10.1016/0390-5519(79)90016-4 CEINDW 0390-5519 Google Scholar
K. Hayashi et al.,
“Transmission optical properties of polycrystalline alumina with submicron grains,”
Mater. Trans. JIM, 32 1024
–1029
(1991). http://dx.doi.org/10.2320/matertrans1989.32.1024 MTJIEY 0916-1821 Google Scholar
H. Mizuta et al.,
“Preparation of high-strength and translucent alumina by hot isostatic pressing,”
J. Am. Ceram. Soc., 75 469
–473
(1992). http://dx.doi.org/10.1111/jace.1992.75.issue-2 JACTAW 0002-7820 Google Scholar
D. Godlinski, M. Kuntz and G. Grathwohl,
“Transparent alumina with submicrometer grains by float packing and sintering,”
J. Am. Ceram. Soc., 85 2449
–2456
(2002). http://dx.doi.org/10.1111/jace.2002.85.issue-10 JACTAW 0002-7820 Google Scholar
A. Krell et al.,
“Transparent sintered corundum with high hardness and strength,”
J. Am. Ceram. Soc., 86 12
–18
(2003). http://dx.doi.org/10.1111/jace.2003.86.issue-1 JACTAW 0002-7820 Google Scholar
A. Krell et al.,
“Processing of high-density submicrometer for new applications,”
J. Am. Ceram. Soc., 86 546
–553
(2003). http://dx.doi.org/10.1111/jace.2003.86.issue-4 JACTAW 0002-7820 Google Scholar
A. Krell, G. Baur and C. Dähne,
“Transparent sintered sub- with IR transmissivity equal to sapphire,”
Proc. SPIE, 5078 199
(2003). http://dx.doi.org/10.1117/12.485770 Google Scholar
R. Apetz and M. P. B. van Bruggen,
“Transparent alumina: a light scattering model,”
J. Am. Ceram. Soc., 86 480
–486
(2003). http://dx.doi.org/10.1111/jace.2003.86.issue-3 JACTAW 0002-7820 Google Scholar
M. V. Parish, M. R. Pascucci and W. H. Rhodes,
“Aerodynamic IR domes of polycrystalline alumina,”
Proc. SPIE, 5786 195
(2005). http://dx.doi.org/10.1117/12.604596 Google Scholar
G. Bernard-Granger, C. Guizard and A. Addad,
“Sintering of an ultra-pure α-alumina powder. I-Densification, grain growth and sintering path,”
J. Mater. Sci., 42 6316
–6324
(2007). http://dx.doi.org/10.1007/s10853-006-1206-1 JMTSAS 0022-2461 Google Scholar
G. Bernard-Granger, C. Guizard and N. Monchalin,
“Sintering of an ultrapure -alumina powder: II. Mechanical, thermo-mechanical, optical properties, and missile dome design,”
Int. J. Appl. Ceram. Technol., 8 366
–382
(2011). http://dx.doi.org/10.1111/ijac.2011.8.issue-2 Google Scholar
D. Taylor,
“Thermal expansion data: III Sesquioxides, , with the corundum and the A-, B- and structures,”
Trans. J. Br. Ceram. Soc., 83 92
–98
(1984). Google Scholar
Washington, DC
(1983). Google Scholar
F. J. Humphreys,
“Review: grain and subgrain characterization by electron backscattering diffraction,”
J. Mater. Sci., 36 3833
–3854
(2001). http://dx.doi.org/10.1023/A:1017973432592 JMTSAS 0022-2461 Google Scholar
T.-C. Wen and D. K. Shetty,
“On the effect of birefringence on light transmission in polycrystalline magnesium fluoride,”
J. Am. Ceram. Soc., 98 829
–837
(2015). http://dx.doi.org/10.1111/jace.2015.98.issue-3 JACTAW 0002-7820 Google Scholar
M. Born, E. Wolf and A. B. Bhatia, Principles of Optics, 191
–192 7th ed.Cambridge University Press, New York
(1999). Google Scholar
D. E. Zelmon et al.,
“Optical properties of lithium terbium fluoride and implications for performance in high power lasers,”
Appl. Opt., 55 834
–837
(2016). http://dx.doi.org/10.1364/AO.55.000834 APOPAI 0003-6935 Google Scholar
I. Malitson,
“Revisiting the optical properties of calcium fluoride,”
Appl. Opt., 2 1103
–1107
(1963). http://dx.doi.org/10.1364/AO.2.001103 APOPAI 0003-6935 Google Scholar
A. Feldman et al.,
“Optical materials characterization,”
(1978). Google Scholar
R. Tilley, Colour and the Optical Properties of Materials, 56 Wiley, Chichester
(2000). Google Scholar
W. J. Tropf, M. E. Thomas, T. J. Harris,
“Properties of crystals and glasses,”
Handbook of Optics, II 2nd ed.McGraw-Hill, New York
(1995). Google Scholar
M. J. Dodge,
“Refractive index,”
CRC Handbook of Laser Science and Technology, IV CRC Press, Boca Raton
(1986). Google Scholar
I. H. Malitson and M. Dodge,
“Refractive index and birefringence of synthetic sapphire,”
J. Opt. Soc. Am., 62 1405
(1972). JOSAAH 0030-3941 Google Scholar
D. Yang, M. E. Thomas and S. G. Kaplan,
“Measurement of the infrared refractive index of sapphire as a function of temperature,”
Proc. SPIE, 4375 53
(2001). http://dx.doi.org/10.1117/12.439193 Google Scholar
S. G. Kaplan and M. E. Thomas,
“Measurement of the o-ray and e-ray infrared refractive index and absorption coefficient of sapphire from 10 K to 295 K,”
Proc. SPIE, 4822 41
(2002). http://dx.doi.org/10.1117/12.451770 Google Scholar
P. Siegel,
“Statistics of nuclear decay,”
Bio431: Radiation Biology Lecture Notes and Lab Experiments, California State Polytechnic University, Eq. (22),https://www.cpp.edu/~pbsiegel/bio431/texnotes/chapter2.pdf Google Scholar
P. S. Wayland et al.,
“Multiphonon extraordinary-ray absorption coefficient for sapphire,”
Infrared Phys. Technol., 41 307
–312
(2000). http://dx.doi.org/10.1016/S1350-4495(00)00044-X IPTEEY 1350-4495 Google Scholar
M. I. Mendelson,
“Average grain size in polycrystalline ceramics,”
J. Am. Ceram. Soc., 52 443
–446
(1969). http://dx.doi.org/10.1111/jace.1969.52.issue-8 JACTAW 0002-7820 Google Scholar
T.-C. Wen and D. K. Shetty,
“An assessment of the applicability of particle light scattering theories to birefringent polycrystalline ceramics,”
J. Am. Ceram. Soc., 99 551
–556
(2016). http://dx.doi.org/10.1111/jace.14014 JACTAW 0002-7820 Google Scholar
I. Yamashita, H. Nagayama and K. Tsukuma,
“Transmission properties of translucent polycrystalline alumina,”
J. Am. Ceram. Soc., 91 2611
–2616
(2008). http://dx.doi.org/10.1111/jace.2008.91.issue-8 JACTAW 0002-7820 Google Scholar
W. J. Wiscombe,
“Improved Mie scattering algorithms,”
Appl. Opt., 19 1505
–1509
(1980). http://dx.doi.org/10.1364/AO.19.001505 APOPAI 0003-6935 Google Scholar
C. F. Bohren and D. R. Huffman, Absorption and Scattering of Light by Small Particles, Wiley, New York
(1983). Google Scholar
B. J. Zelinski et al.,
“Optical modeling and characterization of the spectral transmittance of nanocomposite optical ceramics for IR windows and domes,”
in Proc. 12th DoD Electromagnetic Windows Symp.,
(2008). Google Scholar
I. H. Malitson,
“Refraction and dispersion of synthetic sapphire,”
J. Opt. Soc. Am., 52 1377
–1379
(1962). http://dx.doi.org/10.1364/JOSA.52.001377 JOSAAH 0030-3941 Google Scholar
I. H. Malitson, Jr. F. V. Murphy and W. S. Rodney,
“Refractive index of synthetic sapphire,”
J. Opt. Soc. Am., 48 72
–73
(1958). http://dx.doi.org/10.1364/JOSA.48.000072 JOSAAH 0030-3941 Google Scholar
K. Nassau, Gems Made by Man, Chilton Book Co., Radnor
(1980). Google Scholar
D. C. Harris,
“A century of sapphire crystal growth: origin of the EFG method,”
Proc. SPIE, 7425 74250P
(2009). http://dx.doi.org/10.1117/12.824452 Google Scholar
D. C. Harris,
“Evolution of the sapphire industry: Rubicon technology and Gavish,”
Proc. SPIE, 7302 730202
(2009). http://dx.doi.org/10.1117/12.816843 Google Scholar
|